

Summary
Monocyte‐derived macrophages (MDMs) generated from peripheral blood monocytes are widely used to model human macrophages for in vitro studies. However, the possible impact of different isolation methods on the resulting MDM phenotype is poorly described. We aimed to investigate the effects of three commonly used monocyte isolation techniques on the resulting MDM phenotype. Plastic adhesion, negative selection, and CD14pos selection were compared. Monocyte‐derived macrophages were generated by 5‐day culture with macrophage and granulocyte–macrophage colony‐stimulating factors. We investigated monocyte and MDM yields, purity, viability, and cell phenotype. CD14pos selection resulted in highest monocyte yield (19·8 × 106 cells, equivalent to 70% of total) and purity (98·7%), compared with negative selection (17·7 × 106 cells, 61% of total, 85·0% purity), and plastic adhesion (6·1 × 106 cells, 12·9% of total, 44·2% purity). Negatively selected monocytes were highly contaminated with platelets. Expression of CD163 and CD14 were significantly lower on CD14pos selection and plastic adhesion monocytes, compared with untouched peripheral blood mononuclear cells. After maturation, CD14pos selection also resulted in the highest MDM purity (98·2%) compared with negative selection (94·5%) and plastic adhesion (66·1%). Furthermore, MDMs from plastic adhesion were M1‐skewed (CD80high HLA‐DRhigh CD163low), whereas negative selection MDMs were M2‐skewed (CD80low HLA‐DRlow CD163high). Choice of monocyte isolation method not only significantly affects yield and purity, but also impacts resulting phenotype of cultured MDMs. These differences may partly be explained by the presence of contaminating cells when using plastic adherence or negative selection. Careful considerations of monocyte isolation methods are important for designing in vitro assays on MDMs.
Keywords: CD163, cell culture, macrophage, monocyte, monocyte‐derived macrophage
Different monocyte‐isolation techniques affect both cell yield, and purity and phenotype of isolated monocytes and monocyte‐derived macrophages in vitro.
Abbreviations
- FCS
fetail calf serum
- GM‐CSF
granulocyte–macrophage colony‐stimulating factor
- IFN
interferon
- IL
interleukin
- LPS
lipopolysaccharide
- M‐CSF
macrophage colony‐stimulating factor
- MDM
monocyte‐derived macrophage
- PBMC
peripheral blood mononuclear cell
- PBS
phosphate‐buffered saline
- sCD163
soluble CD163
- sCD206
soluble CD206
- TLR
toll‐like receptor
- TNF
tumor necrosis factor
Introduction
Macrophages have important functions in health and disease, including vital homeostatic functions.1 Macrophages present with a spectrum of different phenotypes, ranging from pro‐inflammatory (M1‐like) to anti‐inflammatory (M2‐like) macrophages, which should be considered as two extremes of a continuum.2 M2‐like macrophages are further subdivided into M2a, M2b, and M2c macrophages.2 Polarization of macrophages in vitro, can be accomplished by stimulation with lipopolysaccharide (LPS) and interferon‐γ (IFN‐γ) (M1 polarization), or interleukin‐4 (IL‐4) and IL‐13, or IL‐10 (M2a and M2c polarization, respectively).2, 3 Interestingly, macrophages are highly plastic cells, with the ability to switch between phenotypes and polarization states.4 Because of this plasticity, it is important to know how in vitro culture techniques impact polarization and phenotype of the monocyte‐derived macrophages (MDMs).
Monocytes are macrophage precursors and together they constitute an important part of the mononuclear phagocyte system.5 Ex vivo monocytes are divided into three distinct subpopulations based on their expression of CD14 and CD16: classical monocytes with CD14high CD16neg expression, intermediate monocytes with CD14high CD16pos, and non‐classical monocytes with CD14low CD16high.6 Ex vivo monocytes purified from healthy donor peripheral blood mononuclear cells (PBMCs) are a key source of monocytes, and MDMs are the principal source of cells for in vitro studies in human macrophages.
Different methods have been employed to purify monocytes from PBMCs. Three commonly used methods are plastic adhesion and magnetic bead‐based immuno‐isolation kits (negative and CD14pos selection). It is important that the method chosen produce pure monocyte/MDM populations with low contamination by lymphocytes, granulocytes, and platelets. Further, it is important to know how the methods alter or activate the isolated cells, because skewing of phenotype and functionality may affect experimental results.
Previous studies evaluating the effects of different monocyte isolation methods have primarily focused on the resulting monocytes and monocyte‐derived dendritic cells, whereas the impact on the subsequent MDMs generated from purified monocytes is poorly described. The observed effects of different monocyte isolation methods on monocytes and monocyte‐derived dendritic cells differ widely between studies7, 8, 9, 10, 11, 12, 13, 14, 15, 16, 17, 18, 19, 20 making it difficult to deduce the effects of monocyte isolation methods on MDMs (see Supplementary material, Table S1, for overview of refs 8–21). Therefore, the purpose of the present study was to evaluate the effects of the three commonly used monocyte isolation methods, plastic adhesion, negative selection, and CD14pos selection, on resulting human monocytes and MDMs.
Materials and methods
Isolation of PBMCs
Buffy coats (≈50 ml) from six anonymous healthy donors were obtained from the blood bank at the Department of Clinical Immunology, Aarhus University Hospital, Aarhus, Denmark (project no. 0094). According to Danish law, the use of anonymized buffy coats does not require specific ethical approval.
The PBMCs were isolated from buffy coats. The buffy coats were diluted 1 : 2 in 0·9% NaCl, and the PBMCs were isolated using density gradient centrifugation on a Histopaque‐1077 gradient (Sigma‐Aldrich, Munich, Germany). Centrifugation was performed at room temperature, 400 g, for 30 min. After isolation, cells were washed once in phosphate‐buffered saline (PBS) with 2% fetal calf serum (FCS) (ThermoFisher Scientific, Waltham, MA) and 1 mm EDTA (Merck Millipore, Burlington, MA). Subsequently, PBMCs were split in three: 50% used for plastic adhesion and 25% for both negative and CD14pos selection. Hence, the plastic adhesion yield results were divided by 2.
Monocyte isolation
Monocytes were isolated in parallel by either CD14pos selection with EasySep™ Human CD14 Positive Selection Kit II, negative selection with EasySep™ Human Monocyte Isolation Kit (Stemcell Technologies, Vancouver, Canada), or by plastic adherence as described below.
Negative and CD14pos selection
After PBMC isolation, cells were washed again in PBS with 2% FCS and 1 mm EDTA, resuspended in the appropriate buffer, and monocytes were isolated by either negative or CD14pos selection, using immunoselection according to the manufacturer's protocol.
Briefly, PBMCs for CD14pos selection were diluted to 1 × 10⁸ cells/ml and incubated with 100 µl/ml selection antibody cocktail for 10 min before the addition of 100 µl/ml RapidSpheres. After an additional 5 min incubation, PBMCs were placed in the ‘Big Easy’ magnet (StemCell Technologies) for 3 min, the supernatant containing non‐monocyte cells was poured off, and the monocytes were resuspended in PBS (2% FCS, 1 mm EDTA). This was repeated three times. After isolation, CD14pos‐selected monocytes were washed in PBS (1% FCS), and resuspended in complete maturation medium (see below for details), and placed in the incubator.
For negative selection, PBMCs were diluted to 5 × 10⁷ cells/ml and incubated with 50 µl/ml isolation antibody cocktail and 50 µl/mL platelet removal cocktail for 5 min before the addition of 50 µl/ml RapidSpheres. After an additional 5 min of incubation, PBMCs were placed in the magnet for 3 min and the supernatant, containing monocytes, was collected and washed in PBS (1% FCS). The monocytes were resuspended in complete maturation medium and placed in the incubator.
Plastic adhesion
The PBMCs were washed once in PBS with 2% FCS and resuspended in RPMI‐1640 (ThermoFisher Scientific) with 10% human AB serum (Sigma‐Aldrich). For monocyte isolation, 1 × 10⁸ to 2 × 10⁸ PBMCs were plated in 1 Nuclon™ Delta surface treated T‐75 cell culture flasks (ThermoFisher Scientific) at 1 × 10⁷ to 2 × 10⁷ PBMCs/ml in 10 ml, and allowed to adhere in a 5% CO2 container at 37° for 1 hr. Non‐adherent cells were removed by thorough washing with RPMI‐1640. Adherent cells were harvested after 15 min of incubation in PBS with ‘detach buffer’; 0·5% bovine serum albumin, 5 mm EDTA, and 4 mg/ml lidocaine hydrochloride monohydrate (Sigma‐Aldrich) using a cell scraper. Monocytes were washed in PBS with 1% FCS, and resuspended in complete maturation media.
Maturation of monocytes to monocyte‐derived macrophages
For MDM differentiation, purified cells were cultured in non‐treated T‐75 flasks in complete maturation media (RPMI‐1640 with 10% FCS, 100 U/100 µg/ml penicillin/streptomycin (ThermoFisher Scientific), 10 ng/ml macrophage colony‐stimulating factor (M‐CSF) (Peprotech, Stockholm, Sweden), and 1 ng/ml granulocyte–macrophage colony‐stimulating factor (GM‐CSF) (Peprotech) for 5 days for MDM differentiation. Media were changed every 2–3 days.
Monocyte‐derived macrophage stimulation
After MDM differentiation, cells were harvested using detach buffer, and MDMs derived from each purification method were stimulated with either 100 ng/ml LPS and 20 ng/ml IFN‐γ (M1‐stimulation), 10 ng/ml IL‐4 and 10 ng/ml IL‐13 (M2a stimulation), 10 ng/ml IL‐10 (M2c stimulation) or left untreated (UT) for 24 hr. For each stimulation, two wells were prepared, one for flow cytometric analysis and one for RNA isolation. The MDMs for flow cytometry were harvested using detach buffer.
Yield and viability
Cell yield and viability were measured on a NucleoCounter® NC‐250™ using Solution 18 containing Acridine Orange and DAPI (ChemoMetic A/S, Allerod, Denmark).
Flow cytometry
Antibody staining for flow cytometry was done in stain buffer (PBS, 0·5% BSA, 0·09% NaN3) at 4° in the dark for 30 min, followed by washing in stain buffer and fixation in PBS with 0·9% formaldehyde. Cells were stained with the following antibodies: mouse anti‐human antibodies: anti‐CD14 V450 (clone MøP9, conc. 1·5 µg/ml), anti‐CD45 AF700 (clone HI30, conc. 2·5 µg/ml), anti‐CD80 V450 (clone L307·4, conc. 0·2 µg/ml) from BD Biosciences (Erembodegem, Belgium), anti‐CD11b BV510 (clone ICRF44, conc. 1·5 µg/mL), anti‐HLA‐DR fluorescein isothiocyanate (clone L243, conc. 6 µg/mL), anti‐CD16 AF647 (clone 3g8, conc. 1·0 µg/ml), anti‐CD206 allophycocyanin (clone 15‐2, conc. 3 µg/ml) from Biolegend (San Diego, CA), anti‐CD163 phycoerythrin (clone Mac2‐158, conc. 0·4 µg/ml) from Trillium Diagnostics (Brewer, ME), anti‐CD56 phycoerythrin (clone N901, conc. 0·1 µg/ml) from Beckman Coulter (Brea, CA) and humanized anti‐Toll‐like receptor 2 (TLR2) phycoerythrin‐Vio770 (REA109, conc. 2·2 µg/ml), anti‐CD3 Vioblue (REA613, conc. 4·4 µg/ml), anti‐CD19 allophycocyanin (REA675, conc. 0·1 µg/ml) from Miltenyi Biotec (Bergisch Gladbach, Germany). In addition, cells were stained with live/dead fixable dye near‐IR (ThermoFisher Scientific) to identify live cells. Reagents were titrated for optimal performance. Blocking of non‐specific binding was achieved with purified human IgG (Beriglobin) (CSL Behring, Pennsylvania).21
Spectral overlap compensation was performed using single‐stained antibody capture beads, BD™ CompBeads Plus (BD Biosciences), OneComp eBeads™ (ThermoFisher), or MACS® Comp Bead Kit anti‐REA (Miltenyi Biotec), and ArC™ Amine Reactive Compensation Bead Kit for Live/dead (ThermoFisher).
Flow cytometry data was acquired on a Navios flow cytometer (Beckman Coulter) and flow cytometry data was analyzed using flowjo 10·4 for Windows (FlowJo, LLC, Ashland, OR).
Immediately after monocyte purification, cells isolated using all three methods, along with PBMCs before isolation, were stained with live/dead and the following antibody panels: Monocyte panel: Anti‐CD11b, ‐CD14, ‐CD16, ‐CD45, ‐CD163, ‐HLA‐DR, ‐TLR2 or Lymphocyte panel: Anti‐CD3, ‐CD19, ‐CD45, ‐CD56, ‐TLR2. Monocytes were identified as CD11b‐ and TLR2‐positive events.22
After MDM maturation and stimulation, cells isolated using all three methods were stained with live/dead and the following antibody panels: MDM panel: Anti‐CD45, ‐CD80, ‐CD163, ‐CD206, ‐HLA‐DR, or Lymphocyte panel: Anti‐CD3, ‐CD11b, ‐CD15, ‐CD19, ‐CD45, ‐CD56, ‐TLR2.
Soluble proteins and cytokine measurements
Soluble CD163 and sCD206 were measured using in‐house enzyme‐linked immunosorbent assays as described in refs 23, 24 with the alteration that analysis for this study was performed on an automated system, BEP 2000 (Siemens Healthcare Diagnostics, Munich, Germany). For sCD163 and sCD206 analyses, media samples were diluted 1 : 5 in PBS/albumin buffer, pH 7·2. Tumor necrosis factor‐α (TNF‐α) and IL‐6 were measured using Human TNF‐α DuoSet ELISA and Human IL‐6 DuoSet ELISA (R&D Systems, Minneapolis, MN), according to the manufacturer's instructions.
RNA extraction and quantitative PCR
RNA from the stimulated MDMs was extracted using a QIAamp® RNA Blood Mini Kit (Qiagen, Sollentula, Sweden) according to the manufacturer's protocol. In short, the cells were lyzed in RLT buffer and mixed with 70% ethanol. Samples were transferred to QIAamp spin columns, centrifuged and washed in RW1 buffer. After washing, the samples were treated with DNase for 15 min at room temperature, washed, centrifuged, and resuspended in H2O. RNA concentrations were measured by NanoDrop 2000 spectrophotometer (ThermoFisher Scientific).
Purified RNA was reverse transcribed to cDNA using the iScript™ Advanced cDNA Synthesis Kit (Bio‐Rad, Hercules, CA) performed at 42° for 30 min followed by 1 min at 95°. RNA input was 100 ng in a 20‐µl reaction.
Quantitative polymerase chain reaction was performed using a LightCycler 480 (Roche, Basel, Switzerland). The reaction was performed with 1 µl cDNA in a 10 µl volume with primers and 5 µl SYBR Green MasterMix (Roche). For primer sequences, see Supplementary material (Table S2). Samples were pre‐incubated at 95° for 10 min, followed by 50 amplification cycles of 95° for 10 seconds, primer‐specific annealing temperature for 20 seconds and 75° for 5 seconds.
Statistical analyses
All statistical analyses were performed using graphpad prism 7·04 for Windows. Normally distributed data and log‐normally distributed data (after transformation) were analyzed using analysis of variance or repeated measures analysis of variance with Tukey's multiple comparisons test, whereas non‐normally distributed data were analyzed using Friedman test and Dunn's multiple comparisons test.
Results
A flowchart showing the study design, and analyses performed at each step is shown in Fig. 1.
Figure 1.
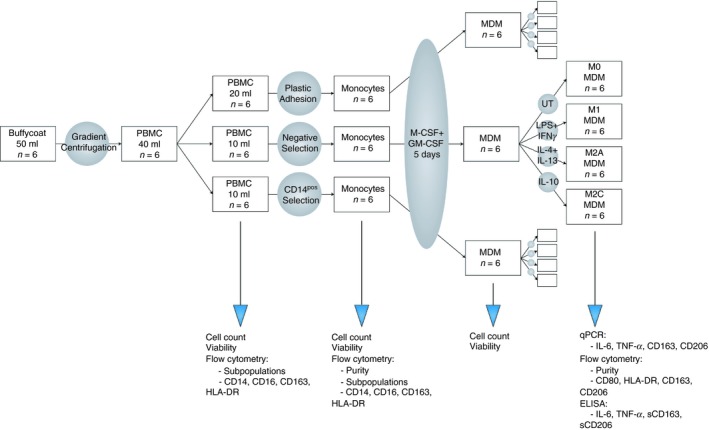
Experiment flow chart. The present study was conducted as described above.
Impact of isolation methods on resulting monocyte populations
Isolating monocytes from PBMCs is a common way of obtaining purified monocytes for in vitro studies. We wanted to explore the effects of different monocyte isolation methods on cell yield, viability, and purity as well as monocyte phenotype.
Peripheral blood mononuclear cells were isolated from six donors with a median PBMC count of 665·5 × 106 total cells with range (399·0 × 106 to 750·0 × 106) and median viability of 97·8% (89·0–98·6). Median monocyte percentage in PBMCs was 15% (8·9–28·8), giving a median monocyte count in PBMC samples of 97·4 × 106 (35·4 × 106 to 193·8 × 106) cells. For monocyte isolation, PBMCs were divided into three; 50% of the PBMCs was used for plastic adhesion isolation, while 25% was used for negative and CD14pos selection each. Plastic adhesion yields were normalized to account for higher PBMC starting count.
CD14pos selection results in the highest monocyte yield and purity
Purifying monocytes using negative or CD14pos selection resulted in the highest total cell yield, with medians (range) 17·7 × 106 (12·0 × 106 to 37·0 × 106) cells (median 60·8% of total number of monocytes in PBMCs) and 19·8 × 106 (12·0 × 106 to 32·0 × 106) cells (median 70·1% of PBMCs), respectively, compared with 6·1 × 106 (4·0 × 106 to 20·0 × 106) cells (median 12·9% of PBMCs) with plastic adhesion (P = 0·002 for both). Furthermore, monocytes isolated with negative or CD14pos selection displayed slightly higher viability, 97% and 96%, respectively, compared with 90% with plastic adhesion (P < 0·005 for both, Table 1). Monocyte purity was evaluated using flow cytometry (Fig. 2a). We observed high platelet contamination in monocyte populations isolated with both negative selection and plastic adhesion (resulting in low monocyte count as % of all events Table 1). Evaluating monocyte purity as percentage of CD45pos leukocytes, CD14pos selection resulted in the purest monocyte population with 99% monocytes. Negative selection resulted in a slightly lower monocyte purity with 85% monocytes (P = 0·01), whereas plastic adhesion resulted in the lowest monocyte purity with only 44% monocytes (P < 0·0001 for comparison with both negative and CD14pos selection). Plastic adhesion leukocyte contamination was primarily with lymphocytes. Hence, when multiplying cell yield with purity, the total monocyte yields were (medians) 2·5 × 106 monocytes for plastic adhesion, 14·5 × 106 monocytes for negative selection, and 19·5 ×106 monocytes for CD14pos selection (Table 1).
Table 1.
Monocyte yield, viability, and purity of plastic adhesion, negative and CD14pos selection1
| Method | Total cell yield (×106 cells) | Viability (%) | Purity (%) of all events | Purity (%) of CD45pos cells | Live monocyte yield (×106 cells) |
|---|---|---|---|---|---|
| Plastic adhesion | 6·1 (4·0–20·0) | 89·9 (85·0–94·6) | 25·0 (11·2–46·8) | 44·2 (32·7–67·1) | 2·5 (1·7–13·42) |
| Negative selection | 17·7 (12·0–37·0) | 96·9 (94·7–98·5) | 7·8 (2·7–48·9) | 85·0 (70·5–93·0) | 14·5 (10·2–32·5) |
| CD14pos selection | 19·8 (12·0–32·0) | 95·7 (92·5–97·9) | 96·9 (78·6–97·4) | 98·7 (97·0–99·2) | 19·5 (11·7–31·6) |
Monocytes were isolated from peripheral blood mononuclear cells (PBMCs) using either plastic adhesion, negative, or CD14pos selection. Monocyte yield and viability were measured using NucleoCounter® NC‐250™. Monocyte purity was evaluated using flow cytometry. Monocytes were identified as CD11b/TLR2 positive events. Purity is given as percentage monocytes of total events (Purity (%) of all events) and as percentage monocytes of live CD45pos events (Purity (%) of CD45pos cells).
Data is presented as median with range.
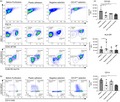
Figure 2.
Purity and phenotype of isolated monocytes. Monocytes were isolated from peripheral blood mononuclear cells (PBMCs) using either plastic adhesion, negative selection, or CD14pos selection. After isolation, monocyte purity and distribution of monocyte subpopulations were analyzed by flow cytometry. (a) Monocyte purity: The top panel shows forward scatter versus side scatter for the three isolation methods. The middle panel shows the percentages of platelets and CD45pos leukocytes for each isolation method. CD45neg events were, by anti‐CD42b staining, identified as primarily platelets (data not shown). The bottom panel shows gating of lymphocytes and monocytes (within the live cell/CD45pos gate). (b) Monocyte subpopulations: PBMCs were included in the analysis to display the native monocyte subpopulation distribution profile. Subpopulations were gated based on CD14 and CD16 expression. Classical monocytes were identified as CD14high CD16neg, intermediate monocytes as CD14high CD16pos, and non‐classical as CD14low CD16high. Gates were set based on the classical subpopulation of monocytes isolated with plastic adhesion. (c) Monocyte phenotype: The expression levels in single monocyte gate (see Supplementary material, Fig. S1) of CD163 PE, HLA‐DR FITC, and CD14 V450 were evaluated. Peripheral blood mononuclear cells were included to display the native monocyte expression profile. MFI, median fluorescence intensity. Bars and whiskers indicate median with interquartile range; n = 5. *P < 0·05, **P < 0·01, ***P < 0·001, ****P < 0·0001. Monocytes were identified as Toll‐like receptor 2 (TLR2) and CD11b positive events. Data are representative data of six experiments with PBMCs from different healthy donors.
Isolation methods markedly affect monocyte subpopulations
We evaluated the distribution of different monocyte subpopulations (classical, intermediate, and non‐classical) by flow cytometry (Fig. 2b, Table 2), in monocytes isolated with the different techniques as well as ‘untouched’ PBMCs as native control.
Table 2.
Monocyte subset distribution with plastic adhesion, negative selection, and CD14pos selection1
| Method | Classical (%) | Intermediate (%) | Non‐classical (%) |
|---|---|---|---|
| PBMCs | 74·1 (70·9–86·1) | 10·1 (4·9–10·9) | 8·9 (1·4–15·0) |
| Plastic adhesion | 57·9 (44·0–88·6) | 8·0 (1·3–14·6) | 18·5 (1·8–35·0) |
| Negative selection | 93·7 (92·3–98·6) | 0·05 (0·03–0·4) | 0·05 (0·01–0·6) |
| CD14pos selection | 90·9 (79·9–93·3) | 2·0 (0·3–2·7) | 3·7 (0·8–10·1) |
Monocytes were isolated from peripheral blood mononuclear cells (PBMCs) using either plastic adhesion, negative selection, or CD14pos selection. The distributions of monocyte subpopulations were analyzed by flow cytometry. Peripheral blood mononuclear cells were included to display the native monocyte subpopulation distribution profile. Cells were gated as described in Fig. 2.
Data is presented as median with range.
The native monocytes comprised 74% classical monocytes (CD14high CD16neg), 10% intermediate monocytes (CD14high CD16pos), and 9% non‐classical monocytes (CD14low CD16high) (median levels, Table 2). Negative selection resulted in a statistically significantly different distribution of monocyte subpopulations compared with PBMCs, with a higher percentage of classical monocytes (94%, P = 0·02), and virtually no intermediate and non‐classical monocytes (0·05% for both) (P = 0·003 and P = 0·04, respectively), which is a consequence of anti‐CD16 in the selection cocktail. CD14pos selection resulted in a lower percentage of intermediate monocytes compared with PBMCs (2% versus 10%, P = 0·01). No difference in classical and non‐classical subpopulations was observed.
Plastic adhesion resulted in a comparable distribution of monocyte subpopulations as PBMCs (all P > 0·99), but with large lymphocyte contamination as described above.
Surface marker expression on isolated monocytes differ between isolation methods
In addition to evaluating the distribution of the different monocyte subpopulations, the surface expression of HLA‐DR, CD14, and CD163 was evaluated by flow cytometry (Fig. 2c, see Supplementary material, Fig. S1 for gating strategy).
We found that purified monocytes, regardless of the isolation method, expressed lower amounts of the M2 macrophage marker CD163 compared with native monocytes. Plastic adhesion, negative and CD14pos selection monocytes expressed 50%, 70%, and 58% (median) of native monocyte CD163 expression, respectively (P < 0·003 for all). For HLA‐DR, only plastic adhesion monocytes displayed different expression levels compared with native monocytes (1·2 times higher, P < 0·0001), whereas both plastic adhesion and CD14pos selected monocytes displayed lower CD14 expression (51% and 50% of native monocytes expression level, respectively. P < 0·02).
Impact of isolation methods on resulting MDMs
Little is known about the effects of the different monocyte isolation methods on the differentiated MDMs. Here, we evaluated the methods based on MDM yield, viability, and purity as well as the resulting MDM phenotype.
Plastic adhesion results in low cell count, low viability, and low MDM purity
Yield of MDMs was evaluated based on both total number of cells after purification, and as a percentage of monocytes initially seeded (Table 3). Negative and CD14pos selection resulted in higher total cell yield compared with plastic adhesion (P < 0·0001), and negative selection as a percentage of seeded monocytes compared with plastic adhesion and CD14pos selection (P < 0·03, Table 3). Hence, a larger percentage of plastic adherent and CD14pos isolated cells were lost during maturation. Further, viability measurements showed that MDMs matured from plastic adhesion monocytes had lower viability than MDMs from both negative (P = 0·0002) and CD14pos (P = 0·0002) selected monocytes.
Table 3.
Monocyte‐derived macrophage (MDM) yield, viability, and purity of MDMs matured from monocytes isolated with plastic adhesion, negative selection, and CD14pos selection1
| Method | Total cell yield (x106 cells) | MDM yield (% of seeded monocytes) | Viability (%) | Purity (%) of total events | Purity (%) of CD45pos Cells |
|---|---|---|---|---|---|
| Plastic adhesion | 2·2 (1·6–8·0) | 43·0 (31·5–86·2) | 79·9 (70·8–89·7) | 39·0 (22·0–47·1) | 66·1 (37·6–76·2) |
| Negative selection | 14·0 (9·4–27·0) | 87·5 (76·2–99·9) | 93·7 (92·4–97·6) | 67·1 (47·7–84·1) | 94·5 (88·0–97·0) |
| CD14pos selection | 12·4 (8·8–18·0) | 63·5 (53·7–74·6) | 96·4 (85·5–97·1) | 72·8 (52·6–85·5) | 98·2 (96·4–98·7) |
Monocytes were isolated from PBMCs using either plastic adhesion, negative, or CD14pos selection, and matured to monocyte‐derived macrophages (MDM) with macrophage colony‐stimulating factor (M‐CSF) and granulocyte–macrophage colony‐stimulating factor (GM‐CSF) for 5 days. Monocyte‐derived macrophage yield and viability were measured using NucleoCounter® NC‐250™. In addition, MDM yield is given as percentage MDMs of total number of isolated monocytes (Yield (% of monocytes)). Monocyte‐derived macrophage purity was evaluated using flow cytometry. Monocyte‐derived macrophages were identified as CD11b/TLR2 positive events. Purity is given as percentage MDMs of total events (Purity (%) Total events) and as percentage MDMs of CD45pos events (Purity (%) CD45pos cells).
Data is presented as median with range.
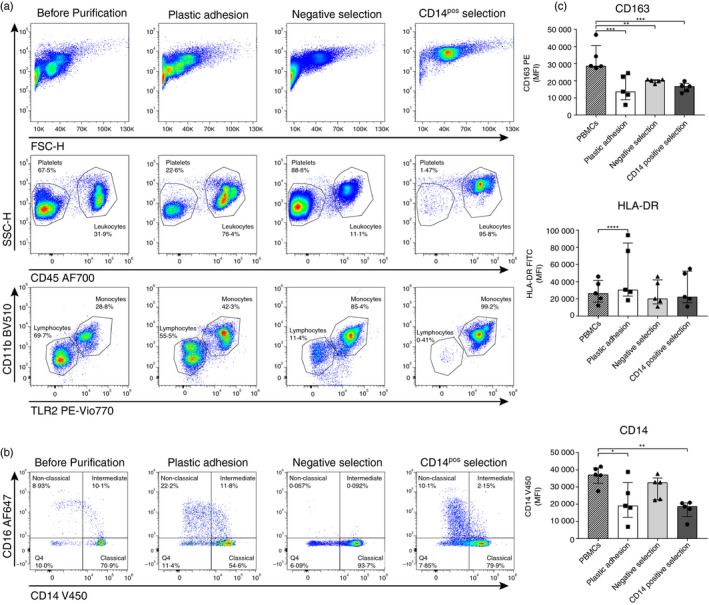
After maturation, MDM purity was evaluated using flow cytometry. We observed high contamination with CD45neg events in MDMs from plastic adhesion compared with negative (P = 0·0004) and CD14pos selection (P = 0·0002, Fig. 3, Table 3). Negative and CD14pos selection displayed low contamination with other leukocytes (94·5% and 98·2% MDMs of CD45pos cells, respectively), whereas cell populations from plastic adhesion had significantly higher contamination (66·1% MDMs of CD45pos cells). The contaminating cells in plastic adhesion MDMs consisted primarily of CD45pos lymphocytes (median 40·1% natural killer cells, 26·4% B cells, 18·6% T cells, 1·19% natural killer T cells. see Supplementary material, Fig. S4).
Figure 3.
Monocyte‐derived macrophage (MDM) purity. Monocytes were isolated using plastic adhesion, negative selection, or CD14pos selection and matured to MDMs by 5 days incubation with macrophage colony‐stimulating factor (M‐CSF) and granulocyte–macrophage colony‐stimulating factor (GM‐CSF). After maturation, MDM purity was evaluated using flow cytometry. The top panel shows forward scatter versus side scatter for the different isolation methods. The middle panel shows the percentage of CD45pos leukocytes of total events for each isolation method. The bottom panel shows the percentage of lymphocytes and MDMs (within the live cell/CD45pos gate). Monocyte‐derived macrophages were identified as Toll‐like receptor 2 (TLR2) and CD11b positive events. Data are representative data of six experiments with peripheral blood mononuclear cells from different healthy donors.
Different monocyte isolation methods affect the resultant MDM phenotype
To explore whether different monocyte purification methods influence the capability of resulting MDMs to polarize in response to external stimuli, MDMs were stimulated with either LPS + IFN‐γ, IL‐4 + IL‐13, or IL‐10 to generate M1‐, M2a‐ and M2c‐like cells, respectively.
After 24 hr stimulation, the resultant MDM phenotype was evaluated by gene expression (IL‐6, TNF‐α, CD163, and CD206, Fig. 4), surface protein expression of CD80, HLA‐DR, CD163, and CD206 (Fig. 5), as well as soluble proteins in the medium (IL‐6, TNF‐α, sCD163, and sCD206, Fig. 6).
Figure 4.
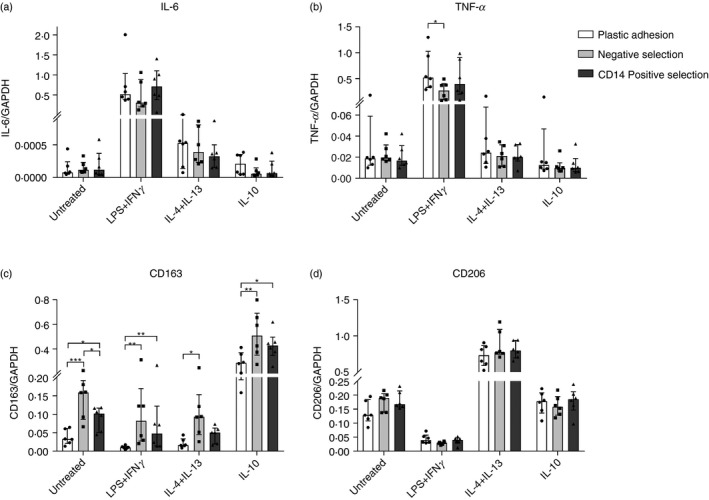
Gene expression profile of monocyte‐derived macrophages (MDMs). Monocytes were isolated with either plastic adhesion (white), negative selection (gray), or CD14pos selection (dark). After isolation, monocytes were matured to MDMs for 5 days with macrophage colony‐stimulating factor (M‐CSF) and granulocyte–macrophage colony‐stimulating factor (GM‐CSF). After maturation, MDMs were stimulated with media (UT), lipopolysaccharide (LPS) + interferon‐γ (IFN‐γ), interleukin‐4 (IL‐4) + IL‐13, or IL‐10 for 24 hr. Gene expression of (a) IL‐6, (b) tumor necrosis factor‐α (TNF‐α), (c) CD163, and (d) CD206 was measured using quantitative polymerase chain reaction. Target gene expression was normalized to household gene, GAPDH. Out of five tested household genes, GAPDH was found to be most stable. Bars and whiskers represent median with interquartile range; n = 6. *P < 0·05, **P < 0·01, ***P < 0·001.
Figure 5.
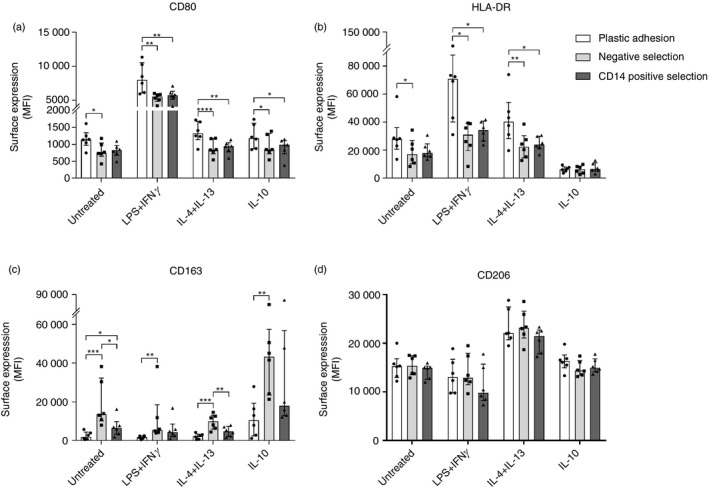
Monocyte‐derived macrophage (MDM) surface marker phenotype. Monocytes were isolated with either plastic adhesion (white), negative selection (gray), or CD14pos selection (dark). After isolation, monocytes were matured to MDMs for 5 days with macrophage colony‐stimulating factor (M‐CSF) and granulocyte–macrophage colony‐stimulating factor (GM‐CSF). After maturation, MDMs were stimulated with media (UT), lipopolysaccharide (LPS) + interferon‐γ (IFN‐γ), interleukin‐4 (IL‐4) + IL‐13, or IL‐10 for 24 hr. Surface expression of (a) CD80, (b) HLA‐DR, (c) CD163, and (d) CD206 was evaluated by flow cytometry. Monocyte‐derived macrophages were identified as live/CD45pos/side scatter high/single cells events (see Supplementary material, Fig. S3). MFI, median fluorescence intensity. Bars and whiskers represent median with interquartile range; n = 6. *P < 0·05, **P < 0·01, ***P < 0·001, ****P < 0·0001.
Figure 6.
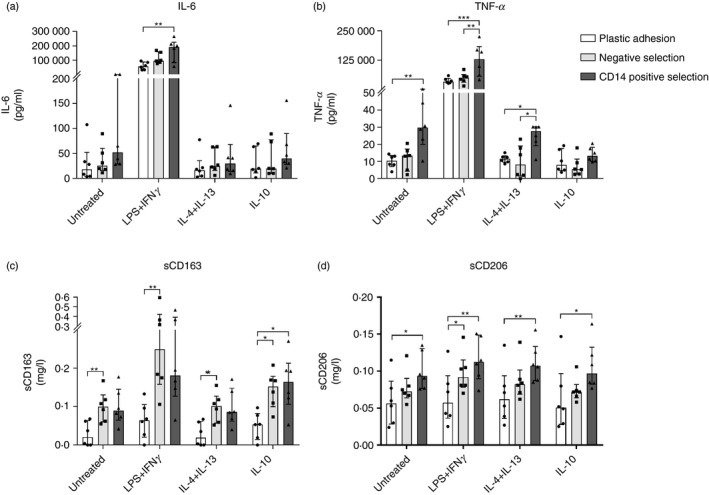
Soluble cytokine and protein production by monocyte‐derived macrophages (MDMs). Monocytes were isolated with either plastic adhesion (white), negative selection (gray), or CD14pos selection (dark). After isolation, monocytes were matured to MDMs for 5 days with macrophage colony‐stimulating factor (M‐CSF) and granulocyte–macrophage colony‐stimulating factor (GM‐CSF). After maturation, MDMs were stimulated with media (UT), lipopolysaccharide (LPS) + interferon‐γ (IFN‐γ), interleukin‐4 (IL‐4) + IL‐13, or IL‐10 for 24 hr. Release of (a) IL‐6, (b) tumor necrosis factor‐α (TNF‐α), (c) sCD163, and (d) sCD206 into the cell culture media was measured using ELISA. Bars and whiskers represent median with interquartile range; n = 6. *P < 0·05, **P < 0·01, ***P < 0·001.
Regardless of isolation method, LPS + IFN‐γ stimulation resulted in cells with an M1‐like pro‐inflammatory phenotype with increased IL‐6 and TNF‐α mRNA and protein expression and increased membrane expression of CD80 and HLA‐DR, as expected. Stimulation with IL‐4 + IL‐13 resulted in an M2a‐like phenotype with increased mRNA and membrane protein expression of CD206. Finally, IL‐10 stimulation resulted in cells with an M2c‐like phenotype with increased mRNA and membrane protein expression of CD163, as expected.
Hence, all three isolation methods yielded MDMs that responded appropriately to stimuli. However, the different isolation techniques showed significant differences in the degree of response for the individual MDM phenotype markers.
We observed no difference in IL‐6, TNF‐α, or CD206 gene expression between isolation methods, but CD14pos and negative selected MDMs had higher CD163 gene expression levels (range 1·4‐fold to 8·3‐fold higher) compared with plastic adhesion MDMs (P < 0·05 for all, Fig. 4). Negative selection, in general, also resulted in MDMs with higher CD163 membrane surface expression, compared with CD14pos selection and in particular plastic adhesion (between 2·0 and 7·0 times higher CD163 MFI, P < 0·01 for all, Fig. 5).
Plastic adhesion MDMs displayed higher surface expression of CD80 and HLA‐DR than negative and CD14pos selection MDMs (range 1·2‐fold to 1·6‐fold higher CD80 expression, and 1·6‐fold to 2·3‐fold higher HLA‐DR expression, P < 0·03 for all). No difference in CD206 membrane surface expression between isolation methods was observed (Fig. 5).
CD14pos selected MDMs had increased release of IL‐6 and TNF‐α (range 2·4‐fold to 3·9‐fold), especially after LPS + IFN‐γ stimulation (P < 0·03 for all), compared with negative selected and plastic adhesion MDMs. Furthermore, negative and CD14pos selected MDMs had significantly higher release of sCD163 and sCD206 (range 1·7‐fold to 5·3‐fold increase) compared with plastic adhesion MDMs (P < 0·04 for all). Negative selected MDMs generally had higher sCD163 release, whereas sCD206 release was higher in CD14pos selected MDMs (Fig. 6).
Discussion
In the present study, we have performed a comprehensive comparison of three widely used techniques for isolation of human monocytes from PBMCs. We show that the isolation techniques affect not only purity and cell yield of resulting monocytes and MDMs, but also have great impact on monocyte subtype and MDM polarization state.
No isolation technique is optimal for all scientific purposes and native unchanged monocytes cannot be obtained with any of the methods. For instance, all three methods resulted in lower monocyte expression of the M2 macrophage marker CD163, which may be due to TLR activation during processing, resulting in shedding of membrane‐bound CD163.25 Hence, it is important to know the specific effects of each isolation technique to select the method best suited for the experimental purpose and to control and understand the experimental conditions. Previous comparison studies have focused on monocytes and monocyte‐derived dendritic cells7, 8, 9, 10, 11, 12, 13, 14, 15, 16, 17, 18, 19, 20 (see Supplementary material, Table S1), but have not evaluated the effects of the resulting MDM phenotypes and polarizing potential.
Plastic adhesion isolation is simple and inexpensive, and monocytes obtained displayed a similar distribution of classical, intermediate, and non‐classical subpopulations as PBMCs. However, monocyte yield was significantly lower than for the immune‐based methods, and plastic adhesion monocytes displayed high contamination with lymphocytes. Furthermore, plastic adhesion may directly induce a pro‐inflammatory activation,26, 27 and we did observe a decreased monocyte CD14 expression along with increased HLA‐DR expression. In contrast, negative and CD14pos selection generally resulted in high monocyte yields without lymphocyte or granulocyte contamination, which is in agreement with previous studies.9, 12, 16 Negative selected monocytes, however, showed extensive platelet contamination in agreement with another study.9 More importantly, because of the specific removal of CD16pos cells by negative selection, the distribution of resultant monocyte subpopulations was very different from PBMCs, consisting almost exclusively of classical monocytes. As intermediate and non‐classical monocytes are believed to have specific functions in vivo,28 negative selection should not be employed when ex vivo studies require representative monocyte populations. On the other hand, CD14pos selection may carry the risk of altering the cells' phenotype and potentially induce cell activation.10, 11, 14, 16, 17, 18 Indeed, we observed CD14pos selection resulted in decreased monocyte expression of CD14, possibly due to internalization of the receptor after binding anti‐CD14 conjugated magnetic beads or shedding of the receptor.
Very little research has been conducted to evaluate how monocyte isolation techniques affect resulting MDMs and their polarization potential. Similarly, to plastic adhesion monocytes, unstimulated plastic adhesion‐derived MDMs also presented with a more pro‐inflammatory phenotype, with high surface expression of CD80 and HLA‐DR and low CD163 expression. CD14pos selection also resulted in unstimulated MDMs skewed towards a more pro‐inflammatory phenotype with higher release of IL‐6 and TNF‐α than negatively selected cells, which showed a stronger M2c polarization with higher CD163 mRNA and surface expression. Despite being cultured and matured for 5 days, unstimulated MDMs still displayed different phenotypes as a result of different monocyte isolation methods.
Along with the risk of pro‐inflammatory activation, as described for monocytes with plastic adhesion and CD14pos selection, the presence of platelets in negative selection may have driven MDM differentiation towards a more anti‐inflammatory profile. Although platelet contamination diminished during MDM maturation, monocytes cultured in the presence of platelets have been shown to differentiate into MDMs with high CD163 expression.29 Further, the presence of contaminating lymphocytes in plastic adhesion MDM may also hypothetically affect both maturation and polarization of the MDMs. The differences observed in monocyte subpopulations may also affect the resulting MDM phenotype. Although all monocyte subpopulations are able to differentiate to MDMs, their resulting MDM phenotype has been observed to differ.30
Despite the differences observed in unstimulated MDMs, all isolation methods produced functional MDMs able to polarize as expected in response to M1, M2a, and M2c stimulation.2, 3 However, we still observed important differences in MDM phenotypes in relation to the isolation methods applied. For instance, we observed a low release of TNF‐α, sCD163, and sCD206 in the soluble cytokine and protein profile in plastic adhesion MDMs. This may be the result of the high lymphocyte contamination and therefore lower MDM concentration. This emphasizes that thorough considerations regarding the potential impact of massive lymphocyte contaminations on study results are needed before plastic adhesion is used for monocyte purification.
In conclusion, we have compared three methods commonly used to isolate monocytes for in vitro studies and showed that choice of isolation technique can significantly affect the phenotype of both monocytes and derived MDMs. Even after 5 days of culture and maturation, MDMs still display a phenotype that is impacted by the isolation method. This highlights the importance of considering the monocyte isolation method to be used based on the subsequent experiments to be performed.
Disclosures
The authors declare no conflict of interest.
Author contributions
MCN, MNA, and HJM provided the conception and study design. MCN and MNA collected the data. MCN, MNA, and HJM analyzed and interpreted the data; critically revised the manuscript; and approved the version to be published.
Supporting information
Figure S1. Monocyte gating strategy.
Figure S2. Monocyte‐derived macrophage gating strategy for purity.
Figure S3. Monocyte‐derived macrophage gating strategy for membrane receptor expression.
Figure S4. Monocyte‐derived macrophage purity.
Table S1. List of previously published papers comparing monocyte isolation techniques.
Table S2. List of primers for quantitative PCR.
Acknowledgements
The authors wish to thank Helle Hauser Ryom, Christina Strande Sønderskov, and Lene Dabelstein for excellent technical assistance.
References
- 1. Wynn TA, Chawla A, Pollard JW. Macrophage biology in development, homeostasis and disease. Nature 2013; 496:445–55. [DOI] [PMC free article] [PubMed] [Google Scholar]
- 2. Mantovani A, Sica A, Sozzani S, Allavena P, Vecchi A, Locati M. The chemokine system in diverse forms of macrophage activation and polarization. Trends Immunol. 2004; 25:677–86. [DOI] [PubMed] [Google Scholar]
- 3. Vogel DY, Glim JE, Stavenuiter AW, Breur M, Heijnen P, Amor S et al Human macrophage polarization in vitro: maturation and activation methods compared. Immunobiology 2014; 219:695–703. [DOI] [PubMed] [Google Scholar]
- 4. Porcheray F, Viaud S, Rimaniol AC, Leone C, Samah B, Dereuddre‐Bosquet N et al Macrophage activation switching: an asset for the resolution of inflammation. Clin Exp Immunol 2005; 142:481–9. [DOI] [PMC free article] [PubMed] [Google Scholar]
- 5. Richards DM, Hettinger J, Feuerer M. Monocytes and macrophages in cancer: development and functions. Cancer Microenviron. 2013; 6:179–91. [DOI] [PMC free article] [PubMed] [Google Scholar]
- 6. Ziegler‐Heitbrock L, Ancuta P, Crowe S, Dalod M, Grau V, Hart DN et al Nomenclature of monocytes and dendritic cells in blood. Blood 2010; 116:e74–80. [DOI] [PubMed] [Google Scholar]
- 7. Elkord E, Williams PE, Kynaston H, Rowbottom AW. Human monocyte isolation methods influence cytokine production from in vitro generated dendritic cells. Immunology 2005; 114:204–12. [DOI] [PMC free article] [PubMed] [Google Scholar]
- 8. Lyons PA, Koukoulaki M, Hatton A, Doggett K, Woffendin HB, Chaudhry AN et al Microarray analysis of human leucocyte subsets: the advantages of positive selection and rapid purification. BMC Genom 2007; 8:64. [DOI] [PMC free article] [PubMed] [Google Scholar]
- 9. Zhou L, Somasundaram R, Nederhof RF, Dijkstra G, Faber KN, Peppelenbosch MP et al Impact of human granulocyte and monocyte isolation procedures on functional studies. Clin Vaccine Immunol. 2012; 19:1065–74. [DOI] [PMC free article] [PubMed] [Google Scholar]
- 10. Neu C, Sedlag A, Bayer C, Forster S, Crauwels P, Niess JH et al CD14‐dependent monocyte isolation enhances phagocytosis of Listeria monocytogenes by proinflammatory. GM‐CSF‐derived macrophages. PLoS One. 2013; 8:e66898. [DOI] [PMC free article] [PubMed] [Google Scholar]
- 11. Delirezh N, Shojaeefar E, Parvin P, Asadi B. Comparison the effects of two monocyte isolation methods, plastic adherence and magnetic activated cell sorting methods, on phagocytic activity of generated dendritic cells. Cell J. 2013; 15:218–23. [PMC free article] [PubMed] [Google Scholar]
- 12. Beliakova‐Bethell N, Massanella M, White C, Lada SM, Du P, Vaida F et al The effect of cell subset isolation method on gene expression in leukocytes. Cytometry A. 2014; 85:94–104. [DOI] [PMC free article] [PubMed] [Google Scholar]
- 13. El‐Sahrigy SA, Mohamed NA, Talkhan HA, Rahman AM. Comparison between magnetic activated cell sorted monocytes and monocyte adherence techniques for in vitro generation of immature dendritic cells: an Egyptian trial. Cent Eur J Immunol. 2015; 40:18–24. [DOI] [PMC free article] [PubMed] [Google Scholar]
- 14. Fol M, Nitecka‐Blazlak A, Szpakowski P, Madiraju M, Rudnicka W, Druszczynska M et al Evaluation of two different dendritic cell preparations with BCG reactivity. Arch Biol Sci. 2016; 68:9. [Google Scholar]
- 15. Felzmann T, Witt V, Wimmer D, Ressmann G, Wagner D, Paul P et al Monocyte enrichment from leukapharesis products for the generation of DCs by plastic adherence, or by positive or negative selection. Cytotherapy. 2003; 5:391–8. [DOI] [PubMed] [Google Scholar]
- 16. Kowalewicz‐Kulbat M, Ograczyk E, Wlodarczyk M, Krawczyk K, Fol M. Efficiency and impact of positive and negative magnetic separation on monocyte derived dendritic cell generation. Iran J Immunol. 2016; 13:132–40. [DOI] [PubMed] [Google Scholar]
- 17. Delirezh N, Shojaeefar E. Phenotypic and functional comparison between flask adherent and magnetic activated cell sorted monocytes derived dendritic cells. Iran J Immunol. 2012; 9:98–108. [DOI] [PubMed] [Google Scholar]
- 18. Kowalewicz‐Kulbat M, Ograczyk E, Krawczyk K, Rudnicka W, Fol M. Type of monocyte immunomagnetic separation affects the morphology of monocyte‐derived dendritic cells, as investigated by scanning electron microscopy. J Immunol Methods. 2016; 439:79–82. [DOI] [PubMed] [Google Scholar]
- 19. Kho DT, Johnson R, Robilliard L, du Mez E, McIntosh J, O'Carroll SJ et al ECIS technology reveals that monocytes isolated by CD14+ve selection mediate greater loss of BBB integrity than untouched monocytes, which occurs to a greater extent with IL‐1β activated endothelium in comparison to TNFα . PLoS One 2017; 12:e0180267. [DOI] [PMC free article] [PubMed] [Google Scholar]
- 20. Bhattacharjee J, Das B, Mishra A, Sahay P, Upadhyay P. Monocytes isolated by positive and negative magnetic sorting techniques show different molecular characteristics and immunophenotypic behaviour. F1000Res. 2017; 6:2045. [DOI] [PMC free article] [PubMed] [Google Scholar]
- 21. Andersen MN, Al‐Karradi SN, Kragstrup TW, Hokland M. Elimination of erroneous results in flow cytometry caused by antibody binding to Fc receptors on human monocytes and macrophages. Cytometry A. 2016; 89:1001–9. [DOI] [PubMed] [Google Scholar]
- 22. Shirk EN, Kral BG, Gama L. Toll‐like receptor 2bright cells identify circulating monocytes in human and non‐human primates. Cytometry A. 2017; 91:364–71. [DOI] [PMC free article] [PubMed] [Google Scholar]
- 23. Moller HJ, Hald K, Moestrup SK. Characterization of an enzyme‐linked immunosorbent assay for soluble CD163. Scand J Clin Lab Invest 2002; 62:293–9. [DOI] [PubMed] [Google Scholar]
- 24. Rodgaard‐Hansen S, Rafique A, Christensen PA, Maniecki MB, Sandahl TD, Nexo E et al A soluble form of the macrophage‐related mannose receptor (MR/CD206) is present in human serum and elevated in critical illness. Clin Chem Lab Med. 2014; 52:453–61. [DOI] [PubMed] [Google Scholar]
- 25. Etzerodt A, Maniecki MB, Moller K, Moller HJ, Moestrup SK. Tumor necrosis factor α‐converting enzyme (TACE/ADAM17) mediates ectodomain shedding of the scavenger receptor CD163. J Leukoc Biol. 2010; 88:1201–5. [DOI] [PubMed] [Google Scholar]
- 26. Rostam HM, Singh S, Salazar F, Magennis P, Hook A, Singh T et al The impact of surface chemistry modification on macrophage polarisation. Immunobiology 2016; 221:1237–46. [DOI] [PubMed] [Google Scholar]
- 27. Coccia EM, Del Russo N, Stellacci E, Testa U, Marziali G, Battistini A. STAT1 activation during monocyte to macrophage maturation: role of adhesion molecules. Int Immunol. 1999; 11:1075–83. [DOI] [PubMed] [Google Scholar]
- 28. Devevre EF, Renovato‐Martins M, Clement K, Sautes‐Fridman C, Cremer I, Poitou C. Profiling of the three circulating monocyte subpopulations in human obesity. J Immunol. 2015; 194:3917–23. [DOI] [PubMed] [Google Scholar]
- 29. Chatterjee M, von Ungern‐Sternberg SN, Seizer P, Schlegel F, Buttcher M, Sindhu NA et al Platelet‐derived CXCL12 regulates monocyte function, survival, differentiation into macrophages and foam cells through differential involvement of CXCR4‐CXCR7. Cell Death Dis. 2015; 6:e1989. [DOI] [PMC free article] [PubMed] [Google Scholar]
- 30. Boyette LB, Macedo C, Hadi K, Elinoff BD, Walters JT, Ramaswami B et al Phenotype, function, and differentiation potential of human monocyte subsets. PLoS One 2017; 12:e0176460. [DOI] [PMC free article] [PubMed] [Google Scholar]
Associated Data
This section collects any data citations, data availability statements, or supplementary materials included in this article.
Supplementary Materials
Figure S1. Monocyte gating strategy.
Figure S2. Monocyte‐derived macrophage gating strategy for purity.
Figure S3. Monocyte‐derived macrophage gating strategy for membrane receptor expression.
Figure S4. Monocyte‐derived macrophage purity.
Table S1. List of previously published papers comparing monocyte isolation techniques.
Table S2. List of primers for quantitative PCR.