Abstract
We examined the time-resolved and steady-state fluorescence quenching of N-acetyl-l-tryptophanamide (NATA) by acrylamide and iodide, over a range of viscosities in propylene glycol. The quenching of NATA by acrylamide and iodide results in heterogeneity of the intensity decay which increases with the quencher concentration. We attribute the complex decays of NATA to transient effects in diffusion and the nature of the fluorophore–quencher interaction. These data were compared using the phenomenological radiation boundary condition (RBC) and distance-dependent quenching (DDQ) models for collisional quenching. We used global analysis of the time-resolved frequency-domain and steady-state data to select between the models. Consideration of both the frequency-domain and steady state data demonstrate that the quenching rate depends exponentially on the fluorophore–quencher distance, indicating the validity of the DDQ model. The rate constants for acrylamide and iodide quenching, at the constant distance of 5 Å, were found to be near 1013 s−1 and 109 s−1, respectively. These rates reflect electron transfer and exchange interactions as the probable quenching mechanisms, respectively.
Keywords: Fluorophore, Quencher, Phosphorescence
1. Introduction
Steady-state and time-resolved fluorescence spectroscopy are extensively used in physical chemistry and biochemistry [1]. Because the emission spectra are typically broad additional information is found from the time-resolved decay of the excited state, which determines the time available for dynamic processes to affect the emission spectral parameters [2]. Quenching of fluorescence often decreases the mean lifetime of the excited state and alters the time available for rotational diffusion and spectral relaxation. By performing lifetime-resolved or quenching-resolved measurements, one can determine the timescale of these phenomena [3,4]. Additionally, collisional or dynamic quenching of fluorescence has been widely utilized to study the structure and dynamics of biological macromolecules [4–9]. Collisional quenching is thought to require contact between the fluorophores and quenchers during the lifetime of the excited state. Studies of quenching can yield information about diffusive motions in solution, the accessibility of intrinsic and extrinsic fluorophores in macromolecules to externally added polar [7,8] and non-polar quenchers [9] and the rates of diffusion of the quenchers within proteins [5,9–12] membranes [13,14] and lipid bilayers [15–17].
In the presence of quenching, the decays of fluorescence intensity become more complex than a single exponential due to transient effects [18–21] which occur immediately following excitation of the fluorophore. The origin of the transient effects in collisional quenching of fluorescence is the rapid decay of closely spaced fluorophore–quencher pairs, followed by slower diffusion-limited quenching of the remaining fluorophores. These effects can be readily detected by using frequency-domain fluorometry [20–23]. An important feature of the present report is the ability to independently recover diffusion coefficients, interaction radii and the form of the distance-dependent interaction between the tryptophan as the fluorophore and acrylamide or iodide as the quencher.
We used two phenomenological models for collisional quenching of fluorescence, the radiation boundary condition (RBC) [18,24] and the distance-dependent quenching (DDQ) [25–28] to analyze the experimental data. The DDQ model was used to determine the rate of quenching at a fixed distance. These rates were interpreted in terms of the likely mechanisms of electron transfer and exchange interactions for acrylamide and iodide, respectively.
Considering the fact that structure of N-acetyl-l-tryptophanamide (NATA) is representative of tryptophan residues in proteins, and that the internal viscosity of proteins is highly variable, we performed detailed studies of the time-dependent intensity decays and steady state intensities of NATA in propylene glycol over a range of viscosities when collisionally quenched by acrylamide and iodide. The data from such solutions provide the basis for interpreting similar quenching data for tryptophan residues in proteins.
2. Materials and methods
NATA was from Aldrich and acrylamide (> 99.9%) electrophoresis purity reagent (lot 32285) was from Bio-Rad. Potassium iodide was from Sigma and 1,2-propanediol (propylene glycol) (P.A. grade) was from Janssen Chimica. The concentrations of NATA in the samples were ≈5×10⁻⁴ M, and were precisely the same in all samples. The concentration of acrylamide ranged from 0 to 1.5 M and the concentration of iodide from 0 to 0.9 M at 20°C. At 0°C, −20°C, −40°C and −60°C, the concentrations of acrylamide and iodide were calculated based on the measured decreases in the volumes of the solutions, which were 1%, 2.3%, 3.5% and 4.6% compared to the volume of the solution at 20°C, respectively. The solutions were not purged to remove dissolved oxygen. To minimize inner filter effects due to absorption of the excitation beam the emission spectra of NATA were measured using 1 cm×0.4 cm cells with the excitation beam perpendicular to the short axis. The excitation wavelength was 296 nm. Steady-state intensity emission of NATA in propylene glycol was corrected for the absorption of acrylamide at the excitation wavelength. A correction factor, −log , was applied [29]. For iodide quenching of NATA the samples contained KCl and/or KI for total concentration of 0.5 M. These samples also contained 10−3M Na2S2O3 to prevent the formation of iodine.
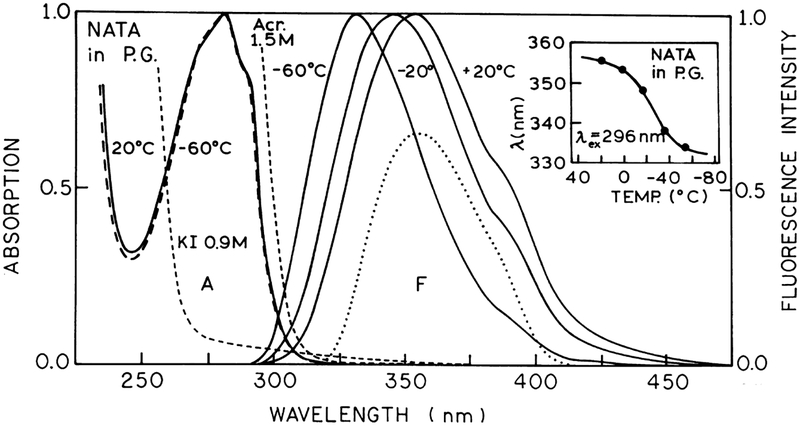
Steady-state fluorescence measurements were carried out with an SLM 8000 photon-counting spectrofluorometer equipped with a thermostated cell holder. The emission was detected by using a R928 (Hamamatsu) photomultiplier tube. For varying temperatures we used ULT-80 (Neslab) circulating bath. Absorption spectra were measured on a Perkin-Elmer Lambda 6, UV/VIS spectrophotometer. Phase and modulation fluorescence measurements were performed using the GHz frequency-domain fluorometer described previously in detail [30,31]. The excitation wavelength was 296 nm from a frequency-doubled R6G dye laser, Coherent, Inc. The modulation excitation was provided by the harmonic content of a laser pulse train with a repetition rate of 3.795 MHz and a pulse width of approx. 7 ps. The dye laser was pumped with a mode-locked Argon ion laser (Coherent, Innova 15). The emitted light was detected by using a microchannel plate PMT (Hamamatsu R1564U) with external cross-correlation. All intensity decays were measured by using rotation-free polarization conditions (magic angle polarizer orientation) in order to avoid the effects of Brownian rotation. The fluorophore emission was selected by combination of Schott WG 335 and Corning 7–51 filters which transmitted the emission from 325 to 400 nm (Fig. 1, ⋯). At each modulation frequency we measure the phase and modulation of the sample relative to the lifetime reference which was 2,5-diphenyl-1,3,4-oxadiazole (PPD) in ethanol (τ =1.25 ns at 20°C and 0°C, τ =1.26 ns at −20°C and −40°C, and τ =1.27 ns at −60°C) [31]. The background fluorescence and/or scattered light of acrylamide or iodide in propylene glycol contribute less than 0.5% to the measured emission. The frequency-domain data were collected using a dedicated Minc ll/23 computer, and then transferred to a Silicon Graphics IRIS CS/12 computer for analysis. For all analyses, the uncertainties (δϕ and δm) were taken as 0.2° in the phase angle and 0.005 in the modulation ratio, respectively.
Fig. 1.
Absorption and fluorescence spectra of NATA in propylene glycol at different temperatures. The dotted line shows the emission spectrum of NATA observed through the combination of Schott WG-335 and Corning 7–51 filters used to select the emission for intensity decay measurements. Insert: Dependence of the fluorescence emission maximum of NATA in propylene glycol (●) on temperature with excitation wavelength at 296 nm.
3. Theory
Fluorescence quenching of NATA was investigated using the global analysis of the frequency-domain and steady state experimental data. The corresponding theoretical values of the frequency-domain observables, phase shift and modulation, are calculated based on the predicted values of the fluorophore intensity decay I(t). The steady state observable is the relative quantum yield of the fluorophore. The theoretical values of the quantum yield are calculated as integrals of the decay I(t) over time. Because of the significant inhomogeneity of the fluorescence intensity decay of NATA in the absence of quencher the function I(t) is represented in terms of the multi-component model:
| (1) |
where I0 is the intensity at t=0, αi are the initial amplitudes of the intensity decays associated with the individual decay times τi, is the bulk concentration of the quencher, and kav(t) denotes the averaged time-dependent fluorophore–quencher reaction rate. It is assumed that the rate kav(t) is the same for each intensity decay component. The amplitudes αi are normalized so that Σαi=1.
In the absence of quenching, when or kav(t) = 0 for all t, Eq. (1) simplifies to:
| (2) |
Eq. (2) is used to recover the lifetimes τi and the amplitudes αi from the unquenched fluorescence decay. The fractional contribution of each decay time component to the steady-state intensity is expressed as:
| (3) |
and the mean decay time is given by:
| (4) |
In Eq. (1) the rate kav(t) is expressed as:
| (5) |
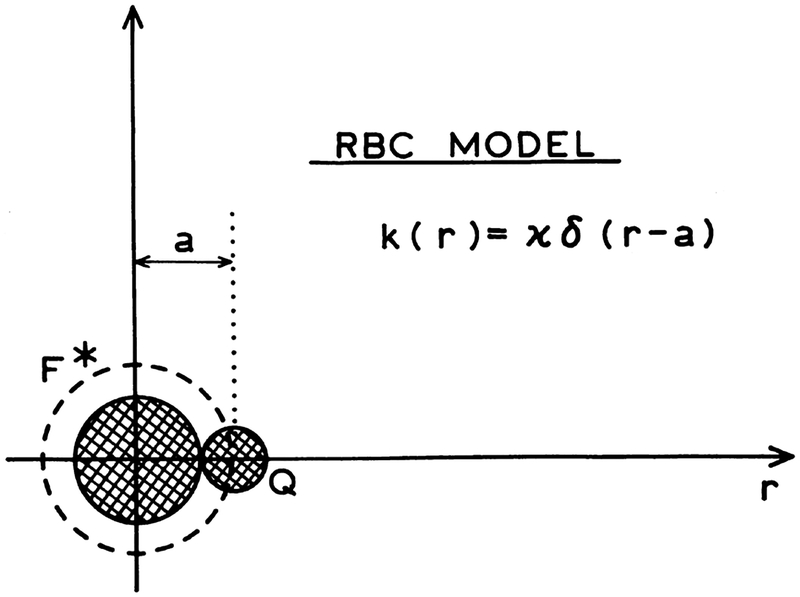
where Cq(r,t) is the concentration of the quencher molecules at the distance r from the excited fluorophore at time instant t, and k(r) denotes the bimolecular quenching rate. In general, k(r) is dependent on the fluorophore–quencher distance. In this paper, the two models, associated with two different expressions for the quenching rate k(r), are considered. In the case of the radiation boundary condition (RBC) model (Scheme 1) the rate k(r) can be expressed as:
| (6) |
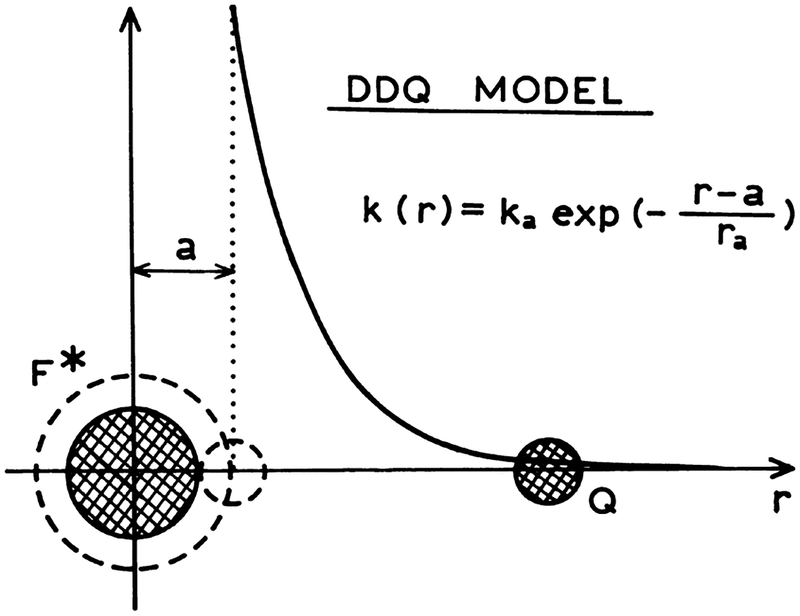
where κ is the specific rate constant for quenching and a is the fluorophore–quencher distance of the closest approach. In this model quenching is assumed only to occur at the distance (a) of closest approach. This RBC model is an extension of the classic Smoluchowski model in which the rate of quenching is assumed to be infinite at the contact distance. In the case of the distance-dependent quenching (DDQ) model (Scheme 2) the rate k(r) is given by:
| (7) |
where ka denotes the value of the rate k(r) at a distace r equal to the distance of the fluorophore–quencher closest approach (r=a), and re describes the distance dependence of the rate.
Scheme 1.
RBC model for collisional quenching of fluorescence.
Scheme 2.
DDQ model for collisional quenching of fluorescence.
In fluid solution, the effective concentration Cq(r,t) of the quencher molecules around the excited fluorophores is affected by diffusion and the processes of quenching. The bulk quencher concentration is of course independent of time. The effective concentration of quenchers around the excited state depends on time and distance because quenching depopulates the more closely spaced pairs of quenchers and excited fluorophore. In order to simplify calculations, one introduces the function . In the presence of diffusion the function y(r,t) is governed by the diffusion equation. The equation has an additional sink term which is responsible for the through-space fluorescence quenching:
| (8) |
where D=DF+DQ is the mutual diffusion coefficient of the fluorophore and the quencher with diffusion coefficients DF and DQ, respectively. For the RBC model the through-space fluorescence quenching does not take place, and then the additional sink term k(r) y(r,t) in Eq. (8) disappears. For both quenching models the initial and outer boundary conditions of Eq. (8) remain the same:
| (9) |
| (10) |
The form of the inner boundary condition (at r=a) depends on the particular model. For the RBC model one assumes that:
| (11) |
whereas for DDQ model the ‘reflecting’ or ‘specular’ boundary condition at r=a is used:
| (12) |
The condition (12) indicates that within the DDQ model the diffusive molecular flux at the donor–quencher boundary vanishes, and that the fluorophore is quenched exclusively by the through-space quenching processes described by the rate (Eq. (7))
For the RBC model the diffusion Eq. (8) can be solved analytically yielding [32]:
| (13) |
where k0 = 4πa2κ and α = (4π Da + k0)/(4πDa2) One can see from Eqs. (1) and (13) that to be able to compare the experimental and theoretical data within this model, one has to know the values of the following parameters: lifetimes τi and their amplitudes αi; the fluorophore–quencher encounter distance a; the specific quenching constant κ; and the diffusion coefficient D. In our analyses, τi and αi were found from the least squares analysis of the frequency-domain fluorescence decay registered in the absence of quenching, the parameter a was estimated from the sizes of the interacting molecules, and κ and D were evaluated based on the best fit of the experimental and theoretical data in the presence of quenching.
For the DDQ model an exact analytical solution of the Eq. (8) is not known, and numerical methods are required. In this paper we used an algorithm described previously [33,34] based on the numerical solution of Eq. (8) in Laplace space [35] and numerical integration of Eq. (5) Within the DDQ model, the parameters needed to calculate the predicted frequency-domain data are: the lifetimes τi and their amplitudes αi; the fluorophore–quencher encounter distance a; the value of the bimolecular quenching rate at the encounter distance ka; the characteristic quenching distance re; and the diffusion coefficient D. As for RBC analyses, τi and αi were found from experiments in the absence of quenching, and the parameter a was estimated from the sizes of the interacting molecules. The remaining three parameters, ka, re and D, were evaluated based on the best fit of the experimental and theoretical data in the presence of quenching.
To avoid confusion, we note an error which appeared in Ref. [34]. In Eq. (19), p. 224, of this paper, there should be a minus (not plus) before ω sin (ωtk) and ω sin (ω tk+1).
Using the technique of frequency-domain fluorometry [30,31], one compares the experimental phase (ϕω) and modulation (mω) values with those calculated (c) from the model intensity decay I(t). At given modulation frequency (ω) these values are given by:
| (14) |
| (15) |
where
| (16) |
| (17) |
| (18) |
The steady state data are represented by the Stern–Volumer-type quantity f defined as:
| (19) |
where the ratio F/F0 expresses the relative quantum yield of the fluorophore, with F0 and F being the fluorophore quantum yields in the absence and presence of quencher. In order to find the experimental value fk of the quantity f for the kth concentration of the quencher, the ratio F0/F was replaced by the respective ratio of photocurrents registered for the unquenched and quenched sample. To find the calculated value fck of the quantity f, the ratio F0/F was calculated from the expression:
| (20) |
where I(t) is given by Eq. (1) for either the RBC or DDQ models and I0(t) is the fluorophore’s intensity decay in the absence of quencher given by Eq. (2).
Our previous studies [25–27,36] and preliminary analysis of the data discussed in this paper, showed that the models (RBC or DDQ) and DDQ parameter values (ka, re and D) were better resolved by insuring that both the calculated intensity decay and the calculated steady state intensities were consistent with the experimental values. This is a consequence of the fact that resolution of correlated parameters can be improved by global analyses [37]. For analysis of the data presented in this paper we developed a program which simultaneously fits the frequency domain and steady state intensities by non-linear least squares [38,39]. In the program, the best fitted parameters and goodness-of-fit are determined by the minimum value of:
| (21) |
where v is the number of degrees of freedom and δϕ, δ m, and δf are the experimental uncertainties. For all analyses, the uncertainties δϕ and δm were taken as 0.2° in the phase angle and 0.005 in the modulation ratio, respectively. The uncertainties δfk were calculated from the relation δfk=(F0/Fk)2 × (δ F/F0). We assume uncertainties of δ F/F0 = 0.005 and 0.0005 for acrylamide and iodide quenching, respectively.
4. Results and discussion
4.1. Solvent viscosity effect on the emission spectra of tryptophan
Absorption spectra and emission spectra of NATA in propylene glycol for excitation at 296 nm over a range of temperatures are presented in Fig. 1. The absorption band of NATA at 20°C with the maximum at 282 nm remains at the same position even at −60°C. However, the maximum of the emission band of NATA which appears near 355 nm at 20°C progressively shifts to higher energy with decreasing temperature shifting to near 334 nm at −60°C. The observed blue shift of the emission (see Fig. 1, insert) is due to the solvent viscosity effect. This effect is explained by the inability of the solvent molecules at low temperature to reorient during the lifetime of the excited state of the fluorophore molecule [2].
4.2. Transient effect in fluorescence quenching of tryptophan
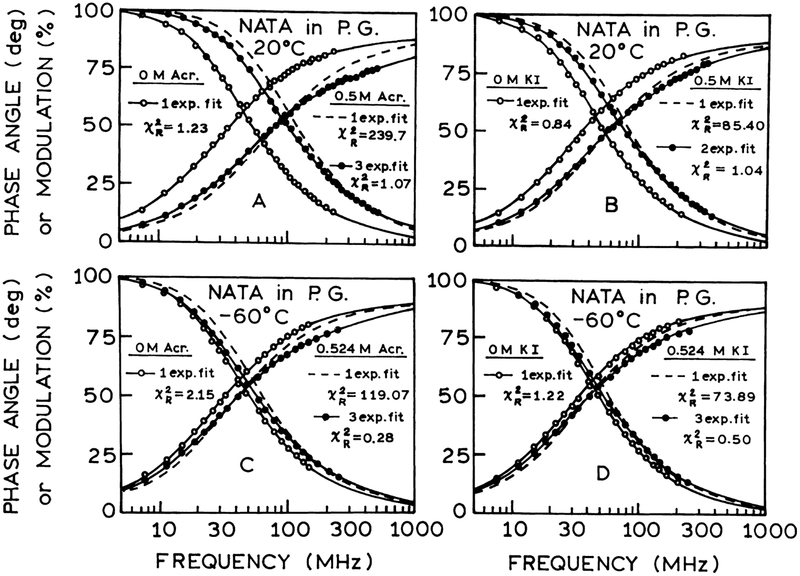
Frequency-domain intensity decays of NATA in propylene glycol at 20°C and at −60°C in the absence and presence of acrylamide or iodide are shown in Fig. 2. It can be seen that at 20°C, and in vitrified propylene glycol at −60°C, the data of fluorescence intensity decays of NATA in the absence of quenching (○) can be satisfactorily fit to a single exponential, as can be seen from the values of near unity. However, quenching by acrylamide or iodide results in the shifting of the frequency response to higher frequencies and the mono-exponential model does not account for the experimental data (dashed lines). This can be judged by values which are 239.72 and 85.40 at 20°C and 119.07 and 73.89 at −60°C for 0.5 M acrylamide and 0.5 M iodide, respectively. A three-exponential fit was needed to fit the NATA decays in the presence of acrylamide and two- or three-exponential components are needed also for the less efficient quencher, iodide. The results of quenching, presented in Fig. 2, indicate that the intensity decays of NATA become heterogeneous in the presence of acrylamide or iodide.
Fig. 2.
Frequency response of the NATA intensity decay in propylene glycol at 20°C and at −60°C. (A and C. The open circles (○) and solid lines represent the data and best single exponential fits in the absence of acrylamide, respectively. The closed circles (●) and solid lines represent the data and best three-exponential fit with 0.5 M acrylamide, respectively. The dashed lines show the best single exponential fits to fit data. (B) Similar to (A); (D) similar to (C), but for 0 and 0.5 M iodide. The closed circles (●) and solid lines represent the data and best two- and three-exponential fits with 0.5 M iodide.
Importantly, acrylamide and iodide quenching of NATA was observed even in the absence of diffusion at −60°C (Fig. 2, lower panels). This result suggests that quenching can occur by a through-space interaction which does not require diffusion for quenching to occur.
Multiexponential analysis of the frequency-domain intensity decays of NATA in propylene glycol in the absence and presence of acrylamide and iodide at different temperatures are presented in Tables 1 and 2. It can be seen from the tables that quenching of NATA by acrylamide or iodide results in heterogeneity of the intensity decays which progressively increase with the quencher concentration. More complex decays of NATA emission intensity are observed at −20°C and at −40°C. Three-exponential decays with negative amplitudes of the lifetime components were observed for NATA in propylene glycol even in the absence of quencher.
Table 1.
Acrylamide quenching of NATA in propylene glycol — multi-exponential analysis of NATA fluorescence intensity decays at different temperatures
| Temp (°C) | [Acrylamide] | τi (ns) | αi | fi | χR2 | |||
|---|---|---|---|---|---|---|---|---|
| 1 exp. | 2 exp. | 3 exp. | ||||||
| 20 | 0 | 5.277 | 5.277 | 1.0 | 1.0 | 1.23 | – | – |
| 0.5 | 3.138 | 0.553 | 0.833 | |||||
| 1.261 | 0.227 | 0.137 | ||||||
| 0.281 | 2.795 | 0.220 | 0.030 | 239.72 | 2.96 | 1.07 | ||
| 1.0 | 2.358 | 0.238 | 0.529 | |||||
| 1.213 | 0.360 | 0.410 | ||||||
| 0.162 | 1.755 | 0.402 | 0.061 | 466.04 | 6.21 | 0.76 | ||
| 1.5 | 1.506 | 0.258 | 0.685 | |||||
| 0.561 | 0.230 | 0.228 | ||||||
| 0.096 | 1.168 | 0.512 | 0.087 | 909.45 | 8.69 | 1.38 | ||
| 0 | 0 | 6.356 | 0.950 | 0.992 | ||||
| 0.936 | 6.313 | 0.050 | 0.008 | 6.71 | 0.52 | – | ||
| 0.505 | 5.407 | 0.460 | 0.715 | |||||
| 2.731 | 0.288 | 0.242 | ||||||
| 0.549 | 4.293 | 0.252 | 0.043 | 245.74 | 2.33 | 0.90 | ||
| 1.010 | 3.891 | 0.315 | 0.651 | |||||
| 1.820 | 0.296 | 0.286 | ||||||
| 0.304 | 3.073 | 0.389 | 0.063 | 641.86 | 5.99 | 1.02 | ||
| 1.515 | 2.851 | 0.247 | 0.701 | |||||
| 0.964 | 0.244 | 0.234 | ||||||
| 0.128 | 2.232 | 0.509 | 0.065 | 1132.66 | 13.92 | 0.83 | ||
| −20 | 0 | 8.519 | 0.317 | 0.534 | ||||
| 4.953 | 0.464 | 0.454 | ||||||
| 0.277 | 6.794 | −0.219 | −0.012 | 23.65 | 7.91 | 0.45 | ||
| 0.512 | 6.596 | 0.579 | 0.769 | |||||
| 2.721 | 5.701 | 0.421 | 0.231 | 65.91 | 0.74 | – | ||
| 1.023 | 7.650 | 0.154 | 0.321 | |||||
| 4.109 | 0.509 | 0.569 | ||||||
| 1.204 | 4.962 | 0.337 | 0.110 | 247.87 | 2.23 | 0.89 | ||
| 1.535 | 6.318 | 0.195 | 0.465 | |||||
| 2.853 | 0.393 | 0.423 | ||||||
| 0.717 | 4.225 | 0.412 | 0.112 | 587.20 | 6.68 | 1.38 | ||
| −40 | 0 | 8.452 | 0.200 | 0.578 | ||||
| 4.523 | 0.548 | 0.394 | ||||||
| 0.477 | 5.931 | −0.252 | −0.028 | 62.89 | 10.60 | 1.07 | ||
| 0.518 | 6.759 | 0.343 | 0.613 | |||||
| 3.269 | 0.437 | 0.378 | ||||||
| 0.159 | 5.378 | −0.220 | −0.009 | 22.66 | 7.32 | 1.37 | ||
| 1.036 | 6.094 | 0.426 | 0.649 | |||||
| 2.439 | 4.811 | 0.574 | 0.351 | 104.75 | 1.92 | – | ||
| 1.554 | 5.959 | 0.291 | 0.573 | |||||
| 2.339 | 0.520 | 0.402 | ||||||
| 0.402 | 4.365 | 0.189 | 0.025 | 272.67 | 7.53 | 1.24 | ||
| −60 | 0 | 12.432 | 0.020 | 0.045 | ||||
| 5.387 | 5.704 | 0.980 | 0.955 | 2.15 | 1.22 | – | ||
| 0.524 | 6.193 | 0.385 | 0.591 | |||||
| 3.444 | 0.445 | 0.381 | ||||||
| 0.675 | 4.991 | 0.170 | 0.028 | 119.07 | 2.20 | 0.28 | ||
| 1.048 | 6.075 | 0.296 | 0.582 | |||||
| 2.839 | 0.395 | 0.362 | ||||||
| 0.563 | 4.595 | 0.309 | 0.056 | 412.20 | 6.55 | 0.67 | ||
| 1.572 | 5.761 | 0.227 | 0.544 | |||||
| 2.431 | 0.373 | 0.377 | ||||||
| 0.471 | 4.088 | 0.400 | 0.079 | 725.81 | 11.01 | 0.82 |
Table 2.
Iodide quenching of NATA in propylene glycol — multi-exponential analysis of NATA fluorescence intensity decays at different temperatures
| Temperature (°C) | [Iodide] | τi (ns) (ns) | αi | fi | χR2 | |||
|---|---|---|---|---|---|---|---|---|
| 1 exp. | 2 exp. | 3 exp. | ||||||
| 20 | 0 | 5.364 | 5.364 | 1.0 | 1.0 | 0.84 | — | — |
| 0.2 | 4.877 | 0.792 | 0.895 | |||||
| 2.162 | 4.592 | 0.208 | 0.105 | 15.92 | 0.92 | — | ||
| 0.5 | 3.932 | 0.734 | 0.907 | |||||
| 1.116 | 3.670 | 0.266 | 0.093 | 85.40 | 1.04 | — | ||
| 0.7 | 3.455 | 0.678 | 0.855 | |||||
| 0.947 | 3.167 | 0.322 | 0.115 | 131.68 | 1.22 | — | ||
| 0.9 | 3.171 | 0.546 | 0.790 | |||||
| 1.375 | 0.250 | 0.157 | ||||||
| 0.574 | 2.751 | 0.204 | 0.053 | 186.79 | 1.47 | 1.15 | ||
| 0 | 0 | 6.963 | 0.677 | 0.759 | ||||
| 4.625 | 6.400 | 0.323 | 0.241 | 3.57 | 0.95 | — | ||
| 0.202 | 6.246 | 0.771 | 0.893 | |||||
| 2.521 | 5.847 | 0.229 | 0.107 | 26.49 | 0.82 | — | ||
| 0.505 | 5.644 | 0.669 | 0.859 | |||||
| 1.867 | 5.111 | 0.331 | 0.141 | 92.04 | 0.87 | — | ||
| 0.707 | 5.372 | 0.538 | 0.775 | |||||
| 2.719 | 0.177 | 0.129 | ||||||
| 1.258 | 4.634 | 0.245 | 0.096 | 172.86 | 1.23 | 1.16 | ||
| 0.909 | 5.410 | 0.342 | 0.577 | |||||
| 2.978 | 0.356 | 0.330 | ||||||
| 0.997 | 4.197 | 0.302 | 0.093 | 231.01 | 1.50 | 0.79 | ||
| −20 | 0 | 6.730 | 6.730 | 1.0 | 1.0 | 20.23 | — | — |
| 7.347 | 0.576 | 0.850 | ||||||
| 3.418 | 0.200 | 0.137 | ||||||
| 0.295 | 6.709 | −0.224 | −0.013 | 20.23 | — | 0.31 | ||
| 0.205 | 7.136 | 0.451 | 0.841 | |||||
| 2.783 | 0.202 | 0.147 | ||||||
| 0.135 | 6.408 | −0.347 | −0.012 | 23.46 | 17.15 | 1.09 | ||
| 0.512 | 7.060 | 0.408 | 0.770 | |||||
| 2.712 | 0.309 | 0.224 | ||||||
| 0.087 | 6.043 | −0.283 | −0.006 | 51.92 | 5.10 | 0.85 | ||
| 0.716 | 6.643 | 0.368 | 0.776 | |||||
| 2.354 | 0.294 | 0.220 | ||||||
| 0.035 | 5.673 | −0.338 | −0.004 | 93.31 | 1.72 | 0.90 | ||
| 0.921 | 6.388 | 0.331 | 0.764 | |||||
| 1.991 | 0.319 | 0.230 | ||||||
| 0.050 | 5.338 | −0.350 | −0.006 | 143.87 | 3.50 | 1.08 | ||
| −60 | 0 | 7.690 | 0.097 | 0.137 | ||||
| 5.200 | 5.541 | 0.903 | 0.863 | 1.22 | 0.66 | — | ||
| 0.210 | 5.518 | 0.849 | 0.941 | |||||
| 1.925 | 5.306 | 0.151 | 0.059 | 18.91 | 0.77 | — | ||
| 0.524 | 6.379 | 0.386 | 0.571 | |||||
| 3.580 | 0.495 | 0.410 | ||||||
| 0.708 | 5.124 | 0.119 | 0.019 | 73.89 | 1.97 | 0.50 | ||
| 0.734 | 6.439 | 0.301 | 0.488 | |||||
| 3.564 | 0.535 | 0.481 | ||||||
| 0.757 | 4.880 | 0.164 | 0.031 | 109.56 | 2.31 | 0.40 | ||
| 0.943 | 5.950 | 0.338 | 0.566 | |||||
| 3.171 | 0.433 | 0.385 | ||||||
| 0.760 | 4.626 | 0.229 | 0.049 | 196.31 | 3.15 | 1.01 |
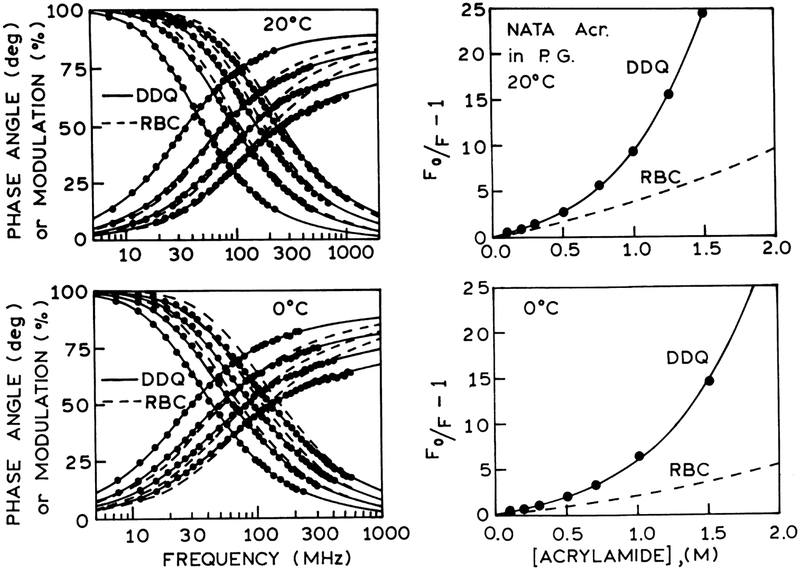
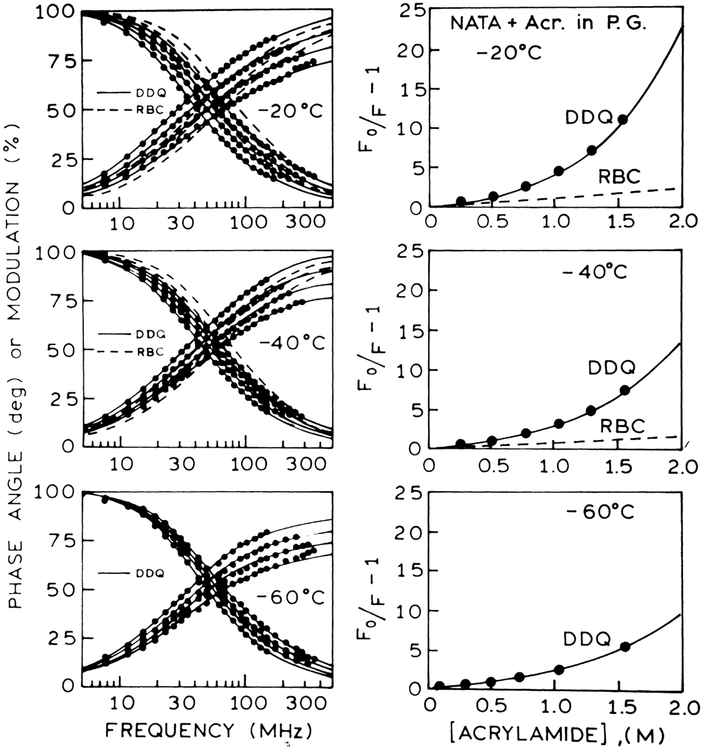
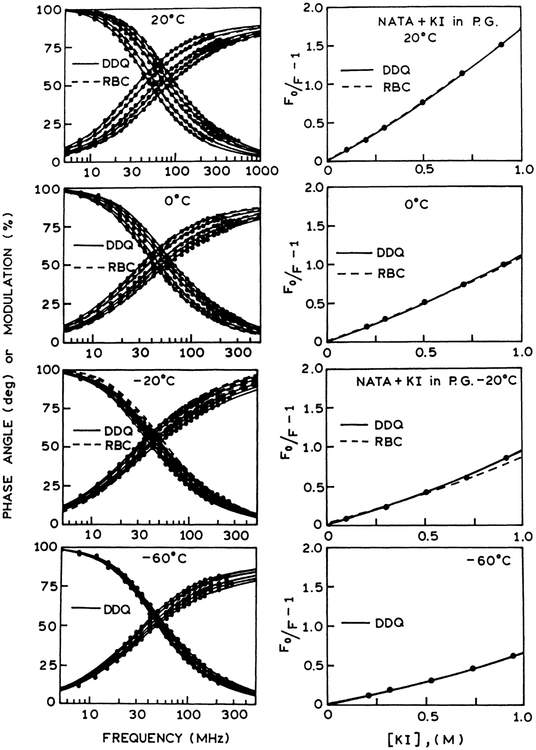
Frequency-domains of the intensity decays of NATA in propylene glycol at 20°C, 0°C, −20°C, −40°C and −60°C in the absence and presence of acrylamide or iodide are presented in Figs. 3, 4 and 7. In the presence of quenching frequency responses of NATA are shifted to higher frequency progressively with increasing concentrations of the quencher. This corresponds to a decrease in the mean decay time (see Tables 1 and 2). The complex decays of NATA are the results of the transient effect in fluorescence quenching. The observed effects are due to diffusion and through-space interactions between NATA and quenchers. Moreover, through-space quenching alone explains the upward curvature in Stern–Volmer plots (see Figs. 3 and 4).
Fig. 3.
Left panel: Frequency-domain intensity decays of NATA in propylene glycol in the presence (left to right) concentration of acrylamide at 20°C (0, 0.5, 1.0 and 1.5 M) and at 0°C (0, 0.505, 1.010 and 1.515 M). The solid lines show the best fit to the DDQ model using: (upper) a=5 Å and re =0.322 Å and (lower) a=5 Å and re =0.318 Å. The dashed lines show the best fit to the RBC model using a=5 Å. Right panel: Stern–Volmer plots for NATA quenched by acrylamide in propylene glycol at 20°C and at 0°C. The solid lines represent the calculated values of [(F0/F)−1] using parameter values from the DDQ model for a=5 Å. The dashed lines represent the RBC model using also a=5 Å.
Fig. 4.
Left panel: Frequency-domain intensity decays of NATA in propylene glycol in the presence (left to right) concentrations of acrylamide at −20°C (0, 0.512, 1.023 and 1.535 M), at −40°C (0, 0.518, 1.036 and 1.554 M) and at −60°C (0, 0.524, 1.048 and 1.572 M). The solid lines show the best fit to the DDQ model using: (top) a=5 Å and re =0.317 Å; (middle) a=5 Å and re =0.313 Å; and re =0.318 Å. The dashed lines show the best fit to the RBC model using a=5 Å. and (bottom) a=5 Å Right panel: Stern–Volmer plots for NATA quenched by acrylamide in propylene glycol at −20°C, at −40°C and at −60°C. The solid lines represent the calculated values of [(F0/F)−1] using parameter values from the DDQ model for a=5 Å. The dashed lines represent the RBC model using also a=5 Å.
Fig. 7.
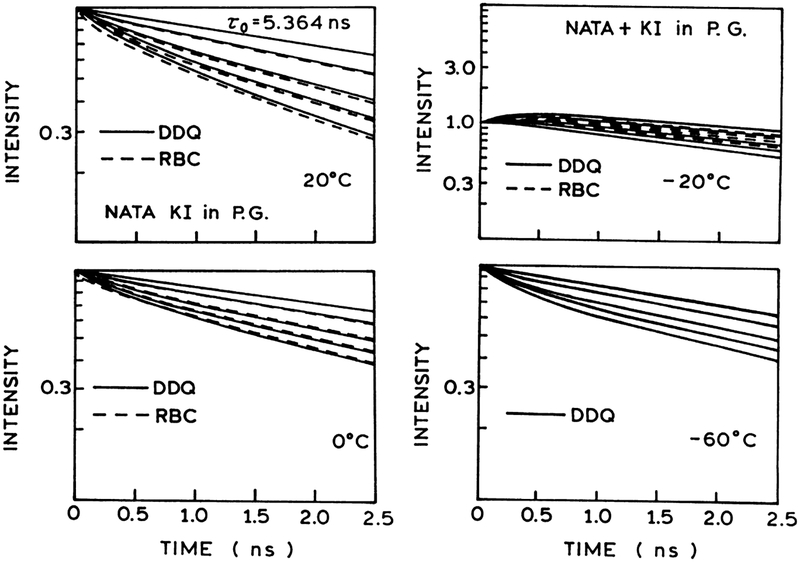
Left panel: Frequency-domain intensity decays of NATA in propylene glycol in the presence (left to right) concentrations of iodide at 20°C (0, 0.2, 0.5, 0.7 and 0.9 M), 0°C (0, 0.202, 0.505, 0.707 and 0.909 M), −20°C (0, 0.205, 0.512, 0.716 and 0.921 M), and −60°C (0, 0.210, 0.524, 0.734 and 0.943 M). The solid lines show the best fit to the DDQ model using from (top to bottom) a=5 Å, and re = 0.623 Å, 0.631 Å, 0.557Å and 0.513 Å, correspondingly. The dashed lines show the best fit to the RBC model using a=5 and re =0.623 Å, Å. Right panel: Stern–Volmer plots for NATA quenched by iodide in propylene glycol at 20°C, 0°C, −20°C and −60°C. The solid lines represent the calculated values of [(F0/F)−1] using parameter values from the DDQ model for a=5 Å. The dashed lines represent the RBC model using also a=5 Å.
4.3. DDQ and RBC models for tryptophan fluorescence quenching
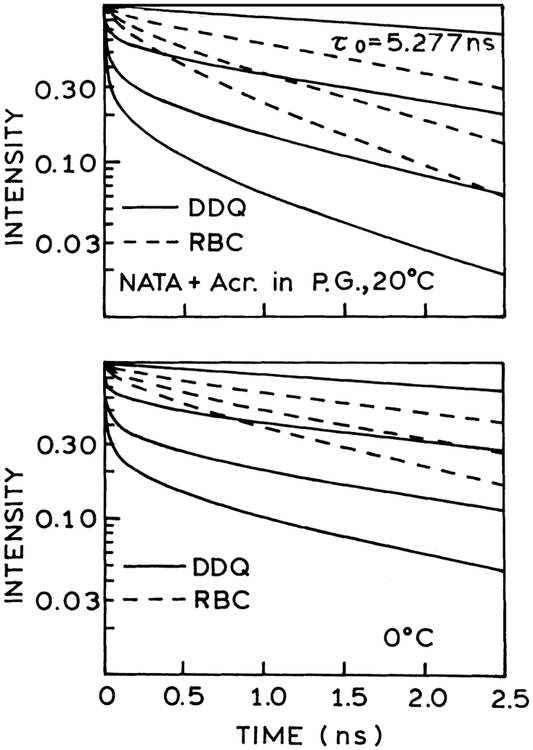
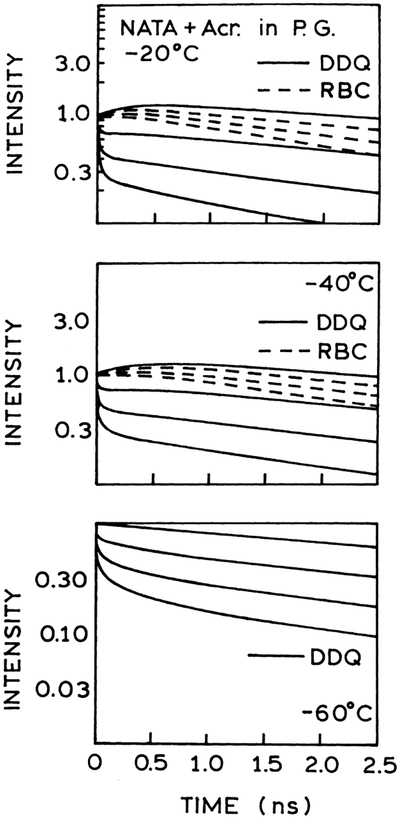
Frequency-domain and steady-state data of NATA quenching by acrylamide and iodide are analyzed using the radiation boundary condition (RBC), and distance-dependent quenching (DDQ) models for collisional quenching of fluorescence. We used multi-domain global analysis of the frequency-domain and steady state data to recover the variable parameters. The variable parameters are a, D and κ for the RBC model; a, re, D and ka for the DDQ model. From Figs. 3 and 4 it is evident that the RBC model cannot account for the frequency-domain data of NATA quenching by acrylamide. The inadequacy of the RBC model is also seen from the calculated quantum yields shown on the Stern–Volmer plots. The inability of the RBC model to account for the data is due to the presence of a short lifetime component in the intensity decays of NATA quenching (Figs. 5 and 6). In contrast to the RBC model, the DDQ model precisely accounts for the data of NATA quenching over the entire range of temperatures. The results of analysis of NATA quenching by iodide are exemplified in Fig. 7. In this case the RBC model can account for the data at 20°C and 0°C, however, the DDQ model also allows for an improved fit to the data. The results of the RBC and DDQ analysis are presented in Tables 3 and 4 for acrylamide quenching and in Tables 5 and 6 for iodide quenching of NATA, correspondingly. From Tables 4 and 6 it is important to note that ka values for acrylamide quenching of NATA (~1013 s−1) and iodide quenching of NATA (~109 s−1) remain the same over the range of temperature from 20 to −60°C.
Fig. 5.
Reconstructed time-dependent intensity decays of NATA in propylene glycol quenched by acrylamide at 20°C (0, 0.5, 1.0 and 1.5 M) and at 0°C (0, 0.505, 1.010 and 1.515 M) for the best-fit RBC (– – –) and DDQ (———) parameters.
Fig. 6.
Reconstructed time-dependent intensity decays of NATA in propylene glycol quenched by acrylamide at −20°C (0, 0.512, 1.023 and 1.535 M., at −40°C (0, 0.518, 1.036 and 1.554 M) and at −60°C (0, 0.524, 1.048 and 1.572 M. for the best-fit RBC (– – –) and DDQ (———) parameters.
Table 3.
Global RBC analysis of NATA quenching by acrylamide in propylene glycol at different temperatures
| Temperature (°C) | τi (ns) | αi | CQ (M) | α (Å) | D(cm2 s−1) | κ (cm s−1) | χR2 |
|---|---|---|---|---|---|---|---|
| 20 | 5.277 | 1.0 | 0 | 〈5〉 | 7.19 × 10⁻⁷ {(7.07–7.31) × 10−7}a | ∞ | 135.9 |
| 0.500 | |||||||
| 1.000 | 20.1 {18.4–21.8} | 9.57 × 10⁻⁹ {(6.96–13.2) × 10−9} | ∞ | 22.5 | |||
| 1.500 | |||||||
| 0 | 6.356 | 0.950 | 0 | 〈5〉 | 3.24 × 10⁻⁷ {(3.16–3.31) × 10−7} | ∞ | 173.5 |
| 0.936 | 0.950 | 0.500 | |||||
| 1.010 | 35.8 {26.6–39.7} | 3.09 × 10⁻¹⁰ {(2.74–9.94) × 10−10} | ∞ | 68.0 | |||
| 1.515 | |||||||
| −20 | 8.519 | 0.317 | 0 | 〈5〉 | 1.26 × 10⁻⁷ {(1.21–1.31) × 10−7} | ∞ | 185.6 |
| 4.953 | 0.464 | 0.512 | |||||
| 0.277 | −0.219 | 1.023 | 51.5 {45.2–58.8} | 2.94 × 10⁻¹¹ {(1.66–4.80) × 10− −11} | ∞ | 80.5 | |
| 1.535 | |||||||
| −40 | 8.452 | 0.200 | 0 | 〈5〉 | 8.86 × 10⁻⁸ {(8.48–9.26) × 10−8} | ∞ | 140.3 |
| 4.523 | 0.548 | 0.518 | |||||
| 0.477 | −0.252 | 1.036 | 98.1 {84.4–113.2} | 1.42 × 10⁻¹² {(0.77–2.49) × 10−12} | ∞ | 73.4 | |
| 1.554 | |||||||
| −60 | 12.432 | 0.020 | 0 | 〈5〉 | 〈1.0 × 10⁻¹⁵〉 | ∞ | 1251 |
| 5.387 | 0.980 | 0.524 | |||||
| 1.048 | |||||||
| 1.572 |
The numbers in braces {} represent the 67% confidence intervals obtained from the least-squares analysis.
Table 4.
Global DDQ analysisa of NATA quenching by acrylamide in propylene glycol at different temperatures
| Temperature (°C) | τi (ns) | αi | CQ (M) | re (Å) | D (cm2 s−1) | ka (1013 s−1) | χR2 |
|---|---|---|---|---|---|---|---|
| 20 | 5.277 | 1.0 | 0 | 0.322 {0.317–0.327}b | 1.86 × MT−7 {(1.82–1.90) × 10”7) | 5.50 {3.91–6.96} | 5.80 |
| 0.500 | |||||||
| 1.000 | |||||||
| 1.500 | |||||||
| 0 | 6.356 | 0.950 | 0 | 0.318 {0.313–0.322} | 6.02 × 10⁻⁸ {(5.89–6.14) × 10−8} | 3.85 {2.82–5.00} | 3.13 |
| 0.936 | 0.050 | 0.505 | |||||
| 1.010 | |||||||
| 1.515 | |||||||
| −20 | 8.519 | 0.317 | 0 | 0.317 {0.312–0.322} | 7.77 × 10⁻⁹ {(7.37–8.23) × 10−} | 5.28 {3.60–6.95} | 3.42 |
| 4.953 | 0.464 | 0.512 | |||||
| 0.277 | −0.219 | 1.023 | |||||
| 1.535 | |||||||
| −40 | 8.452 | 0.200 | 0 | 0.313 {0.307–0.318} | 2.69 × 10⁻⁹ {(2.12–2.96) × 10−9} | 2.06 {1.49–2.87} | 3.32 |
| 4.523 | 0.548 | 0.518 | |||||
| 0.477 | −0.252 | 1.036 | |||||
| 1.554 | |||||||
| −60 | 12.432 | 0.020 | 0 | 〈0.318〉 | 〈1 × 10⁻¹⁵〉 | 1.00 {0.85–1.09} | 15.7 |
| 5.387 | 0.980 | 0.524 | |||||
| 1.048 | 0.521 {0.506–0.531} | 〈1 × 10⁻¹⁵〉 | 0.00119 {(1.02–1.44) × 10−3} | 7.29 | |||
| 1.572 |
The distance of the closest approach a was held constant at 5 Å during the analysis.
The numbers in braces {} represent the 67% confidence intervals obtained from the least-squares analysis.
Table 5.
Global RBC analysis of NATA quenching by iodide in propylene glycol at different temperatures
| Temperature (°C) | τi (ns) | αi | CQ (M) | a (Å) | D (cm2 s−1) | κ (cm s−1) | χR2 |
|---|---|---|---|---|---|---|---|
| 20 | 5.364 | 1.0 | 0 | 〈5〉 | 2.89 × 10⁻⁷ {(2.88–2.90) × 10−7}a | ∞ | 10.15 |
| 0.200 | |||||||
| 0.500 | |||||||
| 0.700 | 9.06 {8.7–9.4} | 7.64 × 10⁻⁸ {(6.95–8.51) × 10−8} | 24.4 {21.8–27.5} | 3.94 | |||
| 0.900 | |||||||
| 0 | 6.963 | 0.677 | 0 | 〈5〉 | 1.44 × 10⁻⁷ {(1.43–1.45) × 10−7} | ∞ | 22.89 |
| 4.625 | 0.323 | 0.202 | |||||
| 0.505 | |||||||
| 0.707 | 10.9 {10.1–11.7} | 1.30 × NT−8 {(1.0–1.67) × 10−8} | ∞ | 11.80 | |||
| 0.909 | |||||||
| −20 | 7.347 | 0.576 | 0 | 〈5〉 | 9.82 × 10⁻⁸ {(9.7–9.93) × 10−8} | ∞ | 58.2 |
| 3.418 | 0.200 | 0.205 | |||||
| 0.295 | −0.224 | 0.512 | |||||
| 0.716 | 51.9 {46.9–53.6} | 1.73 × 10⁻¹¹ {(1.54–2.57) × 10−11} | ∞ | 25.14 | |||
| 0.921 | |||||||
| −60 | 7.690 | 0.097 | 0 | 〈5〉 | 〈1.0 × l0−15〉 | ∞ | 3418 |
| 5.200 | 0.903 | 0.210 | |||||
| 0.524 | |||||||
| 0.734 | |||||||
| 0.943 |
The numbers in braces {} represent the 67% confidence intervals obtained from the least-squares analysis.
Table 6.
Global DDQ analysisa of NATA quenching by iodide in propylene glycol at different temperatures
| Temperature (°C) | τi (ns) | αi | CQ (M) | re (Å) | D (cm2 s−1) | ka (109 s−1) | χR2 |
|---|---|---|---|---|---|---|---|
| 20 | 5.364 | 1.0 | 0 | 0.623 | 1.93 × 10⁻⁷ | 5.94 | 3.56 |
| 0.200 | {0.594–0.651}b | {(1.87–1.98) × 10−7} | {5.42–6.46} | ||||
| 0.500 | |||||||
| 0.700 | |||||||
| 0.900 | |||||||
| 0 | 6.963 | 0.677 | 0 | 0.631 | 5.68 × x10−8 | 3.82 | 8.34 |
| 4.625 | 0.323 | 0.202 | {0.593–0.673} | {(5.25–6.19) × 10−8} | {3.30–4.30} | ||
| 0.505 | |||||||
| 0.707 | |||||||
| 0.909 | |||||||
| −20 | 7.347 | 0.576 | 0 | 0.557 | 3.62 × 10⁻⁹ | 7.48 | 4.24 |
| 3.418 | 0.200 | 0.205 | {0.543–0.571} | {(2.56–5.12) ×1O−9} | {6.92–8.04} | ||
| 0.295 | −0.224 | 0.512 | |||||
| 0.716 | |||||||
| 0.921 | |||||||
| −60 | 7.690 | 0.097 | 0 | 0.513 | 〈1.0 × l0−15〉 | 6.86 | 4.76 |
| 5.200 | 0.903 | 0.210 | {0.504–0.523} | {6.34–7.38} | |||
| 0.524 | |||||||
| 0.734 | |||||||
| 0.943 |
The distance of the closest approach a was held constant at 5 Å during the analysis.
The numbers in braces {} represent the 67% confidence intervals obtained from the least-squares analysis.
In Table 7 we compared the diffusion coefficients obtained from the DDQ and RBC data analysis with those calculated from the diffusion theory using Stokes–Einstein equation:
| (22) |
where kB is the Boltzman constant, T is the temperature in K, R is the radius of the molecule and η is the viscosity of propylene glycol (45.66 CP at 20°C). The radius of the molecule can be obtained from the relation R = (3V/4π)1/3 [18,40]. V is the molecular volume calculated as the sum of the van der Waals increments of atoms in the molecule.
Table 7.
The van der Waals radii of the fluorophore and quencher and their diffusion coefficients in propylene glycol at 20°C
The diffusion coefficient recovered from the intensity decay data of NATA quenched by acrylamide at 20°C using the RBC model for a=5 Å(7.19×10⁻⁷ cm2 s−1) is larger than predicted from the diffusion theory using the Stokes–Einstein equation (3.09×10⁻⁷ cm2 s−1). This can be explained by the compensation for the initial drop in the intensity decay introducing some additional quenching [36,28]. However, for iodide quenching the recovered value of D using the RBC model (2.89×10⁻⁷ cm2 s−1) is in good agreement with the value of diffusion coefficient predicted from the diffusion theory (3.61×10⁻⁷ cm−2 s−1). On the other hand, the DDQ model for acrylamide and iodide quenching, results with the values of D which are 1.86×10⁻⁷ cm2 s−1 and 1.93×10⁻⁷ cm2 s−1, respectively, and are slightly smaller than the calculated value from the Stokes–Einstein equation being 3.09×10⁻⁷ cm2 s−1 and 3.61×10⁻⁷ cm2 s−1, correspondingly (see Table 7). Such behavior usually is explained by the fluorophore–solvent or quencher–solvent interactions which slow diffusion [10,28], but this seems to be the minor effect.
Considering the van der Waals radii R of the indole chromophore of NATA (2.96 Å), acrylamide (2.56 Å) and iodide (1.99 Å) (see Table 7) one can estimate the minimum encounter distance a as the sum of the radii for acrylamide and iodide quenching of NATA to be 5.54 Å and 4.95 A, respectively. Previously, for the indole chromophore of NATA, acrylamide and iodide the molecular volume V was calculated from the relation (4/3)πrxry rz where rx, ry and rz are the van der Waals radii of the molecules in the x, y and z directions. The estimated values of rx, ry and rz from the molecular models of indole, acrylamide and iodide gave rise to the average radii of 2.2 Å[26], 1.7 Å [26] and 1.78 Å [28], respectively. From these radii the minimum encounter distance a for acrylamide and iodide quenching of NATA can be estimated as equal to 3.9 Å and 3.98 Å, respectively.
Considering both distances for collisional contact of the fluorophores and quencher molecules ranging from 3.9 Å to 5.54 Å for acrylamide and from 3.98 Å to 4.95 Å for iodide, we estimated for both quenchers the optimal distance of the closest approach a=5 Å.
In Tables 3–6 for acrylamide and iodide quenching of NATA, we list the goodness-of-fit values for global analysis of the frequency-domain and steady-state data. Based on this analysis, we note that the RBC model can be excluded based on the high values. In other instances, we have noted that the parameter values often become unreasonable prior to a significant elevation in . Using the DDQ model, it was possible to fit the frequency-domain and steady-state data at all temperatures, so as to result in a low value of (Figs. 3, 4 and 7).
In the RBC model the distance a describes the radius of the sphere which contains the quencher molecules which are able to quench the fluorophore. In fact, the parameter a in the RBC model (as well as in the DDQ model) describes the radius of the sphere constituting the excluded volume around the fluorophore. Quencher molecules are not found in this volume because of molecular size and solvation. The possibility of quenching appears in the RBC model only at immediate contact of the fluorophore with the quencher. No through-space interaction is taken into account in this model. Because the number of fluorophore–quencher pairs being in contact at the time of excitation is extremely small, no quenching can be simulated by this model when the diffusion coefficient is assumed to be zero. An increase of the value of the parameter a in this model only increases the surface of the sphere on which the fluorophore–quencher encounters may appear. No fluorophore molecules can be statically quenched in this model, except at very high quencher concentrations where there is immediate proximity at the moment of excitation. One has to notice that the fluorophore can appear to be statically quenched in terms of the DDQ model. The quenching radius is modeled here by value of the parameter re. Because of the allowed through-space interaction diffusion is not necessary to quench the fluorophores having the quencher molecules at distance a≤r≤a+(2÷3)×re. In our opinion, this possibility of apparent static quenching together with the assumed exponential form of the fluorophore–quencher interaction constitutes the main advantage of the DDQ model. Static quenching contributions cannot be taken into account using the RBC model, but are allowed in the DDQ analysis.
The difference between the DDQ and the RBC models can be seen by examining the time-dependent intensity decays as reconstructed from the best fits to the frequency-domain data. These reconstructed intensity decays are shown in Figs. 5 and 6, respectively. The DDQ model creates a short decay time component during the first 10 ps following excitation showing transition from one decay time to another, as a gradual transition from a fast to a slow decay. The characteristic increase in intensity and delay in slow decays observed at −20°C and −40°C is created by the lifetime components with negative amplitudes. The fast component in the fluorescence intensity decay is responsible for the low phase angles at higher frequencies and allowed for through-space quenching interactions. Apparently, this more complex intensity decay function is needed to account for the combined frequency-domain and steady-state data. The fast component in the decays is not provided by the RBC model (see also Fig. 8).
Fig. 8.
Reconstructed time-dependent intensity decays of NATA in propylene glycol quenched by iodide at 20°C (0, 0.2, 0.5, 0.7 and 0.9 M) at 0°C (0, 0.202, 0.505, 0.707 and 0.909 M), −20°C (0, 0.205, 0.512, 0.716 and 0.921 M) and −60°C (0, 0.210, 0.524, 0.737 and 0.943 M) for the best-fit RBC (– – –) and DDQ (— — —) parameters.
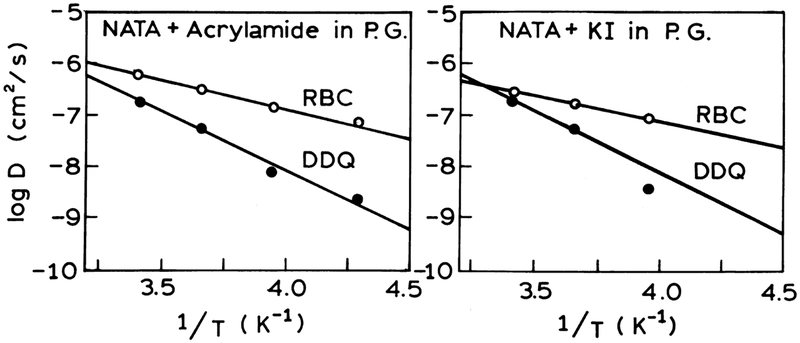
Fig. 9 show Arrhenius plots for NATA in propylene glycol in the presence of acrylamide and iodide correspondingly obtained based on the RBC and DDQ models. The DDQ model gives higher values of the activation energies (10.09 and 10.44 cal mol−1, see Table 8) which are closer to the activation energy for propylene glycol obtained from viscosity changes which is ~11 cal mol−1. The mutual diffusion coefficients (D20) for NATA quenched by acrylamide and iodide obtained from extrapolation of the arrhenius plots to 20°C for the RBC and DDQ models are similar to those D recovered from the decay data measured at 20°C (see Table 7).
Fig. 9.
Arrhenius plots for NATA in propylene glycol in the presence of acrylamide (left) and iodide (right) obtained based on the RBC and DDQ models.
Table 8.
Activation energies calculated from the temperature dependence of the recovered apparent diffusion coefficients obtained based on the RBC and DDQ models
| Quencher | Parameters | RBC | DDQ |
|---|---|---|---|
| Acrylamide | D20(cm2 s−1) | 6.83 × 10⁻⁷ {(5.61–8.17) × 10−7}a | 2.05 × 10⁻⁷ {(1.46–2.59) × 10−7} |
| Ea(kcal mol−1) | 4.73 {3.52–5.83} | 10.09 {7.66–11.76} | |
| Iodide | D20 (cm2 s−1) | 2.83 × 10⁻⁷ {(2.33 – 3.45) × 10−7} | 1.94 × 10⁻⁷ {(1.41–2.65) × 10−7} |
| Ea(kcal mol−1) | 4.00 {1.81–6.19} | 10.44 {4.28–16.60} |
The numbers in braces {} represent the 67% confidence intervals obtained from the least-squares analysis.
4.4. Mechanisms of tryptophan fluorescence quenching
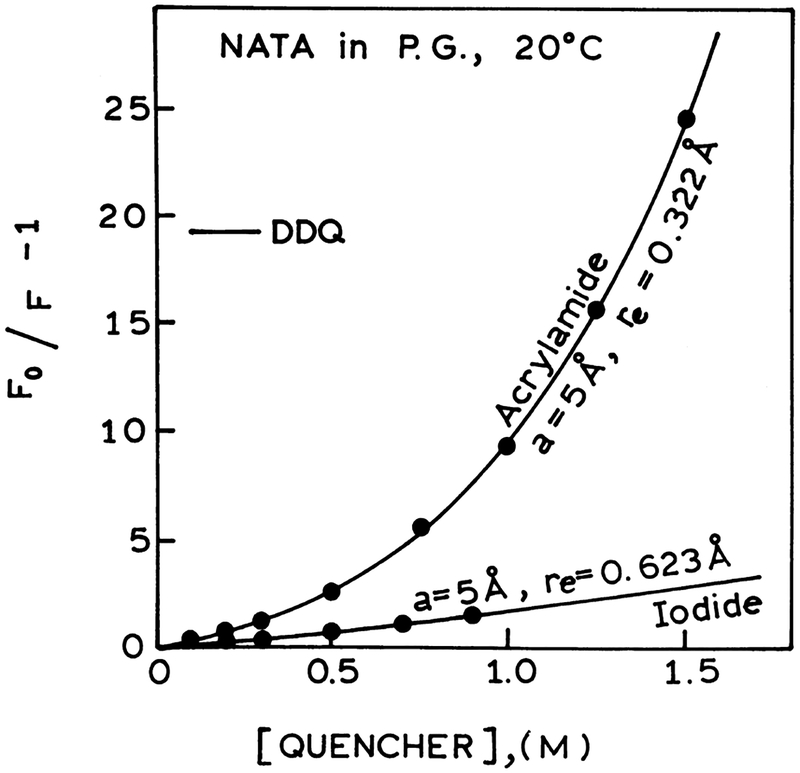
Our data on acrylamide and iodide quenching of NATA can be summarized based on the DDQ analysis adequate for the both quenchers. The Stern–Volmer plots for NATA in propylene glycol quenched by acrylamide and iodide are presented in Fig. 10 showing the difference in quenching effect. Acrylamide is electrically neutral and a strong quencher, while iodide is ionic and a relatively weaker quencher of tryptophan fluorescence. The difference in quenching is also clearly seen by the frequency-domain data for both quenchers (Figs. 3, 4 and 7) and on the profiles of reconstructed time-dependent intensity decays of NATA (Figs. 5, 6 and 8) when quenched over the range of temperature (20°C, 0°C, −20°C and −60°C). The observed highly efficient quenching NATA by acrylamide and less efficient quenching NATA by iodide are now discussed based on the mechanisms of interactions between acrylamide or iodide and tryptophan.
Fig. 10.
Stern–Volmer plots for NATA in propylene glycol at 20°C quenched by acrylamide (●) and iodide (○) showing the difference in the quenching effect. The solid lines represent the calculated values of (F0/F)−1 using the parameter values from the DDQ model.
Acrylamide is known to be an electron-acceptor [41]. Quenching of singlet excited tryptophan, which is a good electron donor [41–45], can be due to the electron transfer from tryptophan to acrylamide. The acrylamide quenching of NATA can be described by the transiently formed nonemissive exciplex 1(NATAδ+ ⋯Acδ−)* which in polar propylene glycol or aqueous solution is followed by the charge separation and the formation of the solvated radical ions [41,46]. This is shown on the scheme:
| (23) |
The efficiency of quenching is correlated with the overall free-energy change, ΔGET, for the electron transfer process and can be evaluated from Rehm and Weller equation and theory of Marcus (see Refs. [47,48]).
Iodide, bromide and alkyl halides are well established as heavy-atom perturbers of luminescence of aromatic and heteroaromatic fluorophores [28,49–54] including indole [49,50] and tryptophan [49]. The presence of heavy atoms or heavy atom containing molecules in the environment increases the rates of spin-forbidden processes of the fluorophores via a spin-orbital coupling mechanism. The effect of heavy atoms in decrease the fluorescence intensity is accompanied by increase the phosphorescence intensity and decrease the phosphorescence lifetime of the fluorophores. For instance, 1 M sodium iodide decreases the fluorescence intensity of 2-naphthalene sulfonate adsorbed on filter paper [51,53] and enhances room temperature phosphorescence (RTP) 40-fold without altering the transition energy. Moreover, the RTP of indole on filter paper is enhanced 370-fold and of tryptophan 455-fold by addition of 1 M sodium iodide [49]. The mechanism of the fluorescence quenching of NATA by iodide during the collisional contact can be explained by the exchange interactions between the singlet excited tryptophan and iodide causing the increase of the ISC process. This is followed by the separation of the triplet-excited fluorophore and iodide according to the scheme:
The negative iodide ion cannot be an electron acceptor and in the presence of excited tryptophan cannot act as the efficient electron donor. Therefore iodide quenching of NATA appears to be due to an external heavy atom effect.
Electron transfer and exchange interactions processes describe two mechanisms of quenching NATA by arylamide and iodide, respectively. Both processes depend on the short range interactions requiring close contact between the reactants. From the geometry of the molecules the contact distance is in the range of 4–6 Å. Using DDQ-global analysis of the frequency domain and steady state data for acrylamide and iodide quenching of NATA the distance of the closest approach a=5Å appears to be the most appropriate distance allowing for excellent agreement between the experimental data and the best fit to the model (see Figs. 3–8). From the DDQ analysis using a=5 Å (see Tables 4 and 6) acrylamide quenching of NATA is characterized by a characteristic distance of re =0.32 and bimolecular rate constant for quenching ka=5.5×10¹³ s−1. For iodide quenching of NATA re =0.62 and ka=5.9×10⁹ s−1. The bimolecular rate constants recovered from the DDQ analysis characterize quantitatively the acrylamide and iodide quenching of NATA in propylene glycol (Figs. 3, 4 and 7). Additionally (Fig. 8) we can also see that for the less efficient quencher iodide there is no short lifetime component in the intensity decay of NATA.
5. Conclusions
We have examined the intensity decays of NATA in propylene glycol over a range of temperatures and viscosities, when quenched by acrylamide and iodide. We also examined the Stern–Volmer plots which displayed significantly upward curvature. The data could not be explained by the RBC model. However, the data were consistent with the distance-dependent model where the rate of quenching decreased exponentially with the fluorophore–quencher distance. The presence of a distance-dependent and/or through space interaction was demonstrated by the presence of quenching in frozen solution where diffusion does not occur.
For both iodide and acrylamide quenching the quenching rate constant decreases rapidly with distance, and the interactions are very local (≤1 Å). However, the quenching rate constant at the contact distance is much larger for acrylamide (5.5×10¹³ s−1) than for iodide (5.9×10⁹ s−1). This difference in rate constants demonstrates that acrylamide quenching occurs by an electron transfer mechanism and that iodide quenching occurs by heavy atom (exchange) interactions.
Acknowledgements
This work was supported by grants from the National Institutes of Health GM-39617 and RR-08119, with support for instrumentation from NIH RR-10416.
Abbreviations:
- NATA
N-acetyl-l-tryptophanamide
- F
fluorophore
- Q
quencher
- DDQ
distance-dependent quenching
- RBC
radiation boundary condition
- ET
electron transfer
- RTP
room temperature phosphorescence
References
- [1].Baeyens WRG, Keukeleire D. De, Korkidis K (Eds.), Luminescence Techniques in Chemical and Biochemical Analysis, M. Dekker, N.Y., 1991. [Google Scholar]
- [2].Lakowicz JR, Principles of Fluorescence Spectroscopy, Plenum Press, N.Y., 1983. [Google Scholar]
- [3].Lakowicz JR, Fluorescence spectroscopic investigations of the dynamic properties of proteins, membranes, and nucleic acids. J. Biochem. Biophys. Methods 2 (1980) 90–119. [DOI] [PubMed] [Google Scholar]
- [4].Eftink MR, Ghiron C, Fluorescence quenching studies with proteins. Anal. Biochem 114 (1981) 199–227. [DOI] [PubMed] [Google Scholar]
- [5].Eftink MR, Fluorescence quenching: theory and applications, in: Lakowicz JR (Ed.), Topics in Fluorescence Spectroscopy, Vol. 2 (1991) pp. 53–126 [Google Scholar]
- [6].Vanderkooi JM, Englander SW, Papp S, Wright WW, Owen CS, Long-range electron exchange measured in proteins by quenching of tryptophan phosphorescence. Proc. Natl. Acad. Sci. USA 87 (1990) 5099–5103. [DOI] [PMC free article] [PubMed] [Google Scholar]
- [7].Lehrer SS, Solute perturbation of protein fluorescence. The quenching of the tryptophan fluorescence of model compounds and of lysozyme by iodide ion. Biochemistry 10 (1971) 3254–3263. [DOI] [PubMed] [Google Scholar]
- [8].Calhoun DB, Englander SW, Wright WW, Vanderkooi JM, Quenching of room temperature protein phosphorescence by added small molecules. Biochemistry 27 (1988) 8466–8474. [DOI] [PubMed] [Google Scholar]
- [9].Lakowicz JR, Weber G, Quenching of protein fluorescence by oxygen. Detection of structural fluctuations in protein on the nanosecond timescale. Biochemistry 12 (1973) 4171–4179. [DOI] [PMC free article] [PubMed] [Google Scholar]
- [10].Somogyi B, Lakos Z, Protein dynamics and fluorescence quenching. Photochem. Photobiol. B.: Biol 18 (1993) 3–16. [DOI] [PubMed] [Google Scholar]
- [11].Lakowicz JR, Weber G, Quenching of fluorescence by oxygen. A probe for structural fluctuations in macromolecules. Biochemistry 12 (1973) 4161–4170. [DOI] [PMC free article] [PubMed] [Google Scholar]
- [12].Lakowicz JR, Gryczynski I, Szmacinski H, Cherek H, Joshi N, Anisotropy decays of single tryptophan proteins measured by GHz frequency-domain fluorometry with collisional quenching. Eur. Biophys. J 19 (1991) 125–140. [DOI] [PMC free article] [PubMed] [Google Scholar]
- [13].Lakowicz JR, Diffusive transport of oxygen through proteins and membranes quantified by fluorescence quenching, in: Ho C et al. (Eds.), Hemoglobin and Oxygen Binding, vol. 1, 1982, pp. 443–448. [Google Scholar]
- [14].Stubbs CD, Williams BW, Fluorescence in membranes, in: Lakowicz JR (Ed.), Topics in Fluorescence Spectroscopy, Biochemical Applications, vol. 3, Plenum Press, N.Y., 1992, pp. 231–271. [Google Scholar]
- [15].Abuin EB, Lissi EA, Diffusion and concentration of oxygen in microheterogeneous systems. Evaluation from luminescence quenching data. Prog. Reaction Kinetics 16 (1991) 1–33. [Google Scholar]
- [16].James E, Zlotnick A, Tennyson J, Holloway P, Fluorescence quenching of cytochrome b5 in vesicles with an asymmetric transbilayer distribution of brominated phosphatidylcholine. J. Biol. Chem 261 (1986) 6725–6729. [PubMed] [Google Scholar]
- [17].Markello T, Zlotnick A, James E, Tennyson J, Holloway P, Determination of the topography of cytochrome b5 in lipid vesicles by fluorescence quenching. Biochemistry 24 (1985) 2895–2901. [DOI] [PubMed] [Google Scholar]
- [18].Nemzek TL, Ware WR, Kinetics of the diffusion controlled reactions: transient effects in fluorescence quenching. J. Chem. Phys 62 (1975) 477–489. [Google Scholar]
- [19].Andre JC, Niclause M, Ware WR, Kinetics of partly diffusion controlled reactions: I. Transient and apparent transient effect in fluorescence quenching. Chem. Phys 28 (1978) 371–377. [Google Scholar]
- [20].Lakowicz JR, Joshi NB, Johnson ML, Szmacinski H, Gryczynski I, Diffusion coefficients of quenchers in proteins from transient effects in the intensity decays. J. Biol. Chem 162 (1987) 10907–10910. [PubMed] [Google Scholar]
- [21].Lakowicz JR, Johnson ML, Gryczynski I, Joshi N, Laczko G, Transient effects in fluorescence quenching measured by 2 GHz frequency-domain fluorometry. J. Phys. Chem 19 (1987) 3277–3285. [DOI] [PMC free article] [PubMed] [Google Scholar]
- [22].Gryczynski I, Szmacinski H, Laczko G, Wiczk W, Johnson ML, Kusba J, Lakowicz JR, Conformational differences of oxytocin and vasopressin as observed by fluorescence anisotropy decays and transient effects in collisional quenching of tyrosine fluorescence. J. Fluorescence 1 (1991) 163–176. [DOI] [PubMed] [Google Scholar]
- [23].Lakowicz JR, Gryczynski I, Frequency-domain fluorescence spectroscopy; instrumentation and applications. Arabian J. Sci. Engr 17 (1992) 261–286. [Google Scholar]
- [24].Joshi N, Johnson ML, Gryczynski I, Lakowicz JR, Radiation boundary conditions in collisional quenching of fluorescence determination by frequency-domain fluorometry. Chem. Phys. Lett 135 (1987) 200–207. [Google Scholar]
- [25].Lakowicz JR, Kuśba J, Szmacinski H, Johnson ML, Gryczynski I, Distance-dependent fluorescence quenching observed by frequency-domain fluorometry. Chem. Phys. Lett 206 (1993) 455–463. [Google Scholar]
- [26].Lakowicz JR, Zelent B, Gryczynski I, Kuśba J, Johnson ML, Distance-dependent fluorescence quenching of tryptophan by acrylamide. Photochem. Photobiol 60 (1994) 205–214. [DOI] [PubMed] [Google Scholar]
- [27].Zelent B, Kuśba J, Gryczynski I, Lakowicz JR, Distance-dependent quenching of Anthracene fluorescence by N,N-diethylaniline observed by frequency-domain flourometry. Appl. Spectroscopy 43 (1995) 43–50. [DOI] [PubMed] [Google Scholar]
- [28].Zelent B, Kuśba J, Gryczynski I, Johnson ML, Lakowicz JR, Distance-dependent fluorescence quenching of p-bis[2-(5-phenyloxazolyl)]benzene by various quenchers. J. Phys. Chem 47 (1996) 18592–18602. [DOI] [PMC free article] [PubMed] [Google Scholar]
- [29].Parker CA, Photoluminescence of Solutions, Elsevier, N.Y., 1968, pp. 220–226. [Google Scholar]
- [30].Lakowicz JR, Laczko G, Gryczynski I, A 2 GHz frequency-domain fluorometer. Rev. Sci. Instrum 57 (1986) 2499–2506. [Google Scholar]
- [31].Laczko G, Gryczynski I, Gryczynski Z, Wiczk W, Malak H, Lakowicz JR, A 10 GHz frequency-domain fluorometer. Rev. Sci. Instrum 61 (1990) 2331–2337. [Google Scholar]
- [32].Eads DD, Dismer BG, Fleming GR, A subpicosecond, subnanosecond and steady-state study of diffusion-influenced fluorescence quenching. J. Chem. Phys 93 (1990) 1136–1148. [Google Scholar]
- [33].Kuśba J, Sipp B, Temporal behavior of the rate for short-range energy transfer in fluid solution. Chem. Phys 124 (1988) 223–226. [Google Scholar]
- [34].Kuśba J, Lakowicz JR, Diffusion modulated energy transfer and quenching: analysis by numerical integration of the diffusion equation in La Place space, in: Johnson ML, Brand L (Eds.., Methods in Enzymology, Numerical Computer Methods, Pt. B, vol. 240, Academic Press, Inc., New York, 1994, pp. 216–262. [DOI] [PubMed] [Google Scholar]
- [35].Kuśba J, Sipp B, On the use of analytical approximate expressions for the transfer rate in excitation transfer kinetics. J. Luminescence 33 (1985) 255–260. [Google Scholar]
- [36].Lakowicz JR, Zelent B, Kuśba J, Gryczynski I, Distance-dependent quenching of Nile Blue fluorescence by N,N-diethylaniline observed by frequency-domain fluorometry. J. Fluorescence 6 (1996) 187–194. [DOI] [PubMed] [Google Scholar]
- [37].Beechem JM, Gratton E, Ameloot M, Knutson JR, Brand L, The global analysis of fluorescence intensity and anisotropy decay data: second-generation theory and programs, in: Lakowicz JR (Ed.), Topics in Fluorescence Spectroscopy: Principles, vol. 2, Plenum Press, New York, 1991, pp. 241–305. [Google Scholar]
- [38].Straume M, Frasier-Cadoret SG, Johnson ML, Least-squares analysis of fluorescence data, in: Lakowicz JR(Ed.), Topics in Fluorescence Spectroscopy: Principles, vol. 2, Plenum Press, New York, 1991, pp. 177–240. [Google Scholar]
- [39].Bevington PR (Ed.), Data Reduction and Error Analysis for the Physical Sciences, McGraw-Hill, New York, 1969, pp. 336. [Google Scholar]
- [40].Edward JT, Molecular volumes and Stokes–Einstein equation. J. Chem. Educ 47 (1970) 261–270. [Google Scholar]
- [41].Evans RF, Kuntz RR, Volkert WA, Ghiron CA, Flash photolysis of N-acetyl-l-tryptophanamide: the relationship between radical yields and fluorescence quenching. Photochem. Photobiol 27 (1978) 511–515. [Google Scholar]
- [42].Creed D, The photophysics and photochemstry of the near-UV absorbing amino acids — I. Tryptophan and its simple derivatives. Photochem. Photobiol 39 (1984) 537–562. [Google Scholar]
- [43].Santus R, Bazin M, Aubailly M, Nature, identification and properties of intermediates produced by UV excitation of indole derivatives at low and room temperatures. Some applicatons to tryptophan-containing proteins. Rev. Chem. Intermed 3 (1980) 231–283. [Google Scholar]
- [44].McGimpsey WG, Görner H, Photoionization of indole N -methylindole and tryptophan in aqueous solution upon excitation at 193 nm. Photochem. Photobiol 64 (1996) 501–509. [Google Scholar]
- [45].Namiki A, Nakashima N, Yoshihara K, Fluorescence quenching due to the electron transfer. Indole–chloro-methanes in rigid ethanol glass. J. Chem. Phys 71 (1979) 925–930. [Google Scholar]
- [46].Mattay J, Vondenhof M, Contact and solvent-separated radical ion pairs in organic photochemistry, Topics in Current Chemistry, Springer-Verlag, Berlin, Heidelberg, Vol. 159 (1991) 219–255. [Google Scholar]
- [47].Kavarnos GJ, Fundamental concepts of photoinduced electron transfer, Topics in Current Chemistry, Springer-Verlag, Berlin, Heidelberg, Vol. 156 (1990) 21–58. [Google Scholar]
- [48].Suppan P, The Marcus inverted region, Topics in Current Chemistry, Springer-Verlag, Berlin, Heidelberg, Vol. 163 (1992) 95–130. [Google Scholar]
- [49].Meyers ML, Seybold PG, Effects of external heavy atoms and other factors on the room-temperature phosphorescence and fluorescence of tryptophan and tyro-sine. Anal. Chem 51 (1979) 1609–1612. [Google Scholar]
- [50].Lessard G, Durocher G, Singlet and triplet quenching of indole by heavy atom containing molecules in a low temperature glassy matrix. Evidence for complexation in the triplet state. J. Phys. Chem 82 (1978) 2812–2819. [Google Scholar]
- [51].Seybold PG, White W, Room temperature phosphorescence analysis; use of the external heavy-atom effect. Anal. Chem 47 (1975) 1199–1200. [Google Scholar]
- [52].Najbar J, Mac M, Mechanisms of fluorescence quenching of aromatic molecules by potassium iodide and potassium bromide in methanol–ethanol solutions. J. Chem. Soc. Faraday Trans 87 (1991) 1523–1529. [Google Scholar]
- [53].White W, Seybold PG, External heavy-atom effect on the room-temperature luminescence of adsorbed dyes. J. Phys. Chem 81 (1977) 2035–2040. [Google Scholar]
- [54].Berlman IB, Empirical study of heavy-atom collisonal quenching of the fluorescence state of aromatic compounds in solution. J. Phys. Chem 77 (1973) 562–567. [Google Scholar]


