

Abstract
Longitudinal monitoring of tumor size in vivo can provide important biological information about disease progression and treatment efficacy that is not captured by other modes of quantification. Ultrasound enables high throughput evaluation of orthotopic mouse models via fast acquisition of three-dimensional tumor images and calculation of volume with a reasonable degree of accuracy. Herein, we compare orthotopic pancreatic tumor volume measurements determined by ultrasound with volume measured by calipers and tumor weight, and found strong correlations between the three modalities over a large range of tumor sizes, suggesting ultrasound can accurately quantify tumor volumes in this model. Furthermore, we demonstrate the unique ability of longitudinal treatment monitoring to reveal a tumor size-dependent dependent response to Benzoporphyrin Derivative photodynamic therapy (BPD-PDT) and irinotecan. Small tumors (5–35 mm3) were found to respond well to a single round of PDT, while large tumors (35–65 mm3) showed no response to the same treatment. These results highlight the role that tumor size can play in preclinical interpretation of treatment response, and more generally suggest that careful evaluation of subtle biological features such as this must be carefully considered in order to grant a more comprehensive understanding of disease biology in vivo.
Graphical abstract text:
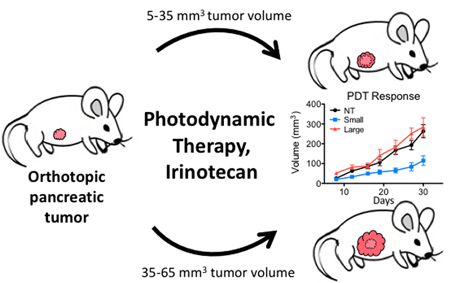
Tumor volume measured by ultrasound agrees well with volume measured by calipers and tumor weight in an orthotopic mouse model of pancreatic cancer. Using ultrasound to noninvasively monitor tumor growth longitudinally, a size-dependent response to photodynamic therapy (PDT) and low dose irinotecan is revealed. Small tumors respond to each monotherapy, while large ones only to their synergistic combination.
INTRODUCTION
Mouse models of cancer have been utilized as a tool for investigating the efficacy of new anti-cancer therapies for decades. The ability of these models to more comprehensively reflect the biology seen in human disease as compared to in vitro models has made them an indispensable, albeit with limitations, workhorse of the preclinical part of the drug development process. Treatment response in vivo can be determined by a variety of metrics, including overall survival or treatment induced changes to molecular markers. However, response is commonly quantified by changes in tumor size, in particular volume or weight (1), at a fixed time point or longitudinally. While it goes without saying that meaningful and robust conclusions regarding in vivo treatment response must be based on accurate underlying data, ensuring this is not trivial, and a number of studies have been conducted to verify the accuracy of non-invasive tumor measurements in this setting (1–8).
Tumor size is an important parameter both clinically and in preclinical in vivo studies. Longitudinally monitoring disease in a given model or in response to treatment can provide valuable insights into the biology and progression of disease, and obviates some of the fluctuations that are inherent in outcomes measured from global averages of mice (patients). Growth rates of tumors can provide information about the disease phenotype of a particular model (9–11). Tumor regrowth rates after treatment can also yield insight as to the durability of a particular treatment and inform dosing schedules to provide sustained remission (12,13). Clinically, change in tumor size is the primary metric for objectively evaluating treatment response. The Response Evaluation Criteria in Solid Tumors (RECIST) guidelines provide a standardized framework for determining tumor progression or response to therapy in clinical studies and underscore the importance of tumor size measurements when assessing clinical efficacy of a new therapy (14).
A number of methods and tools are available to quantify tumor burden in preclinical animal models. Non-invasive MRI and CT can obtain highly detailed 3-dimensional images. However, their high cost, long acquisition time, and the need for specialized training to operate these instruments makes them cumbersome to use in large preclinical treatment response studies. Optical based imaging modalities using bioluminescent or fluorescent cell lines also allow for non-invasive longitudinal measurements while being simpler and cheaper than MRI or CT, but have the disadvantage of requiring genetically altered cells. Furthermore, differences in imaging and model parameters preclude absolute tumor volume quantification for comparison between studies despite efforts to correlate emission intensities and tumor size in these models (5,15). In subcutaneous models, calipers are used extensively as they are easy to use and inexpensive; however, they are not practical in orthotopic models. Tumor weight is a useful and commonly reported metric, but requires a terminal procedure which precludes longitudinal monitoring (16). Ultrasound is also used extensively both preclinically and in the clinic to make diagnoses and evaluate treatment response as it offers some of the benefits of optical modalities, including ease of use, high throughput capacity, and sub-millimeter scale resolution, as well as the depth penetration and 3-dimensional imaging capabilities afforded by MRI and CT. These characteristics make ultrasound a powerful modality for preclinical studies, particularly for large cohorts of orthotopically implanted animals where a wide range of tumor sizes must be accurately and non-invasively measured.
In this study, we establish the accuracy and reproducibility of ultrasound tumor volume measurements in an orthotopic mouse model of pancreatic cancer. Using an ellipsoidal volume estimation, tumor volume determined by ultrasound exhibits a size dependent correlation with volume determined by digital calipers, with smaller tumors correlating more strongly than large ones. We also report on the impact of initial tumor size on treatment response in a recently established combination of Benzoporphyrin Derivative photodynamic therapy (BPD-PDT) and nanoliposomal irinotecan (L-IRI) (9). This study demonstrates the need to consider how subtle biological variables, such as initial tumor size, may affect treatment response data and potentially alter the interpretation of overall outcomes.
MATERIALS AND METHODS
Cell lines and culture.
MIA PaCa-2 pancreatic cancer cells (MP2) obtained from ATCC were cultured according to the vendor’s instructions. Patient derived pancreatic cancer associated fibroblasts (PCAF) were obtained via MTA from the laboratory of Diane Simeone and were isolated as previously described (17). Both lines were grown in Dulbecco’s Modified Eagle’s Medium supplemented with 10% fetal bovine serum and 100 U/mL penicillin/streptomycin at 37oC and 5% CO2 in a humidified incubator, and confirmed negative for mycoplasma contamination.
Preparation of liposomal BPD and irinotecan.
Nanoliposomal formulations of Benzoporphyrin Derivative (L-BPD) and irinotecan (L-IRI) were prepared and characterized as described previously (9). Both were prepared by freeze-thaw extrusion, and particle size, polydispersity index, and zeta potential determined using a Zetasizer NanoZS (Malvern). BPD and irinotecan concentrations were measured by UV-Vis spectrophotometry in dimethyl sulfoxide (DMSO) using their known molar extinction coefficients (BPD: ε=34,895 M−1 cm−1 at 687nm; irinotecan: ε =21,835 M−1 cm−1 at 384nm).
Orthotopic pancreatic tumor implantation.
All animal experiments were performed according to approved MGH Institutional Animal Care and Use Committee (IACUC) protocols. Orthotopic tumors were established in male athymic (nu/nu) Swiss mice at 4–6 weeks of age. While under ketamine/xylazine anesthetization, a 1 cm incision was made in the left abdomen of the animal to exteriorize the pancreas. Longitudinal treatment response studies were carried out with an established orthotopic model of pancreatic cancer by implanting 1×10⁶ MP2 cells in a medium + Matrigel mixture. Tumor measurement method studies were performed on mice orthotopically implanted with 0.5×10⁶ MP2 + 0.5×10⁶ PCAF in order to further characterize this relatively new orthotopic model. After injection into the pancreas, the incision was sutured aseptically.
In vivo combination treatments and ultrasound monitoring.
Treatments were initiated 9 days post implantation in MP2 implanted mice. One hour after intravenous injection of L-BPD (0.25 mg/kg) and/or L-IRI (20 mg/kg), mice were anesthetized and the pancreas exteriorized. PDT was performed with a 690 nm laser (75 J/cm2, 100 mW/cm2) by focusing a vertical beam onto the tumor. Surrounding tissue and skin were protected from light using an opaque cloth. Following PDT, incisions were sutured aseptically.
Tumor growth was measured longitudinally using a 2-dimensional ultrasound imaging system (Vevo LAZR, VisualSonics). Mice were anesthetized with isoflurane and placed on a 37oC heating pad to maintain body temperature during the procedure. An MS550 transducer (central frequency 40 MHz) ultrasound probe with axial resolution of 40μm and a 14.6 mm field of view was used. Once the tumor was identified, the entire tumor volume was captured by scanning along the length of the tumor and obtaining two-dimensional images at 152 um intervals. Height and width measurements were taken at the largest transverse diameter, and length measured perpendicular to this plane. Volume was calculated using the ellipsoid estimation formula (V = height x width x length x π / 6), which has been shown to correlate more strongly with tumor volume than many other estimation methods (1)(18).
Ex vivo tumor volume measurements.
MP2 + PCAF implanted animals were sacrificed on the same day of acquiring an ultrasound scan in order to measure tumor volume by calipers and weight. Caliper volume measurements were obtained in the same manner as described above. After euthanization, the tumor was excised and any normal tissue cut away, and the three orthogonal axes measured using electronic slide calipers (Fisher Scientific). Volume was calculated using the same ellipsoid estimation formula (V = height x width x length x π / 6) in order to allow for a direct comparison between caliper and ultrasound volume measurements. Tumor weight was then recorded using an electronic balance.
Statistical analyses.
Results are presented as mean +/− standard error of the mean (SEM), except where noted otherwise. Statistical analysis was performed using GraphPad Prism (GraphPad Software), Matlab, or Microsoft Excel tools. Sample sizes for each data set are indicated in the figure captions. All p values were calculated using two-tailed t-tests.
RESULTS
Comparison between ultrasound, caliper, and tumor weight measurements
Pairwise comparisons between measurement methods were found to correlate strongly between the three modalities (Figure 1a-c). Scatter plots show the best fit line and equation, the 95% confidence band, and correlation coefficient of each comparison. Ultrasound volume correlated well with both caliper volume (r2 = 0.9057) and weight (r2 = 0.8969), while caliper volume and weight correlated strongest (r2=0.9718). These results are consistent with previously reported correlations between caliper and weight measurements (1), and ultrasound and caliper (2). Tumors measuring up to 3000 mm3 are also plotted in 3 dimensions in Figure S1 (see Supporting Information).
Figure 1.

Pairwise comparisons between ultrasound, caliper, and weight measurements of tumors in an orthotopic mouse model of pancreatic cancer. (a-c) Linear regressions and correlation coefficients for each comparison are shown, with 95% confidence bands as dotted lines (n = 45 for each plot). (d-f) Bland-Altman plots for each comparison are plotted by percent difference of the two measurements. Tumors measured to be less than 5 mm3 or 5 mg were excluded as tumors this size were difficult to measure by any method. For comparisons involving weight, a tumor density of 1 g/mL was assumed in order to compare to ultrasound or caliper volume measurements. Bias is denoted by the thick dotted line, and 95% Limits of Agreement as the thin dotted lines. Bias is −36 mm3, −121 mm3, and −85 mm3 for d-f, respectively.
Bland-Altman plots (Figure 1d-f) were used to analyze the agreement between each method. Difference in measured volume was plotted against the average of the two measurements for each tumor. The ultrasound vs caliper volume measurement comparison produced a minimal bias of −36 mm3, with Limits of Agreement (LoA) from −771 mm3 to 699 mm3. Ultrasound vs weight and caliper vs weight comparisons had slightly larger biases of −121 mm3 (LoA from −914 mm3 to 671 mm3), and −85 mm3 (LoA from −478 mm3 to 307 mm3), respectively. It can clearly be seen in each plot that the three measurement modalities agree far better when measuring small tumors than large ones.
Volume measurements correlate more strongly for small tumors than large ones
Caliper and ultrasound volume measurement correlations were analyzed for three size ranges of tumors as shown in Figure 2a: 0–200 mm3, 200–1000 mm3, and 1000–3000 mm3 (determined by ultrasound, n = 16–18 for each size range). Tumors with volumes up to 200 mm3 correlated the strongest (r2 = 0.936), while medium and large ones correlated progressively worse (r2 = 0.674 and 0.342, respectively). This size dependent correlation is also illustrated in Figure 2b, where the correlation coefficient between caliper and ultrasound volume measurements as a function of volume is plotted. Correlation coefficients were calculated by arranging tumors in ascending volume as measured by ultrasound. Beginning with a 50mm3 cutoff value, Pearson’s correlation coefficients were calculated for all tumors above (grey line) and below (black line) the cutoff value, in 10 mm3 increments. Correlation among tumors larger than the cutoff gets progressively worse and more variable as the cutoff size increases, consistent with what it shown in Figure 2a.
Figure 2.
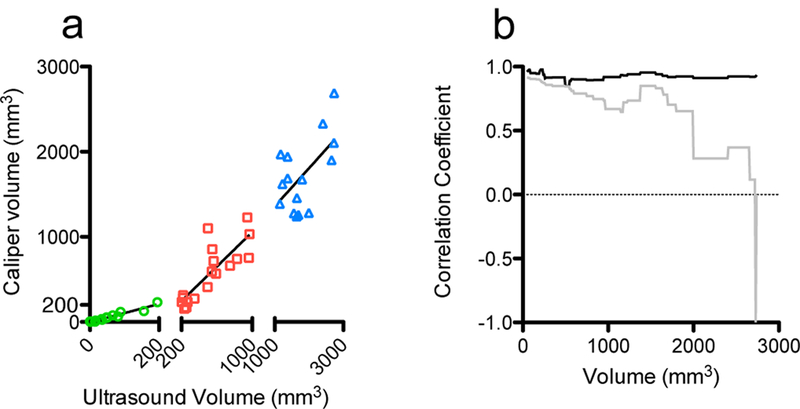
Ultrasound and caliper volume measurements correlate more strongly for small tumors than large ones. (a) Linear regressions and correlation coefficients of tumors in three size intervals (0–200 mm3, 200–1000 mm3, 1000–3000 mm3) are shown (n = 16–18 for each segment). r2= 0.9359, 0.6745, 0.3421 respectively. (b) Correlation coefficients between ultrasound and caliper measurements with volumes below (black) and above (grey) volume cutoffs in 10 mm3 increments (x-axis volumes determined by ultrasound).
Variation of tumor sizes eight days post orthotopic implantation
Mice were implanted orthotopically with MP2 cells over five separate experiments and imaged by ultrasound 8 days post-implantation to analyze the variation of tumors sizes at this early time point. Individual tumors, represented by each bar, are grouped according to their experiment and the volume of each tumor plotted in Figure 3a. The average volume of all tumors at day eight was 36.9 +/− 26.1 mm3 (standard deviation), indicating a high degree of variability among initial tumor growth rates.
Figure 3.

Tumor size variation eight days post MiaPaCa-2 orthotopic implantation. (a) Tumors were implanted in 5 separate batches, each denoted by a different patterned bar. Each bar represents an individual tumor and its volume measured by ultrasound. Dotted lines are 5 mm3 and 65 mm3, and tumors that fell within this range were included in subsequent longitudinal analysis. The black line denotes the size cutoff of 35 mm3 for large and small tumors. (b,c) Separation of tumors into small and large tumor size groups, respectively. Dotted lines represent the cutoff sizes for each group (5–35 mm3 in B, 35–65 mm3 in C). Red lines denote the average size of tumors in that group, 22.3 mm3 for small tumors, and 46.8 mm3 for large tumors.
Animals were randomly assigned to a treatment group at the time of treatment on day 9: untreated (NT), liposomal irinotecan (L-IRI), BPD + hv (PDT), L-IRI + BPD + hv (L-IRI + PDT), and no light controls (BPD – hv and L-IRI + BPD – hv; see supplemental material Figure S2. These groups had similar growth curves compared to NT and L-IRI groups, respectively). Only animals bearing tumors that were between 5 and 65 mm3 at day eight, as indicated by the dotted lines in Figure 3a, were included in subsequent longitudinal analysis. Of the 90 tumors analyzed, 75 fell within this size range. Small tumors were defined as being between 5 mm3 and 35 mm3 on day eight, and large having a volume between 35 mm3 and 65 mm3. The separation into these size groups is based on the average tumor size observed at day 8 in this study (32.4 mm3), as well as studies previously conducted by our group (9,19) and others (20,21) using similar animal models.
The initial sizes of small and large tumors are plotted in Figure 3b-c. Of the 75 tumors that were analyzed, 44 fell within the small range and 31 within the large range. In the small tumor group, the average size was 22.3 +/− 7.5 mm3 (standard deviation). The average large tumor size was 46.8 +/− 9.0 mm3 (standard deviation). Separation into two size ranges and exclusion of outliers greatly reduced size variability which was important when determining the effect of tumor size on treatment response. The relative standard deviation of all 90 tumors was 70.7%, compared to 33.5% and 19.3% in the small and large tumor groups, respectively, indicating a large reduction in variability upon separation into similarly sized groups, as expected.
Interestingly, large and small untreated tumors (NT) show statistically similar growth curves (Figure S3, see Supporting Information). Despite their significant size differences at day 8 (p < 0.001), both groups quickly converge and grow at similar rates and to similar sizes on day 30. This phenomenon indicates that, in this model, tumor size at an early time point has little effect on subsequent growth if left untreated. For this reason, and due to insufficient animals in the large tumor NT group, subsequent longitudinal NT growth curves are plotted using all untreated animals.
PDT and L-IRI synergize to inhibit growth in large tumors
Representative cross-sectional images of tumors in PDT treatment groups at day 8 and day 30 post-implantation, when this study was terminated, can be seen in Figure 4. At 9 days post-implantation, animals were randomly assigned to each treatment group (NT, L-IRI, PDT, L-IRI+PDT combination), and growth curves for each regimen are plotted in Figure 5a-b.
Figure 4.
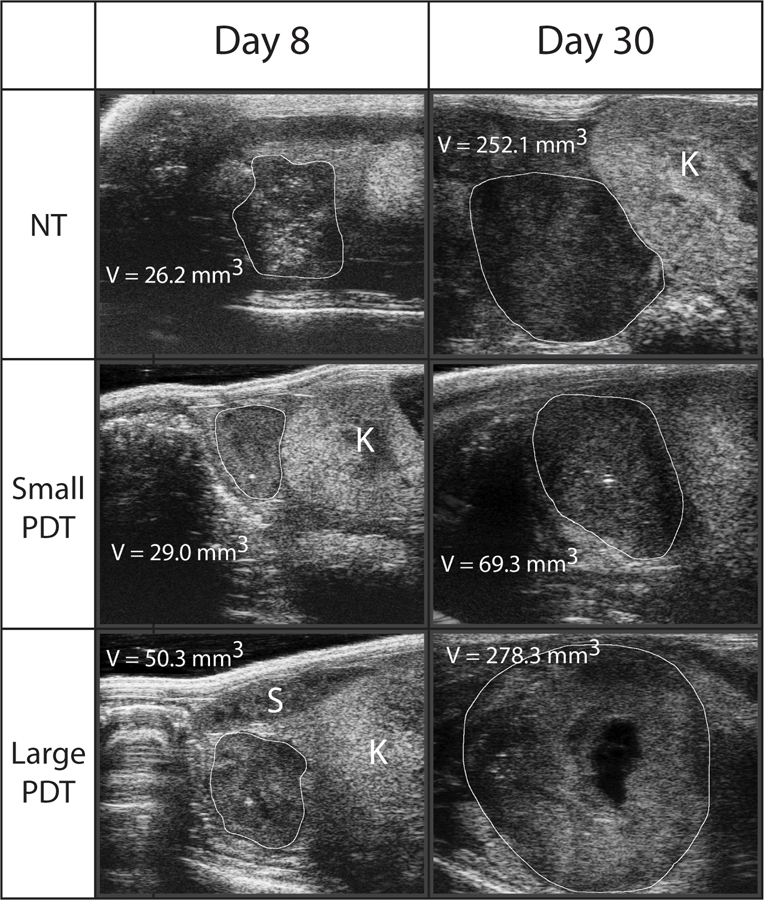
Representative ultrasound images of tumors at day 8 and 30. Transverse ultrasound images are shown and were identified as being the largest cross-sectional area of the tumor, from which an orthogonal length measurement was made. Volume estimations were made from these three measurements as described. The tumor margins are identified by the white line and kidney (K) and spleen (S) identified in the images where possible. Necrosis can be seen in the PDT treated tumor at day 30, a common feature of large tumors in this model.
Figure 5.
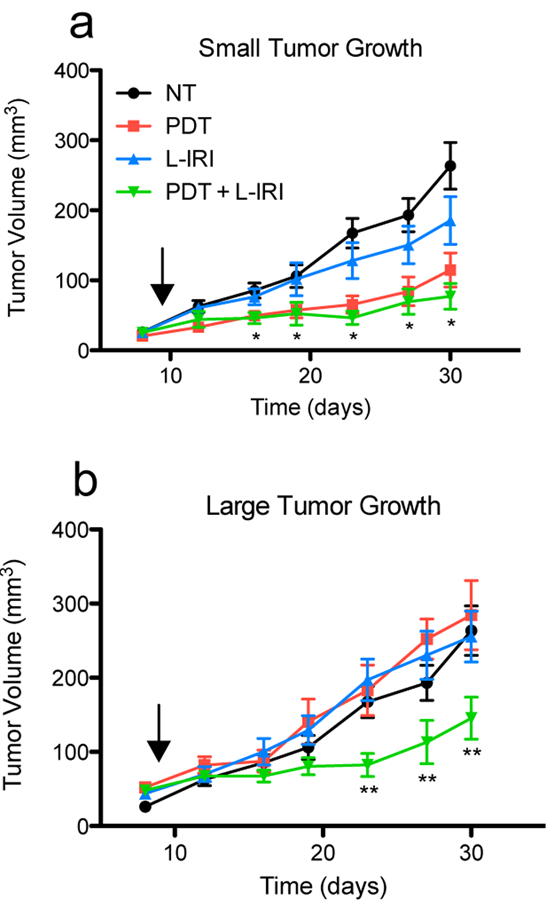
Small tumors respond better to PDT and L-IRI than large tumors. (a) PDT and PDT + L-IRI combination significantly inhibit growth of small tumors for 3 weeks after treatment. (b) Monotherapies are ineffective in large tumors; however, the combination still shows significant efficacy. Arrows indicate day of treatment (day nine). Mean tumor volume and s.e.m. are plotted longitudinally. (n = 5–14, * P<0.05 for PDT and combination vs NT, ** P<0.05 for combination vs NT, two-tailed t-tests).
In small tumors, both PDT alone and the combination inhibited cancer progression to a similar degree while L-IRI alone produced a small, non-statistically significant size reduction (p=0.12 at day 30), suggesting that PDT is the primary driver of treatment response for small tumors. In contrast, PDT has no effect on large tumors in this model. Similar tumor nodule size dependent responses to PDT have previously been shown in vitro by West (22). Here, the differences in growth of large and small PDT treated tumors are statistically significant at all time points (except day 16; p = 0.051), suggesting that the anti-cancer effects of PDT on small tumors occur within a couple of days. The immediate therapeutic effects of PDT in vivo have been shown before in orthotopic models of pancreatic cancer, in which acute tumor inflammation was observed 48 hours after PDT (10). As in the case with PDT, large tumors showed no response to monotherapy L-IRI. In combination treated tumors, we observed a non-statistically significant reduction in size between large and small tumors, from 147 mm3 to 77 mm3 (p=0.064). This treatment controlled both tumor sizes in a similar manner, however, as those in both groups grew 3-fold by day 30 compared their size at the time of treatment. Our group has previously demonstrated the synergistic effects of PDT and L-IRI in this tumor model, which is attributable to their distinct mechanisms of action and their ability to block critical survival pathways (9).The analysis presented here further confirms the complementary effects of these two therapies, revealing enhanced synergy and reinforcing the importance of mechanistically-based combination therapies especially in larger, difficult to treat tumors.
DISCUSSION
While a number of different metrics are used to quantify treatment efficacy in preclinical in vivo studies, this is commonly done by monitoring change in tumor size. Measuring size, either by volume or weight, only at the end of the study period is often sufficient to accomplish this. However, this approach may fail to reveal subtle yet important biological characteristics that may impact treatment response. As a result, these often overlooked variables, such as tumor size at the time of treatment, may skew interpretation of experimental results, and possibly contribute to the high failure rate of many investigational therapies in the clinic despite their significant promise and efficacy demonstrated preclinically (23). Analysis of metrics in preclinical in vivo studies such as tumor growth rate and time- and size-dependent response to treatment, which can be readily evaluated in longitudinal studies such as this one, may allow researchers to draw more comprehensive conclusions about a particular investigational therapy in order to better inform how or if to translate to the clinic. Needless to say, it is important to mimic human disease as closely as possible in preclinical in vivo studies. To this end, orthotopic and GEM models have gained attention over the years due to their predictive value of therapeutic efficacy in human disease and use in studying the effect of specific genetic mutations on treatment response (24). In these models where the tumor is located internally, however, sophisticated imaging modalities, such as ultrasound, must be used to non-invasively and longitudinally quantify tumor size.
Regardless of imaging modality, it is imperative to ensure its accuracy and reliability when taking measurements. The use of ultrasound to measure volumes of biological structures has been studied extensively due to its pervasive use preclinically and clinically to visualize internal organs, make diagnoses, and monitor treatment progress in many fields of medicine. Volume measurements are generally obtained either by 3D volume reconstruction, or by measuring the length of three orthogonal axes to estimate volume. A number of studies have demonstrated that volume reconstruction is more accurate at determining the true tumor volume than estimation methods (25–27); however, this is a much more involved process and takes far longer than estimation calculations and is therefore impractical to do for large cohorts in preclinical studies. In most cases, particularly when measuring regularly shaped ellipsoidal tumors, the difference in accuracy between volume reconstruction and estimation is minimal (8,25), and the practicality of volume estimation warrants its use.
As demonstrated in Figure 1, both ultrasound (1b) and caliper (1c) based volume estimations correlate strongly with tumor weight over a large range of sizes in MP2 + PCAF co-culture tumors. Fibroblasts (PCAF) are known to play an important role in pancreatic cancer, and the addition of this cell line to pancreatic tumors in vivo has recently been shown to more closely mimic human disease (17). In these tumors, extensive collagen deposition and increased biochemical signaling between cell types were observed, which limits drug penetration and promotes metastases and epithelial-mesenchymal transition, two significant barriers to pancreatic cancer therapy in the clinic. In these experiments, we found that MP2 + PCAF tumors grew to an average of 156 mm3, while the MP2 alone ones grew to 264 mm3. We hypothesize the formation of smaller tumors may be due to a number of factors. The addition of PCAFs may promote the growth of denser, more compact tumors, and may further lead to poor vascularization and delivery of nutrients required for cellular proliferation. Additionally, PCAFs in vivo may have a slower growth rate than primary MP2 cells, leading to fewer cells and a smaller tumor overall.
Despite these observed differences in tumor models, ultrasound and caliper volume measurements correlate well in this co-culture model (Figure 1a), indicating that the addition of fibroblasts does not significantly impact the ability to monitor these tumors by ultrasound. This agreement can also be seen in the Bland-Altman plots (Figure 1d-f), particularly at small tumor volumes, while larger ones agree progressively worse. We believe that this is due to the difficulty of accurately estimating the volume of larger, more advanced tumors in these types of models, where tumors tend to grow around and into nearby organs (28) and form necrotic cores due to poor vascularization (29,30), an example of which can be seen in Figure 4 in the large PDT treated tumor at day 30. This is further supported by the size-dependent correlations between caliper and ultrasound measurements in Figure 2a. Smaller tumors, which are usually more regularly shaped and easier to image and measure, correlate very well, while large ones correlate very poorly. While this may be partly due to the smaller size range of the small tumors (0–200 mm3) compared to large tumor range (1000–3000 mm3), it is consistent with our observations that large advanced tumors often grow in irregular shapes, making them more difficult to measure. Future studies that involve more animals and analysis with finer, equal size ranges would further strengthen this conclusion. Regardless, these observations suggest that the method used to measure tumors is particularly important for larger ones. The added complexity of quantifying irregularly shaped and large tumors makes their accurate measurement more difficult, and the decision of which modality or technique to use, for example 3D volume reconstruction versus ellipsoidal volume estimation, becomes more important as it is more likely to influence results. Thus, for smaller tumors, where caliper and ultrasound correlate very strongly, the method used to measure tumors is less important in terms of reproducibility and accuracy than in large ones.
Despite these limitations of volume estimation using ultrasound, it is still an appropriate modality to measure and analyze tumors, particularly in longitudinal studies where non-invasive imaging is required. In a demonstration of the biological insights that this technique can provide, we analyzed variations in tumor volume in orthotopically implanted animals and the subsequent tumor size-dependent response to PDT and irinotecan treatments. This kind of study would be impossible to conduct using weight or calipers to quantify tumor size in this model because these modalities would require the animal to be sacrificed upon the first measurement, precluding the possibility of subsequent growth monitoring. Even in conventional longitudinal treatment response studies, ultrasound is far superior from a financial and time perspective over the use of calipers or weight (Table S1, see Supporting Information). While analysis of ultrasound images, involving selection of three appropriate orthogonal tumor axes, is a bit more complicated and time consuming than simply weighing the tumor, the additional biological information that can be gained and high-throughput capacity warrants its use in many cases. Ultrasound also has significant advantages over other imaging modalities, such as MRI or CT, due to its lower complexity and cost and high throughput capacities described above.
At 8 days post implantation, we analyzed the variation in pancreatic tumor volume (Figure 3a). Even in tumor models that are highly tumorigenic, variation in growth rates of individual tumors similar to those observed in this study is common (31,32). This phenomenon is likely due to the complexity of surgical implantation procedures and disease and mouse heterogeneity. In order to confirm that this observation is due to actual tumor size variation among mice and not simply an artifact of uncertainty in the measurement modality itself, we examined the intraperson variability associated with ultrasound volume estimation (Figure S4). Three independent ultrasound measurements of a single tumor taken by the same investigator revealed an average volume measurement of 142.9 mm3 and standard error or the mean of 6.0 mm3. This small error indicates that the large range of tumor sizes seen in Figure 3 is not simply due to uncertainty associated with the ultrasound measurement itself, an observation which compelled us to examine the effect of this initial tumor size variability on treatment outcomes of two therapeutic modalities: PDT and liposomal irinotecan.
PDT and irinotecan have been studied extensively in animal models and both are used clinically. PDT is currently approved for a number of indications, including skin, head and neck, and bladder cancer, among others. BPD based PDT is also under investigation in clinical trials for locally advanced pancreatic cancer (33). Liposomal irinotecan (Onivyde®), similar to the formulation used in this study, is approved for the treatment for metastatic pancreatic cancer. Although Onivyde is safer and more effective than non-liposomal irinotecan, significant adverse side effects are still common and can require dose de-escalation or discontinuation of treatment. Therefore, strategies to reduce the administered dose while maintaining or improving efficacy would be very beneficial to patients. Previous work by our group has demonstrated that the photodynamic priming of tumors prior to the administration of low dose liposomal irinotecan is highly synergistic (9). The effects of tumor size on response to the monotherapies and their combination is explored here in more detail.
The separation of tumors into small and large groups illuminates the distinct size-dependent therapeutic efficacy of PDT in this model, which can be attributed to a number of causes. Light scattering properties of tissue limit the effective depth penetration of 690 nm light to several millimeters (34). Spherical tumors with a volume of 65 mm3 (the largest in this study at the time of PDT treatment) have a diameter of 5 mm, suggesting that the entire tumor may not receive the full light dose. Larger tumors have also been shown to be more hypoxic than smaller ones (35,36). BPD-PDT requires the presence of molecular oxygen to efficiently generate singlet oxygen and induce cytotoxicity, and tumor response to PDT has been demonstrated to be highly dependent on tissue oxygenation (37). The dense stroma and immature vascular development commonly seen in pancreatic tumors has also been implicated in reduced drug delivery and therapeutic efficacy (38). Despite these challenges, this combination of PDT and liposomal irinotecan is still effective in large tumors even when the monotherapies fail. Photodynamic priming of tumors has been previously shown by our group to improve drug penetration into pancreatic tumors (39). This rationally designed combination is also mechanistically cooperative, as PDT and irinotecan each block survival pathways stimulated by the other therapy (9,39). The results described in this work indicate that this synergy is especially enhanced in larger tumors, and suggests that disease treated with the right combination of therapies may respond well even if those particular monotherapies are ineffective.
Size-dependent treatment response has been previously reported across a range of therapeutic modalities, disease models, and tumor sizes (40–42), suggesting that this phenomenon is not unique to optical modalities. In a pointed example, De Jong et al. found that rats bearing a subcutaneous pancreatic tumor with a size between 3–9 cm2 had complete disease response to a single targeted radionuclide treatment, while no more than half of those with larger or smaller tumors responded similarly (43). Given that, both clinically and preclinically, patients with larger disease burden/tumor size generally carry more advanced disease and a correspondingly poorer prognosis, insights obtained by using initial tumor size as a metric for disease progression indicate that opportunities may exist to further optimize treatments based on this disease parameter. More generally, the study presented herein reiterates the importance of considering and controlling for tumor size, and other potentially hidden biological variables, in preclinical in vivo studies in order to draw more meaningful conclusions, and evaluation of investigational therapies on a range of tumor sizes may assist researchers in the drug development process.
Supplementary Material
ACKNOWLEDGEMENTS
This work was conducted with support from the Photopathology Center of the Wellman Center for Photomedicine, Massachusetts General Hospital. This work was supported by National Institutes of Health Grants P01CA084203 (Hasan), S10ODO1232601 (Hasan), K99CA194269 (Huang), R00CA194269 (Huang), and F32CA165881 (Mallidi). Anbil was supported by the HHMI Medical Research Fellows program.
Footnotes
This article is part of a Special Issue celebrating Photochemistry and Photobiology’s 55th Anniversary.
REFERENCES
- (1).Tomayko MM, Reynolds CP, (1989) Determination of subcutaneous tumor size in athymic (nude) mice, Cancer Chemother. Pharmacol 24, 148–154. [DOI] [PubMed] [Google Scholar]
- (2).Faustino-Rocha A, Oliveira PA, Pinho-Oliveira J, Teixeira-Guedes C, Soares-Maia R, da Costa RG, Colaço B, Pires MJ, Colaço J, Ferreira R, Ginja M, (2013) Estimation of rat mammary tumor volume using caliper and ultrasonography measurements, Lab Anim. (NY) 42, 217–224. [DOI] [PubMed] [Google Scholar]
- (3).Cheung AMY, Brown AS, Hastie LA, Cucevic V, Roy M, Lacefield JC, Fenster A, Foster FS, (2005) Three-dimensional ultrasound biomicroscopy for xenograft growth analysis, Ultrasound Med. Biol 31, 865–70. [DOI] [PubMed] [Google Scholar]
- (4).Snyder CS, Kaushal S, Kono Y, Tran Cao HS, Hoffman RM, Bouvet M, (2009) Complementarity of ultrasound and fluorescence imaging in an orthotopic mouse model of pancreatic cancer, BMC Cancer 9, 106. [DOI] [PMC free article] [PubMed] [Google Scholar]
- (5).Katz MH, Takimoto S, Spivack D, Moossa AR, Hoffman RM, Bouvet M, (2003) A Novel Red Fluorescent Protein Orthotopic Pancreatic Cancer Model for the Preclinical Evaluation of Chemotherapeutics, J. Surg. Res 113, 151–160. [DOI] [PubMed] [Google Scholar]
- (6).Paroo Z, Bollinger RA, Braasch DA, Richer E, Corey DR, Antich PP, Mason RP, (2004) Validating Bioluminescence Imaging as a High-Throughput, Quantitative Modality for Assessing Tumor Burden, Mol. Imaging 3, 117–124. [DOI] [PubMed] [Google Scholar]
- (7).Schmidt KF, Ziu M, Ole Schmidt N, Vaghasia P, Cargioli TG, Doshi S, Albert MS, Black PM, Carroll RS, Sun Y, (2004) Volume Reconstruction Techniques Improve the Correlation Between Histological and in vivo Tumor Volume Measurements in Mouse Models of Human Gliomas, J. Neurooncol 68, 207–215. [DOI] [PubMed] [Google Scholar]
- (8).Ayers GD, McKinley ET, Zhao P, Fritz JM, Metry RE, Deal BC, Adlerz KM, Coffey RJ, Manning HC, (2010) Volume of Preclinical Xenograft Tumors Is More Accurately Assessed by Ultrasound Imaging Than Manual Caliper Measurements, J. Ultrasound Med 29, 891–901. [DOI] [PMC free article] [PubMed] [Google Scholar]
- (9).Huang H-C, Mallidi S, Liu J, Chiang C-T, Mai Z, Goldschmidt R, Ebrahim-Zadeh N, Rizvi I, Hasan T, (2016) Photodynamic Therapy Synergizes with Irinotecan to Overcome Compensatory Mechanisms and Improve Treatment Outcomes in Pancreatic Cancer, Cancer Res 76, 1066–77. [DOI] [PMC free article] [PubMed] [Google Scholar]
- (10).Samkoe KS, Chen A, Rizvi I, O’Hara JA, Hoopes PJ, Pereira SP, Hasan T, Pogue BW, (2010) Imaging tumor variation in response to photodynamic therapy in pancreatic cancer xenograft models, Int. J. Radiat. Oncol. Biol. Phys 76, 251–9. [DOI] [PMC free article] [PubMed] [Google Scholar]
- (11).Deer EL, González-Hernández J, Coursen JD, Shea JE, Ngatia J, Scaife CL, Firpo MA, Mulvihill SJ, (2010) Phenotype and genotype of pancreatic cancer cell lines, Pancreas 39, 425–35. [DOI] [PMC free article] [PubMed] [Google Scholar]
- (12).Mallidi S, Watanabe K, Timerman D, Schoenfeld D, Hasan T, (2015) Prediction of tumor recurrence and therapy monitoring using ultrasound-guided photoacoustic imaging, Theranostics 5, 289–301. [DOI] [PMC free article] [PubMed] [Google Scholar]
- (13).Browder T, Butterfield CE, Kräling BM, Shi B, Marshall B, O ‘Reilly MS, Folkman J, (2000) Antiangiogenic Scheduling of Chemotherapy Improves Efficacy against Experimental Drug-resistant Cancer, Cancer Res 60, 1878–1886. [PubMed] [Google Scholar]
- (14).Eisenhauer EA, Therasse P, Bogaerts J, Schwartz LH, Sargent D, Ford R, Dancey J, Arbuck S, Gwyther S, Mooney M, Rubinstein L, Shankar L, Dodd L, Kaplan R, Lacombe D, Verweij J, (2009) New response evaluation criteria in solid tumours: Revised RECIST guideline (version 1.1), Eur. J. Cancer 45, 228–247. [DOI] [PubMed] [Google Scholar]
- (15).Rehemtulla A, Stegman LD, Cardozo SJ, Gupta S, Hall DE, Contag CH, Ross BD, (2000) Rapid and Quantitative Assessment of Cancer Treatment Response Using In Vivo Bioluminescence Imaging, Neoplasia 2, 491–495. [DOI] [PMC free article] [PubMed] [Google Scholar]
- (16).Euhus DM, Hudd C, LaRegina MC, Johnson FE, (1986) Tumor measurement in the nude mouse, J. Surg. Oncol 31, 229–34. [DOI] [PubMed] [Google Scholar]
- (17).Waghray M, Yalamanchili M, Dziubinski M, Zeinali M, Erkkinen M, Yang H, Schradle KA, Urs S, Pasca Di Magliano M, Welling TH, Palmbos PL, V Abel E, Sahai V, Nagrath S, Wang L, Simeone DM, (2016) GM-CSF Mediates Mesenchymal-Epithelial Cross-talk in Pancreatic Cancer, Cancer Discov 6, 886–99. [DOI] [PMC free article] [PubMed] [Google Scholar]
- (18).Busch TM, Xing X, Yu G, Yodh A, Wileyto EP, Wang H-W, Durduran T, Zhu TC, Wang KK-H, (2009) Fluence rate-dependent intratumor heterogeneity in physiologic and cytotoxic responses to Photofrin photodynamic therapy., Photochem. Photobiol. Sci 8, 1683–93. [DOI] [PMC free article] [PubMed] [Google Scholar]
- (19).Spring BQ, Bryan Sears R, Zheng LZ, Mai Z, Watanabe R, Sherwood ME, Schoenfeld DA, Pogue BW, Pereira SP, Villa E, Hasan T, (2016) A photoactivable multi-inhibitor nanoliposome for tumour control and simultaneous inhibition of treatment escape pathways, Nat. Nanotechnol 11, 378–87. [DOI] [PMC free article] [PubMed] [Google Scholar]
- (20).Ziske C, Tiemann K, Schmidt T, Nagaraj S, Märten A, Schmitz V, Clarenbach R, Sauerbruch T, Schmidt-Wolf IGH, (2008) Real-Time High-Resolution Compound Imaging Allows Percutaneous Initiation and Surveillance in an Orthotopic Murine Pancreatic Cancer Model, Pancreas 36, 146–152. [DOI] [PubMed] [Google Scholar]
- (21).Kotopoulis S, Delalande A, Popa M, Mamaeva V, Dimcevski G, Helge Gilja O, Postema M, Tore Gjertsen B, McCormack E, (2013) Sonoporation-Enhanced Chemotherapy Significantly Reduces Primary Tumour Burden in an Orthotopic Pancreatic Cancer Xenograft, Mol Imaging Biol 16, 53–62. [DOI] [PubMed] [Google Scholar]
- (22).West CML, (1989) Size-dependent resistance of human tumour spheroids to photodynamic treatment, Br. J. Cancer 59, 510–514. [DOI] [PMC free article] [PubMed] [Google Scholar]
- (23).Lowenstein PR, Castro MG, (2009) Uncertainty in the translation of preclinical experiments to clinical trials. Why do most phase III clinical trials fail?, Curr. Gene Ther 9, 368–74. [DOI] [PMC free article] [PubMed] [Google Scholar]
- (24).Talmadge JE, Singh RK, Fidler IJ, Raz A, (2007) Murine models to evaluate novel and conventional therapeutic strategies for cancer, Am. J. Pathol 170, 793–804. [DOI] [PMC free article] [PubMed] [Google Scholar]
- (25).Riccabona M, Nelson TR, Pretorius DH, (1996) Three-dimensional ultrasound: accuracy of distance and volume measurements, Ultrasound Obstet. Gynecol 7, 429–434. [DOI] [PubMed] [Google Scholar]
- (26).Partik BL, Stadler A, Schamp S, Koller A, Voracek M, Heinz G, Helbich TH, (2002) 3D versus 2D ultrasound: accuracy of volume measurement in human cadaver kidneys, Invest. Radiol 37, 489–95. [DOI] [PubMed] [Google Scholar]
- (27).Yaman C, Jesacher K, Pölz W, (2003) Accuracy of three-dimensional transvaginal ultrasound in uterus volume measurements; comparison with two-dimensional ultrasound, Ultrasound Med. Biol 29, 1681–1684. [DOI] [PubMed] [Google Scholar]
- (28).Fu X, Guadagnit F, Hoffman RM, (1992) A metastatic nude-mouse model of human pancreatic cancer constructed orthotopically with histologically intact patient specimens, Med. Sci 89, 5645–5649. [DOI] [PMC free article] [PubMed] [Google Scholar]
- (29).Libermann TA, Razon N, Bartal AD, Yarden Y, Schlessinger J, Soreq H, (1984) Expression of Epidermal Growth Factor Receptors in Human Brain Tumors, Cancer Res 44, 753–760. [PubMed] [Google Scholar]
- (30).Deng J, Rhee TK, Sato KT, Salem R, Haines K, Paunesku T, Mulcahy MF, Miller FH, Omary RA, Larson AC, (2006) In Vivo Diffusion-Weighted Imaging of Liver Tumor Necrosis in the VX2 Rabbit Model at 1.5 Tesla, Invest. Radiol 41, 410–414. [DOI] [PubMed] [Google Scholar]
- (31).Huynh AS, Abrahams DF, Torres MS, Baldwin MK, Gillies RJ, Morse DL, Castro MG, (2011) Development of an Orthotopic Human Pancreatic Cancer Xenograft Model Using Ultrasound Guided Injection of Cells, PLoS One 6, e20330. [DOI] [PMC free article] [PubMed] [Google Scholar]
- (32).Hermann PC, Huber SL, Herrler T, Aicher A, Ellwart JW, Guba M, Bruns CJ, Heeschen C, (2007) Distinct Populations of Cancer Stem Cells Determine Tumor Growth and Metastatic Activity in Human Pancreatic Cancer, Cell Stem Cell 1, 313–323. [DOI] [PubMed] [Google Scholar]
- (33).Huggett MT, Jermyn M, Gillams A, Illing R, Mosse S, Novelli M, Kent E, Bown SG, Hasan T, Pogue BW, Pereira SP, (2014) Phase I/II study of verteporfin photodynamic therapy in locally advanced pancreatic cancer, Br. J. Cancer 110, 1698–1704. [DOI] [PMC free article] [PubMed] [Google Scholar]
- (34).Mallidi S, Anbil S, Bulin A-L, Obaid G, Ichikawa M, Hasan T, (2016) Beyond the Barriers of Light Penetration: Strategies, Perspectives and Possibilities for Photodynamic Therapy, Theranostics 6, 2458–2487. [DOI] [PMC free article] [PubMed] [Google Scholar]
- (35).Stanley JA, Shipley WU, Steel GG, (1977) INFLUENCE OF TUMOUR SIZE ON HYPOXIC FRACTION AND THERAPEUTIC SENSITIVITY OF LEWIS LUNG TUMOUR, Br. J. Cancer 36,. [DOI] [PMC free article] [PubMed] [Google Scholar]
- (36).Milross CG, Tucker SL, Mason KA, Hunter NR, Peters LJ, Milas L, to C, Milross MB CG, Fracr B, (1997) The Effect of Tumor Size on Necrosis and Polarographically Measured p 0 2, Acta Oncol Vol. 36, 183–189. [DOI] [PubMed] [Google Scholar]
- (37).Henderson BW, Gollnick SO, Snyder JW, Busch TM, Kousis PC, Cheney RT, Morgan J, (2004) Choice of Oxygen-Conserving Treatment Regimen Determines the Inflammatory Response and Outcome of Photodynamic Therapy of Tumors, Cancer Res 64, 2120–2126. [DOI] [PubMed] [Google Scholar]
- (38).Neesse A, Michl P, Frese KK, Feig C, Cook N, Jacobetz MA, Lolkema MP, Buchholz M, Olive KP, Gress TM, Tuveson DA, (2011) Stromal biology and therapy in pancreatic cancer, Gut 60, 861–868. [DOI] [PubMed] [Google Scholar]
- (39).Huang H-C, Rizvi I, Liu J, Anbil S, Kalra A, Lee H, Baglo Y, Paz N, Hayden D, Pereira S, Pogue BW, Fitzgerald J, Hasan T, (2018) Photodynamic Priming Mitigates Chemotherapeutic Selection Pressures and Improves Drug Delivery, Cancer Res 78, 558–571. [DOI] [PMC free article] [PubMed] [Google Scholar]
- (40).Schiffer IB, Gebhard S, Heimerdinger CK, Heling A, Hast J, Wollscheid U, Seliger B, Tanner B, Gilbert S, Beckers T, Baasner S, Brenner W, Spangenberg C, Prawitt D, Trost T, Schreiber WG, Zabel B, Thelen M, Lehr H-A, Oesch F, Hengstler JG, (2003) Switching Off HER-2/neu in a Tetracycline-Controlled Mouse Tumor Model Leads to Apoptosis and Tumor-Size-Dependent Remission, Cancer Res 63, 7221–7231. [PubMed] [Google Scholar]
- (41).O’Donoghue JA, Bardies M, Wheldon TE, (1995) Relationships between Tumor Size and Curability for Uniformly Targeted Therapy with Beta-Emitting Radionuclides, J. Nucl. Med 36, 1902–1090. [PubMed] [Google Scholar]
- (42).Sun X, Vale M, Leung E, Kanwar JR, Gupta R, Krissansen GW, (2003) Mouse B7-H3 induces antitumor immunity, Gene Ther 10, 1728–1734. [DOI] [PubMed] [Google Scholar]
- (43).de Jong M, Breeman WA, Bernard BF, Bakker WH, Visser TJ, Kooij PP, van Gameren A, Krenning EP, (2001) Tumor response after [(90)Y-DOTA(0),Tyr(3)]octreotide radionuclide therapy in a transplantable rat tumor model is dependent on tumor size, J. Nucl. Med 42, 1841–6. [PubMed] [Google Scholar]
Associated Data
This section collects any data citations, data availability statements, or supplementary materials included in this article.