. 2019 Nov 26;8:e49898. doi: 10.7554/eLife.49898

Figure 1. Manhattan plot from meta-analysis discovery GWAS (N = 10,115 Europeans) for 78 Euclidean distances between 13 facial landmarks.

Results from meta-analysis of four GWASs in Europeans (N = 10,115), which were separately conducted in RS, TwinsUK, ALSPAC, and PITT for 78 facial shape phenotypes that are displayed in a signal ‘composite’ Manhattan plot at the bottom of the figure. All loci consisting of SNPs reaching study-wide suggestive significance (p<5 × 10−8, red line) were nominated according to the nearby candidate genes in the associated loci, and the top 10 loci were highlighted in colors. The black line indicates study-wide significance after multiple trait correction (p<1.2×10⁻⁹). Novel and previously established face-associated genetic loci were differentiated using colored and gray text, respectively. Annotation of the 13 facial landmarks used to derive the 78 facial phenotypes and the associated facial phenotypes are illustrated in the upper part of the figure.

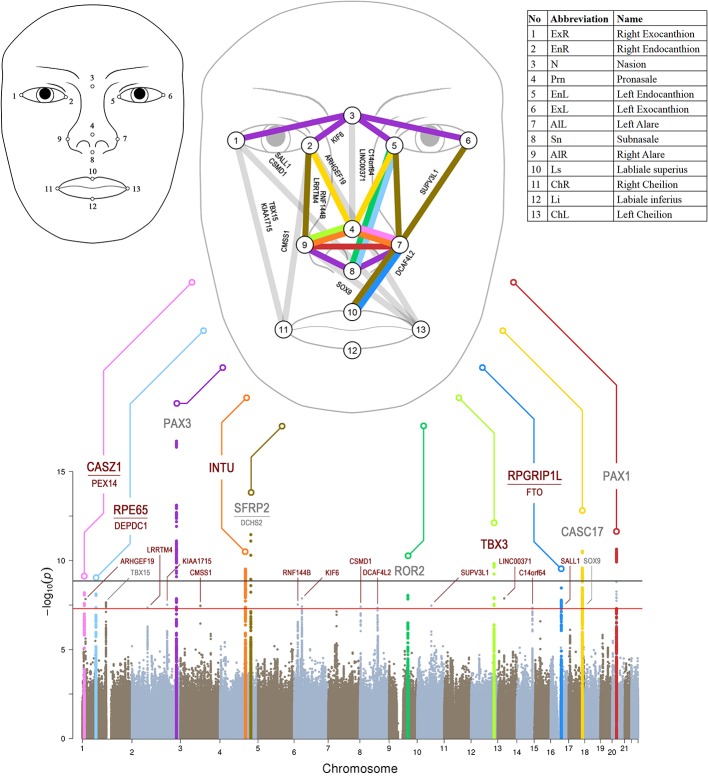
Figure 1.

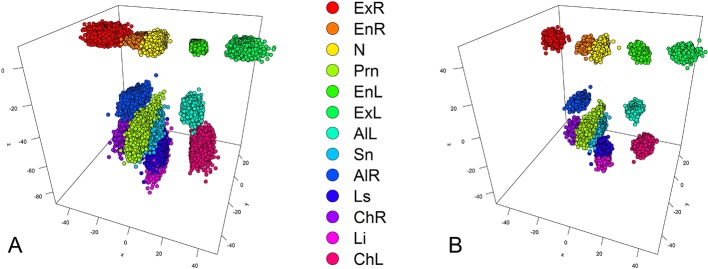
Figure 1—figure supplement 1. An example of GPA, facial landmarks obtained from 3dMD images in 3193 participants from the discovery cohorts RS.

Figure 1—figure supplement 1.

(A) All raw landmarks before GPA process; (B) after GPA process.
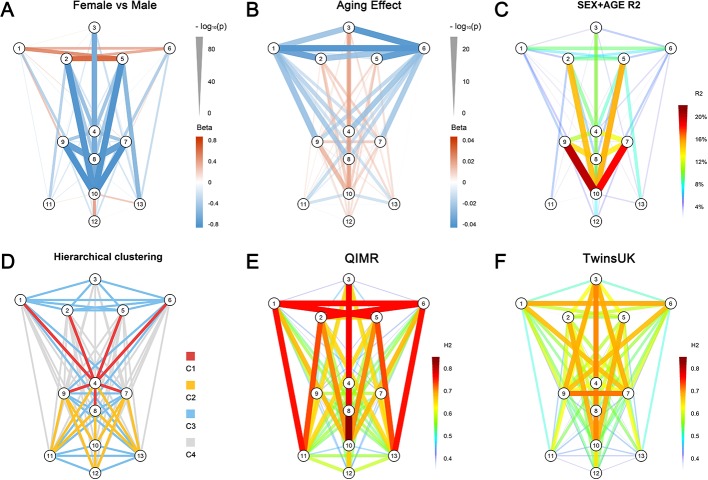
Figure 1—figure supplement 2. Phenotype characteristics of 78 facial traits.

Figure 1—figure supplement 2.

(A) Sex difference (RS, N = 3,193); (B) Aging effect (RS, N = 3,193); (C) Variance explained by sex and age (RS, N = 3,193); (D) Unsupervised hierarchical clustering of phenotype correlation matrix resulted in 4 clusters of phenotypes (RS, N = 3,193); (E) Twins heritability estimates in QIMR (N = 1,101) using 2D frontal photographs; (F) Twins heritability estimates in TwinsUK (N = 1,020) using 3D images.
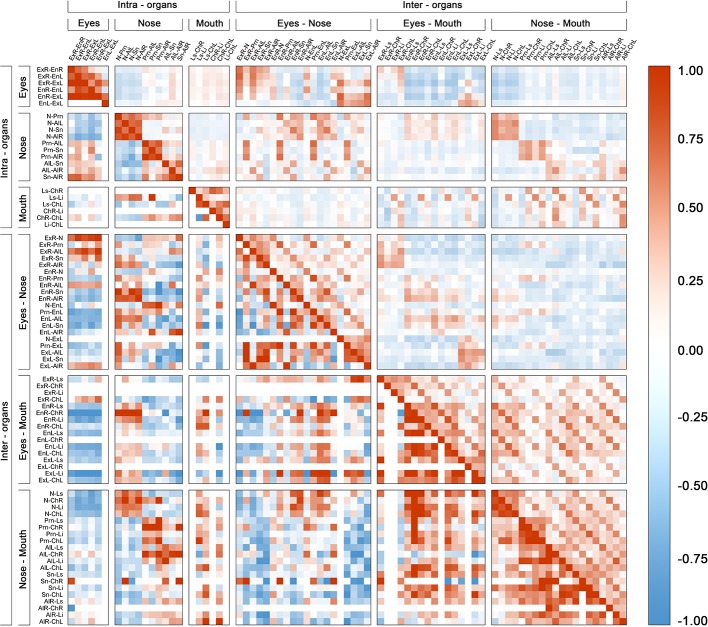
Figure 1—figure supplement 3. Phenotypic and genetic correlation matrix between all facial phenotypes in cohort RS.

Figure 1—figure supplement 3.

Positive correlations are shown as brown squares; Negative correlations are shown as blue squares. Phenotypic correlation is shown above the diagonal and SNP-based genetic correlation is shown below the diagonal. The matrix was organized according to the involvement of intra- and inter- organ landmarks.
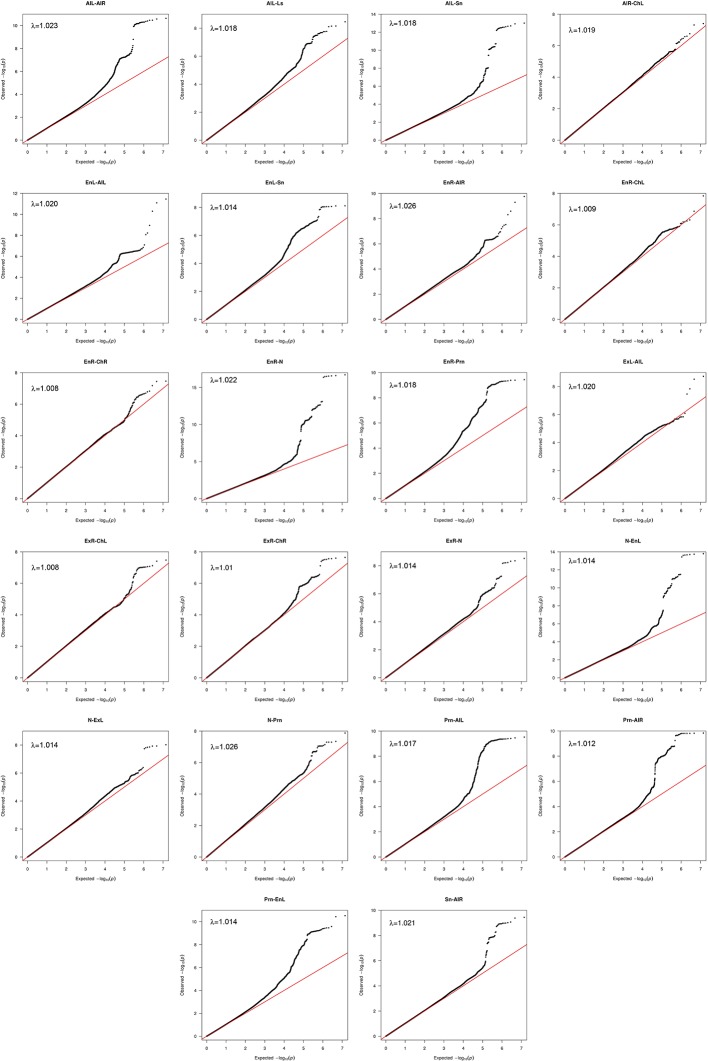
Figure 1—figure supplement 4. Quantile-Quantile plots and genomic inflation factors for 22 significant associated facial traits.

Figure 1—figure supplement 4.

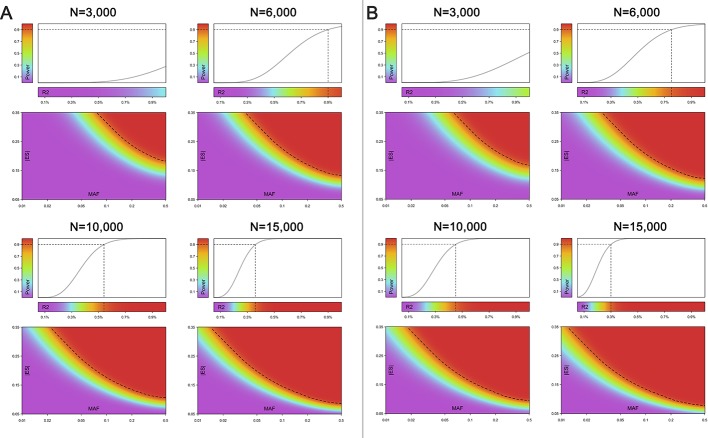
Figure 1—figure supplement 5. Power analysis.

Figure 1—figure supplement 5.

The power of association tests under a variety of sample sizes (N = 3,000, 6,000, 10,000 and 15,000) with varied proportions of explained phenotypic variance (R2), absolute effect size (|ES|) and minor allele frequency (MAF) are investigated at (A) our study-wide significant level (1.2 × 10−9; and (B) our study-wide suggestive significance level (5 × 10−8). Power and R2 are indicated by different colors. The dashed line represents the distribution of 90% power value. For example, under the sample size of 10,000, our study has 90% power to detect suggestive significant SNP explaining at least 0.43% of the phenotypic variance (R2).