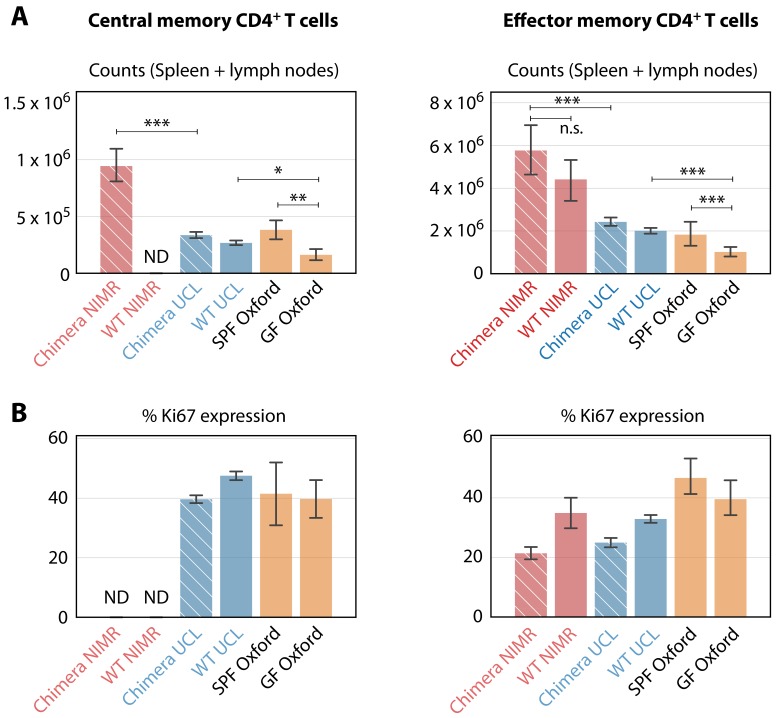
Figure 6. Comparing the numbers and proliferative activity (panels A and B respectively) of CD4+ TCM and TEM in adult mice, in different SPF and GF facilities.
Cross-hatched bars denote busulfan chimeras, solid bars denote WT mice. NIMR (red bars) and UCL (blue bars) are the ‘dirty’ and ‘clean’ facilities used for the bulk of the analysis presented here. ‘ND’ denotes data not available. * p < 0.05, ** p < 0.01, *** p < 0.001, using the Mann-Whitney test. Group sizes: Panels A; (28, 0, 78, 98, 4, 14) and (46, 11, 78, 98, 4, 14). Panels B; (0, 0, 74, 140, 4, 14) and (18, 4, 74, 140, 4, 14).

