Summary Paragraph
Experimental models of the human brain are needed for basic understanding of its development and disease1. Human brain organoids hold unprecedented promise for this purpose; however, they are plagued by high organoid-to-organoid variability2,3. This has raised doubts as to whether developmental processes of the human brain can occur outside the context of embryogenesis with a degree of reproducibility comparable to the endogenous tissue. Here, we show that an organoid model of the dorsal forebrain can achieve reproducible generation of a rich diversity of cell types appropriate for the human cerebral cortex. Using single-cell RNA sequencing of 166,242 cells isolated from 21 individual organoids, we find that 95% of the organoids generate a virtually indistinguishable compendium of cell types, through the same developmental trajectories, and with organoid-to-organoid variability comparable to that of individual endogenous brains. Furthermore, organoids derived from different stem cell lines show consistent reproducibility in the cell types produced. The data demonstrate that reproducible development of complex central nervous system cellular diversity does not require the context of the embryo, and that establishment of terminal cell identity is a highly constrained process that can emerge from diverse stem cell origins and growth environments.
The human brain is composed of a great diversity of cell types, which are generated largely during embryonic development. In vivo, this process is virtually invariant: every embryo acquires the same compendium of cell types, organized into the same anatomical structures1. It is unclear, however, whether the same reproducibility is achievable outside the embryo.
Prior work has shown that a large variety of cell types characteristic of defined brain regions, including the cerebral cortex, can be generated in vitro, within human brain organoid and spheroid models derived from pluripotent stem cells3–14. However, few studies have attempted to quantify cellular composition across individual organoids, limiting our understanding of the degrees of reproducibility achievable within different organoid models.
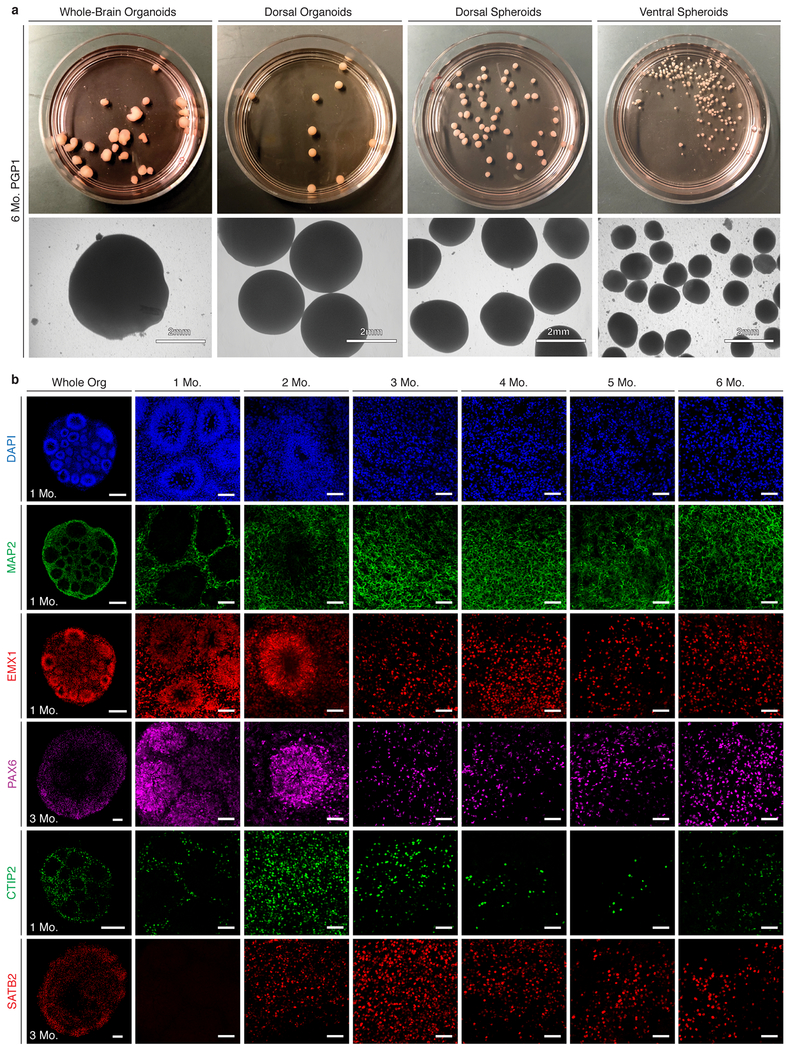
Therefore, we established four distinct protocols for producing 3D brain organoids and spheroids: self-patterned whole-brain organoids3; patterned dorsal forebrain organoids (modified from 5); and patterned dorsal and ventral spheroids (modified from 15). We adapted each protocol to growth in spinner-flask bioreactors over durations of at least 6 months, to achieve advanced maturation (Extended Data Fig. 1a; see Methods for details on protocol modifications).
To standardize and compare these four models, we derived cultures of each from the same hiPSC line, PGP116. We observed substantial differences in overall external morphology and size across models (Extended Data Fig. 1a). Self-patterned whole-brain organoids showed the greatest variability in shape. The two patterned spheroid models showed more consistent shape but remained substantially smaller. The dorsally patterned organoid model, however, showed desirable features of large size and consistent overall shape (Fig. 1a–b and Extended Data Fig. 1a). For this model, we modified the protocol originally published by Kadoshima et al.5 to eliminate the need for interventions to reduce hypoxia by adapting the cultures to growth in spinner-flask bioreactors (Fig. 1a), allowing us to substantially extend development in vitro (Extended Data Fig. 1a). Immunohistochemistry (IHC) for the dorsal forebrain progenitor markers EMX1 and PAX6 and for the early pan-neuronal marker MAP2 confirmed the presence of rosette-like structures at one month, when dorsalized progenitors lined ventricle-like cavities. The cortical pyramidal neuron subtype markers CTIP2 and SATB2 were expressed by 3 months and subsequently maintained (Fig. 1c and Extended Data Fig. 1b). Importantly, we observed these features in the majority of organoids across 5 distinct stem cell lines: PGP1 (male, hiPSC; three independent experimental batches), HUES66 (female, hESC; two independent batches), GM08330 (male, hiPSC), 11a (male, hiPSC), and Mito 210 (male, hiPSC). Across all lines, 100% of organoids expressed PAX6 and MAP2 at 1, 3, and 6 months, and 89% also expressed EMX1 (Extended Data Table 1). Given these promising features, we concentrated further analysis on this model.
Figure 1: Brain organoids cultured for 3 months generate cellular diversity of the human cerebral cortex with high organoid-to-organoid reproducibility.
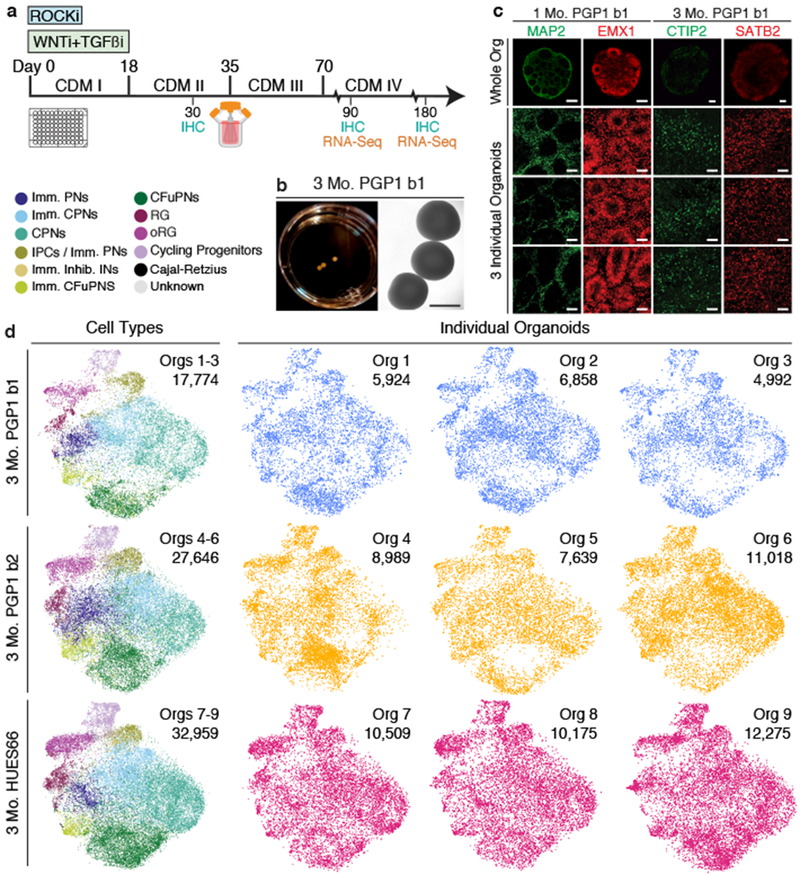
a, Protocol schematic. b, 3 month PGP1 (batch 1: b1) organoids. c, IHC of 1 month PGP1 (b1) organoids for neuronal (MAP2) and dorsal forebrain progenitor (EMX1) markers, and of 3 month PGP1 (b1) organoids for corticofugal projection neuron (CTIP2) and callosal projection neuron (SATB2) markers. Top, entire organoids (scale bar, 200 μm); bottom, high-magnification views of three different organoids per timepoint (scale bar, 50 μm). d, T-distributed stochastic neighbor embedding (t-SNE) plots of scRNA-seq data from 3 month organoids after canonical correlation analysis (CCA) batch correction and alignment (PGP1: two batches, b1, b2; HUES66: one batch, n=3 organoids per batch). Left column, combined organoids from each batch, colored by cell types; right, individual organoids. Number of cells per plot are indicated. PNs, projection neurons; CPNs, callosal PNs; IPCs, intermediate progenitor cells, CFuPNs, corticofugal PNs; INs, interneurons; RG, radial glia; oRG, outer radial glia; Imm., immature; Inhib., inhibitory. Information on replicates for all figures is reported in the Methods under “Statistics and Reproducibility”.
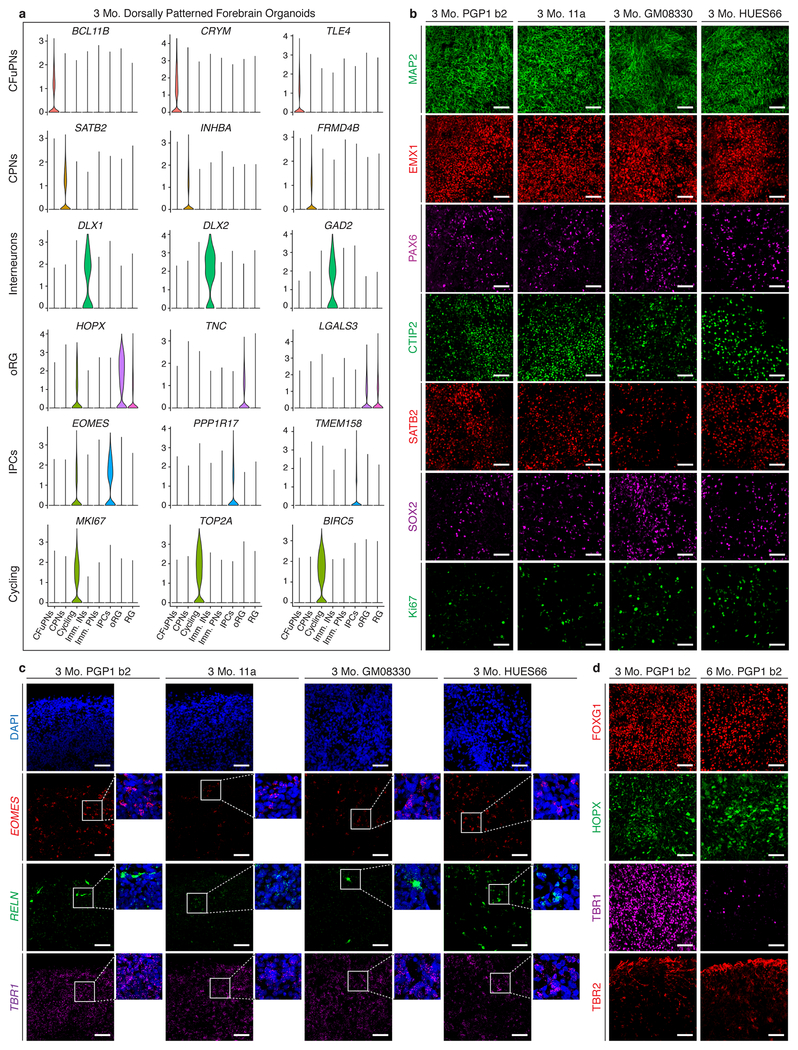
We initially performed high-throughput single cell RNA-seq (scRNA-seq) on 78,379 cells from 9 individual organoids from two stem cell lines, PGP1 (two independent batches, b1 and b2) and HUES66 (one batch), at 3 months of growth (Fig. 1d). For each batch, we clustered cells from all organoids and systematically classified the clusters by comparing signatures of differentially expressed genes (Supplementary Information Table 1, Supplementary Information Note 1) to pre-existing datasets of endogenous cell types3,8,17–23 (examples in Extended Data Fig. 2a). This defined eleven main transcriptionally-distinct cell types across both lines, representing a large diversity of progenitor and neuronal types appropriate for the cerebral cortex (Fig. 1d).
To determine whether each organoid had generated the complete set of cells, we aligned and co-clustered the cells from all 9 organoids (Fig. 1d). We found that organoids were highly reproducible in cellular composition across different lines and batches (Fig. 1d). Furthermore, the cell type assignments from the batch-by-batch analysis were grouped together by the co-clustering analysis, indicating consistent transcriptional signatures for individual cell types across lines and batches. Although one organoid (Org 4) had an increased number of corticofugal projection neurons, the overall proportions of individual cell types were consistent across cell lines (see also Extended Data Fig. 5A). Expression of cell type-specific markers assayed by IHC and RNA in situ hybridization showed equally high consistency (Extended Data Fig. 2b–d). These organoids not only produce a large variety of cortical cell types, but cell identity and diversity are reproducible organoid-to-organoid and across experiments.
Cellular diversity of the cerebral cortex develops in a specific temporal sequence23,24. Astroglial cells, which are typically produced later in development, were notably under-represented in the 3-month cultures. Therefore, we grew organoids from the PGP1, GM08330, and 11a stem cell lines for six months and performed scRNA-seq of an additional 87,863 cells from 12 individual organoids (PGP1: two independent batches, b1 and b3; GM08330 and 11a: one batch) (Fig. 2a). One out of the 12 organoids did not show expression of FOXG1 or any other neuronal marker, suggesting that differentiation had stalled at an early stage. Therefore, we excluded this organoid from further analysis. Co-clustering of all cells in the remaining 11 organoids identified thirteen main cell classes (Fig. 2a). Importantly, organoid-to-organoid variability remained extremely low even after 6 months of culture.
Figure 2: Brain organoids cultured for 6 months show increased cortical cell diversity while maintaining high organoid-to-organoid reproducibility.
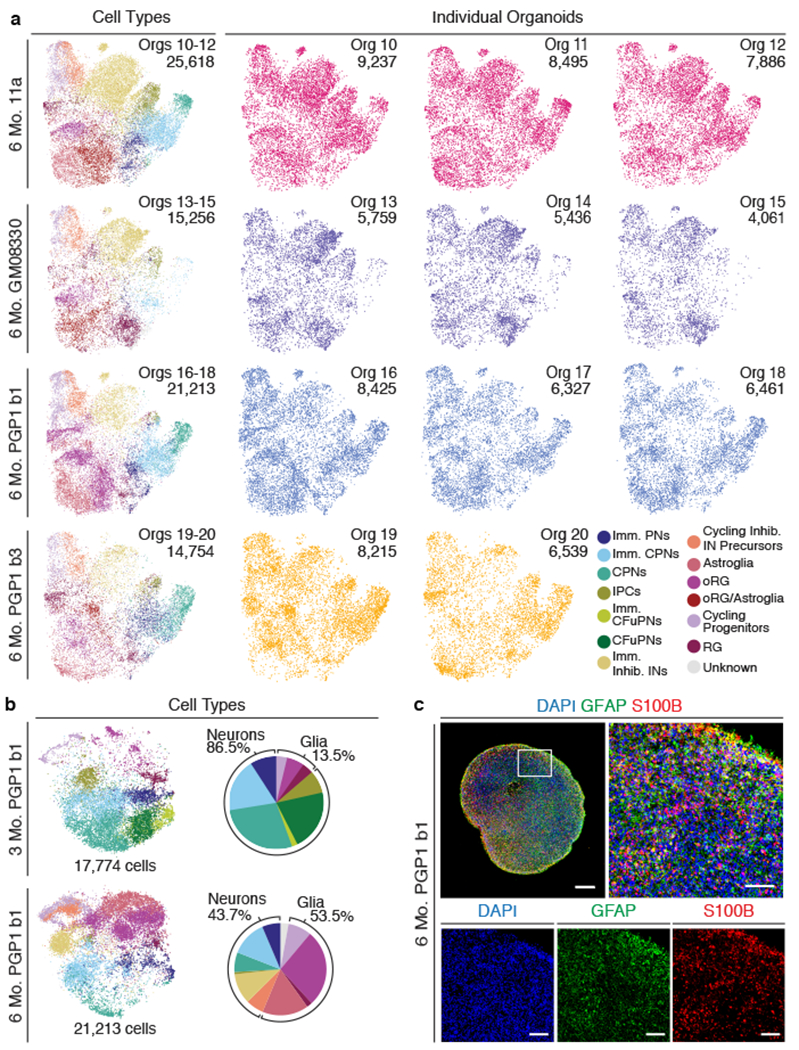
a, T-SNE plots of combined 6 month organoids after batch correction (11a: one batch; GM08330: one batch; PGP1: two independent batches, b1, b3; n=3 organoids per batch). Left column, combined organoids from each batch, colored by cell type; right, individual organoids. Abbreviations as in Figure 1. b, Left, t-SNE plots of PGP1 (b1) organoids at 3 and 6 months (n=3 organoids per timepoint) after batch correction. Right, percent distribution of cell types at each timepoint. c, IHC for astroglial markers GFAP and S100B in a PGP1 (b1) organoid at 6 months (scale bar: whole organoid, 500 μm; high-magnification, 100μm).
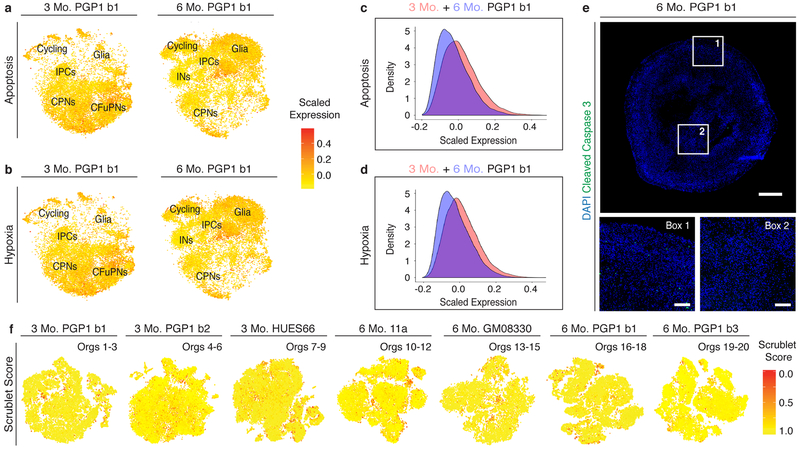
To quantify changes in cellular composition over time, we combined and co-clustered cells from organoids derived from the same differentiation batch (PGP1 b1) but collected at 3 and 6 months (Fig. 2b). The six-month cultures contained substantial numbers of astrocytes, confirmed by IHC for the astrocytic markers S100B and GFAP (Fig. 2c), as well as cycling inhibitory interneuron precursors and immature inhibitory interneurons (Fig. 2a–b). While the origin of these interneurons is unclear, their transcriptional similarity to IPCs (see also Extended Data Fig. 4b) suggests that they could be interneurons of the olfactory bulb, which originate from subventricular zone progenitors25. The data indicate that appropriate additional cell types develop in these organoids, respecting endogenous temporal sequences. Despite the long culture period, molecular markers of apoptosis and hypoxia remained low (Extended Data Fig. 3a–e).
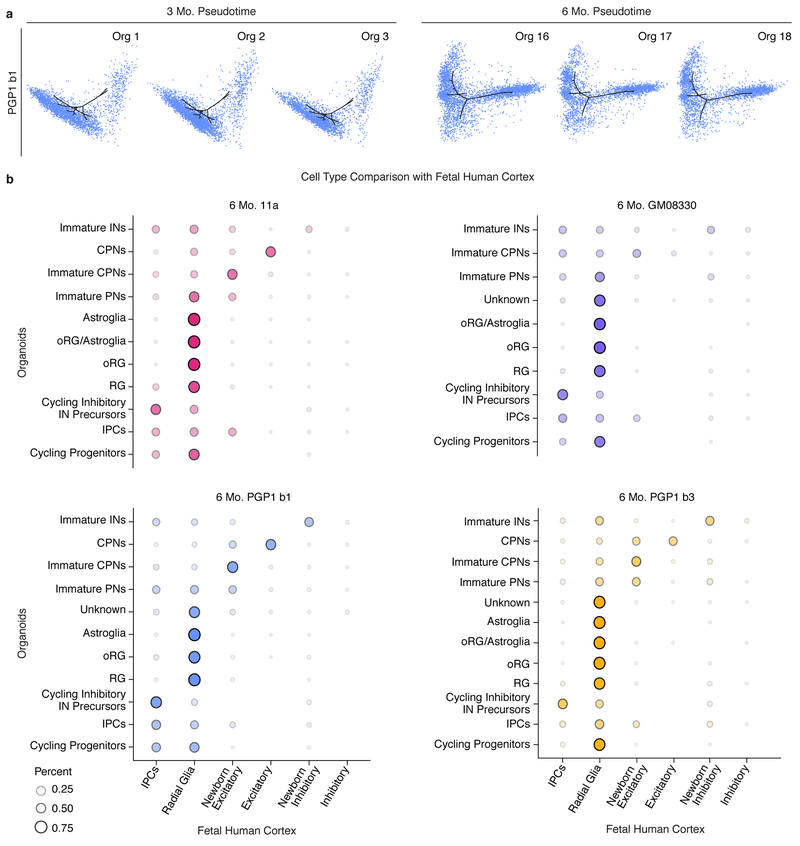
It is possible that, within individual organoids, the same terminal composition of cell types may be generated via distinct developmental trajectories. Therefore, we calculated a developmental pseudotime trajectory26 across all cell lines for each timepoint. Each organoid distributed similarly along the pseudotime trajectory, independent of line or batch, and the pseudotemporal ordering of cell types approximated that of in vivo human development (Fig. 3a–b and Extended Data Fig. 4a). At three months, all organoids followed a trajectory that progressed from radial glia to mature excitatory neurons. Confirming neuronal maturation, colocalization of the pre- and post-synaptic markers VGluT1 and PSD95 suggested the presence of excitatory synapses at this timepoint (Fig. 3c). At six months, the trajectory proceeded along two branches, towards excitatory neurons or mature astrocytes. The data indicate that beyond terminal cellular composition, developmental trajectories of fate specification are reproducibly established in each organoid and therefore can be reliably investigated in this system.
Figure 3: Cells in organoids are generated following a precise and reproducible trajectory and are transcriptionally similar to cells of the human fetal cortex.
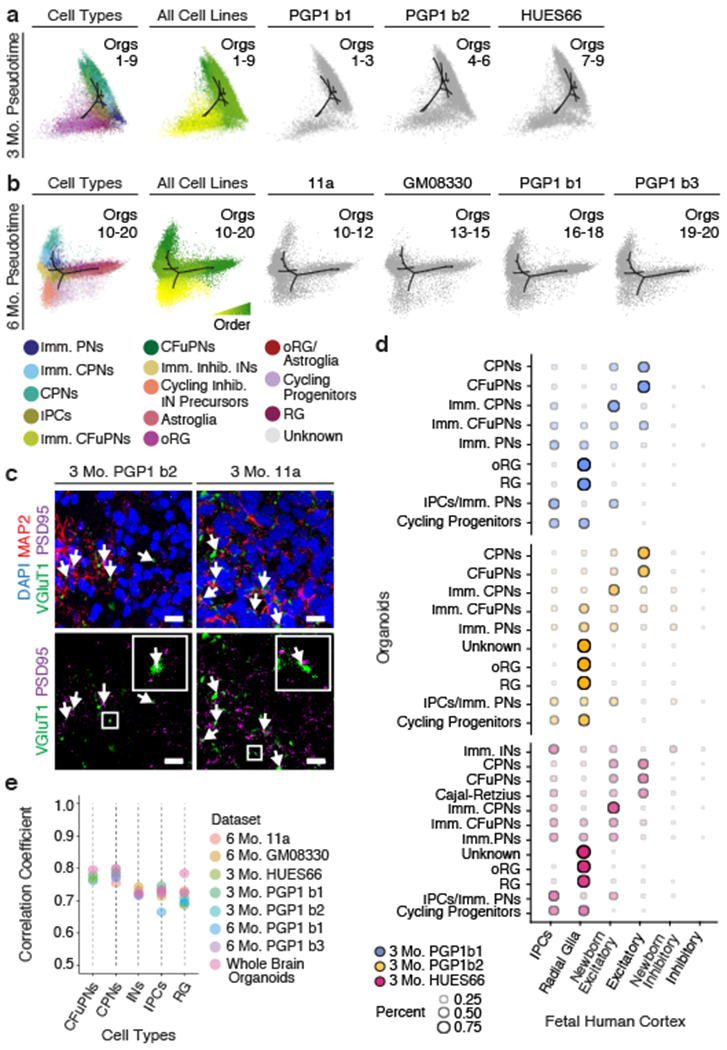
a-b, Pseudotime t-SNE plots for the 3 (a) and 6 (b) month organoids shown in Figures 1d and 2a, colored according to cell type (far left) and pseudotime trajectory (center left; yellow-early to green-late). Right: contribution of each batch of organoids to the pseudotime plots. (n=3 organoids per batch, downsampled to 35,000 cells per timepoint.) c, Agreement between cell type classifications in the human fetal cortex18 and in cell populations of organoids at 3 months (n=3 organoids per batch). Dot size and color intensity indicate the percent of cells in each organoid cell type assigned to each human cell type by a Random Forest classifier. Abbreviations as in Fig. 1. d, Spearman correlation coefficients of variable gene expression in human fetal cortex18 with equivalent cell types found in dorsally patterned forebrain organoids (n as in Figures 1d and 2a) and self-patterned whole-brain organoids3 (n=19 individual organoids, 4 independent batches). e, IHC for neuronal (MAP2) and excitatory presynaptic (VGluT1) and postsynaptic (PSD95) markers in 3 month PGP1 and 11a dorsally patterned organoids; co-localization is shown in white (arrows) (scale bars: 20μm). Lower panels: VGluT1 and PSD95 staining alone; insets: enlargements of boxed areas.
To assess similarity between organoid cell types and those of the endogenous human brain, we employed a published scRNA-seq dataset of human fetal cerebral cortex18. Briefly, fetal human cells were used to train a Random Forest classifier, which was then applied to assign organoid cells to the human cortex cell categories27. Organoid cells at both 3 and 6 months were predominantly assigned to the corresponding endogenous cell class, indicating that their transcriptional profiles were similar to endogenous cells (Fig. 3d and Extended Data Fig. 4b). Importantly, the main cell types present in organoids at 3 months are as similar to the corresponding endogenous cells as those present at 6 months, suggesting that by 3 months organoids are already a valuable tool for modeling human neurodevelopmental processes.
It is unclear whether treatment with exogenous patterning signals may negatively affect the fidelity of terminal cell identities. Therefore, we investigated whether transcriptional similarity to endogenous human fetal cortex18 cells was comparable to that found in self-patterned whole-brain organoids analyzed in our previous study3 (see Methods). All of the dorsally patterned organoids and the whole-brain organoids showed similarly high correlation with human cells (correlation coefficients between 0.67 and 0.80; Fig. 3e). Therefore, the use of exogenous patterning signals in this model does not require a trade-off in the fidelity of the cell types generated.
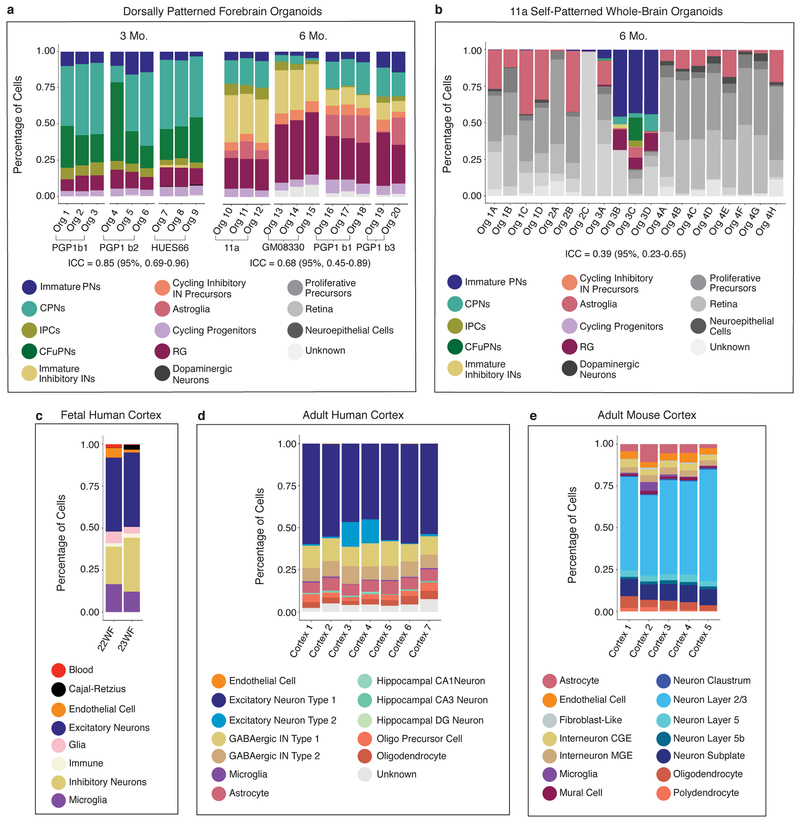
To evaluate the reproducibility of this model relative to prior systems, we compared the variability of dorsally patterned forebrain organoids and self-patterned whole-brain organoids3 (Fig. 4a,b and Extended Data Fig. 5a,b). scRNA-seq data for the 19 individual self-patterned whole-brain organoids in our previous study3 showed high organoid-to-organoid variability, with only a minority of organoids (4/19) generating substantial amounts of forebrain cells (Extended Data Fig. 5b). We applied intraclass correlation (ICC), a correlation metric that considers group structure in the data (i.e., cell types), to the proportions of each cell type produced by each organoid; an ICC near 1.0 indicates high agreement. The 19 organoids in the whole-brain organoid cohort had an ICC of 0.39 (95% Confidence Interval [CI] 0.23–0.65). In contrast, the pre-patterned organoids of the present study scored much higher (3 month organoids: ICC 0.85, 95% CI: 0.69–0.96; 6 month organoids: ICC 0.68, 95% CI: 0.45–0.89) (Extended Data Fig. 5a).
Figure 4: Dorsally patterned organoids show sample-to-sample reproducibility similar to endogenous brains.
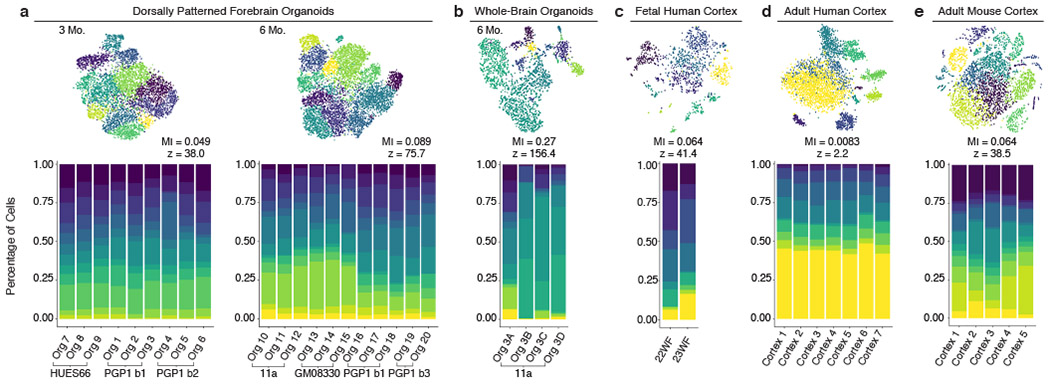
(a-e) Percent of cells from each individual organoid or endogenous cortex belonging to each cell cluster in identically processed datasets from a, dorsally patterned forebrain organoids at 3 months (3 batches, n=9 organoids) and 6 months (4 batches, n=11 organoids), b, self-patterned whole-brain organoids at 6 months3 (n=4), c, fetal human cortex29 (n=2), d, adult human cortex28 (n=7), and e, adult mouse cortex30 (n=5). Top: t-SNE plots of the cell clusters for each dataset. Mutual information (MI) scores represent the dependence between the cluster and the individual (scores range from 0: individuals have the same cluster makeup, to 1: individuals cluster separately). Z-scores represent the divergence of the MI score from the mean MI score expected at random. All datasets downsampled to n=659 cells per sample.
The availability of single-cell RNA-seq datasets from individual human28,29 and mouse30 cortices allowed us to investigate if the reproducibility of cell types generated in dorsally patterned organoids was similar to that of endogenous brains. As existing datasets vary in the terminology and degree of granularity used for cell type assignment (Extended Data Fig. 5), we first re-clustered each dataset using identical methods. We calculated mutual information (MI) scores between cluster assignments and sample identity in each dataset (Fig. 4a–e); a lower MI score and lower z-score indicate higher reproducibility between individuals. For the self-patterned whole-brain organoid model3, we examined specifically the best performing batch of 4 organoids that produced forebrain cells; these organoids had a high MI score of 0.27 and a z-score of 156.4 (Fig. 4b). Conversely, in the dorsally patterned organoids, reproducibility was consistently high, as reflected in low MI and z-scores (MI 0.049–0.089, z-score 38.0–75.7) (Fig. 4a). Remarkably, the reproducibility with which the different clusters are generated in individual dorsally patterned organoids (Fig. 4a and Extended Fig. 5a) is comparable to that of individual endogenous human or mouse brain samples (MI range 0.008–0.064, z-score range 2.2–41.4) (Fig. 4c–e and Extended Data Fig. 5c–e). All datasets, including the human and mouse endogenous brains, showed variation between samples; however, the degree of variation in the dorsally patterned organoid samples was similar to that of the endogenous brain datasets.
Stem cell-based models of the human brain offer an opportunity to investigate processes of human brain development and disease that would not otherwise be experimentally accessible. However, their application has been limited by a variety of factors, prime among which is the lack of developmental reproducibility between individual organoids. Here, through the largest-to-date scRNA-seq dataset in brain organoids, we demonstrate that extensive cellular diversity of a complex CNS region can be generated outside of the embryo in a highly reproducible and developmentally-constrained manner that transcends individual organoids, experimental batch, genetic background, and sex. These data suggest that dynamic processes of development can be modeled in organoids, and that early patterning of a brain region starts a process of cell specification and maturation that is highly constrained even outside the embryo. This level of reproducibility in vitro informs us about basic constraints and principles that control cell diversification in the human brain, and establishes a valuable organoid model amenable to the experimental investigation of developmental abnormalities associated with human neurological disease that would otherwise not be experimentally accessible.
Methods
Pluripotent stem cell (PSC) culture.
The PGP1 (Personal Genome Project 1) hiPSC line was from the lab of George Church16; the HUES66 hESC and the 11a hiPSC lines from the Harvard Stem Cell Institute; the GM08330 hiPSC line31 (also known as GM8330–8)32 from the lab of Michael Talkowski (MGH Hospital); and the Mito 210 hiPSC line from the lab of Bruce Cohen (McLean Hospital). All PSC lines were cultured in feeder-free conditions on Geltrex (Gibco)-coated cell culture dishes, using mTESR1 medium (Stem Cell Technologies) with 100 U/mL penicillin and 100 μg/mL streptomycin (Corning), at 37˚C in 5% CO2. All human PSCs were maintained below passage 50, were negative for mycoplasma (assayed with the MycoAlert™ PLUS Mycoplasma Detection Kit, Lonza), and karyotypically normal (G-banded Karyotype test, performed by WiCell Research Institute, Inc.).
Organoid differentiation.
To generate dorsally patterned forebrain organoids, we modified the method previously described in Kadoshima et al.3. We eliminated the need for growth under 40% O2, the need for cell aggregates to be periodically bisected, and the use of high O2 penetration dishes, by adapting the cultures to growth in spinner-flask bioreactors. Specifically, on day 0, feeder-free cultured human PSCs, 80–90% confluent, were dissociated to single cells with Accutase (Gibco), and 9,000 cells per well were reaggregated in ultra-low cell-adhesion 96-well plates with V-bottomed conical wells (sBio PrimeSurface plate; Sumitomo Bakelite) in Cortical Differentiation Medium (CDM) I, containing Glasgow-MEM (Gibco), 20% Knockout Serum Replacement (Gibco), 0.1 mM Minimum Essential Medium non-essential amino acids (MEM-NEAA) (Gibco), 1 mM pyruvate (Gibco), 0.1 mM 2-mercaptoethanol (Gibco), 100 U/mL penicillin, and 100 μg/mL streptomycin (Corning). From day 0 to day 6, ROCK inhibitor Y-27632 (Millipore) was added to the medium at a final concentration of 20 μM. From day 0 to day 18, Wnt inhibitor IWR1 (Calbiochem) and TGFβ inhibitor SB431542 (Stem Cell Technologies) were added at a concentration of 3 μM and 5 μM, respectively. From day 18, the floating aggregates were cultured in ultra-low attachment culture dishes (Corning) under orbital agitation (70 rpm) in CDM II, containing DMEM/F12 medium (Gibco), 2mM Glutamax (Gibco), 1% N2 (Gibco), 1% Chemically Defined Lipid Concentrate (Gibco), 0.25 μg/mL fungizone (Gibco), 100 U/mL penicillin, and 100 μg/mL streptomycin. On day 35, cell aggregates were transferred to spinner-flask bioreactors (Corning) and maintained at 56 rpm, in CDM III, consisting of CDM II supplemented with 10% fetal bovine serum (FBS) (GE-Healthcare), 5 μg/mL heparin (Sigma), and 1% Matrigel (Corning). From day 70, organoids were cultured in CDM IV, consisting of CDM III supplemented with B27 supplement (Gibco) and 2% Matrigel. A step-by-step protocol describing the long-term culture of dorsally patterned forebrain organoids is available at Protocol Exchange33. Over the time course of the differentiations (experimental batches) included in this paper, an estimated 13 batches of FBS, 4 batches of KSR, and 23 batches of Matrigel were used.
We observed that when starting with healthy viable hiPSCs (mycoplasma-free, karyotypically normal and below passage 50) with typical morphological features of undifferentiated cells (tightly packed colonies of round cells with large nuclei and nucleoli) at 80–90% confluency, the efficiency of forebrain cell type generation was ~90% (93/103 organoids, single-cell RNA-seq and IHC combined efficiency, Extended Data Table 1).
Self-patterned whole-brain organoids were generated as previously described3,34. Dorsal and ventral spheroids were generated using a modification of a previously described protocol15. Specifically, spheres of pluripotent stem cells were grown for four additional days before neural induction; for ventral spheroids, specification of ventral telencephalic identity was obtained by treatment with the SHH agonist SAG (Selleckhem; 100nM) from days 7 to 20.
Immunohistochemistry and In Situ Hybridization.
Samples were fixed in 4% paraformaldehyde (Electron Microscopy Services), cryoprotected in 30% sucrose solution, embedded in Optimum Cutting Temperature (OCT) compound (Tissue Tek) and cryosectioned (14 μm thickness). Sections were washed with 0.1% TWEEN-20 (Sigma) in Phosphate buffered saline (PBS) (Gibco), blocked for 1 hr at RT with 6% donkey serum (DS) (Sigma) + 0.3% Triton X-100 (Sigma) in PBS, and incubated with primary antibodies overnight at 4℃ (diluted with 2.5% DS + 0.1% Triton X-100 in PBS). Primary antibodies and dilutions used are specified in Extended Data Table 2. PSD95 and VGluT1 immunohistochemistry (IHC) was performed as in Arlotta et al.20. RNA in situ hybridization was performed using the RNAscope Fluorescent Multiplex Reagent Kit (Advanced Cell Diagnostics) according to the manufacturer’s instructions. The probes used are: Hs-EOMES-C2 (429691-C2), Hs-TBR1-C3 (425571-C3), and Hs-Reln (413051) (Advanced Cell Diagnostics).
Microscopy and Image analysis.
Images of organoids in culture were taken on an EVOS FL microscope (Invitrogen). Immunofluorescence images were obtained using an LSM 700 inverted confocal microscope (Zeiss) and analyzed with the ZEN Blue/Black 2012 image-processing software.
Dissociation of brain organoids and single-cell RNA-seq.
Individual brain organoids were dissociated into a single-cell suspension using the Worthington Papain Dissociation System kit (Worthington Biochemical). A detailed description of the dissociation protocol is available at Protocol Exchange33. Dissociated cells were resuspended in ice-cold PBS containing 0.04% BSA (Sigma) at a concentration of 1000 cells/μL, and approximately 17,400 cells per channel (to give estimated recovery of 10,000 cells per channel) were loaded onto a Chromium™ Single Cell 3’ Chip (10x Genomics, PN-120236) and processed through the Chromium Controller to generate single-cell GEMs (Gel Beads in Emulsion). Single-cell RNA-Seq libraries were prepared with the Chromium™ Single Cell 3’ Library & Gel Bead Kit v2 (10x Genomics, PN-120237). Libraries from different samples were pooled based on molar concentrations and sequenced on a NextSeq 500 instrument (Illumina) with 26 bases for read 1, 57 bases for read 2 and 8 bases for Index 1. After the first round of sequencing, libraries were re-pooled based on the actual number of cells in each and re-sequenced to give equal number of reads per cell in each sample and to reach a sequencing saturation of at least 50% (in most cases >70%).
Single-cell RNA-seq data analysis.
The Cell Ranger 2.0.1 pipeline (10x Genomics)35 was used to align reads from RNA-seq to the GRCh38 human reference genome and produce the associated cell by gene count matrix (Extended Data Table 3). Default parameters were used, except for the ‘--cells’ argument. Unique Molecular Identifier (UMI) counts were analyzed using the Seurat R package v2.3.436. Cells expressing a minimum of 500 genes were kept, and UMI counts were normalized for each cell by the total expression, multiplied by 1 million, and log-transformed. Seurat’s default method for identifying variable genes was used with x.low.cutoff=1, and the ScaleData function was used to regress out variation due to differences in total UMIs per cell. Principal component analysis (PCA) was performed on the scaled data for the variable genes, and significant principal components (PC) were chosen. Cells were clustered in PCA space with a method adapted from 27 by finding the 50 nearest neighbors to each cell using R’s RANN package37, building a graph with edges between neighbor cells weighted by the Jaccard distance, and performing Louvain clustering on the resulting graph. Variation in the cells was visualized by t-SNE on the significant PCs.
For each dataset of three organoids, differentially expressed genes upregulated in each cluster compared to the rest of the cells were identified using Seurat’s implementation of the Model-based Analysis of Single Cell Transcriptomics (MAST) algorithm38 (Supplementary Information Table 1). To identify cell types, genes with a Bonferroni-adjusted p value less than 0.01 and a log Fold Change of at least 0.25 were taken into consideration. Ambient RNA was found to affect clustering distribution in at least two individual batches (Supplementary Note 1), but no correction was needed after comparing data across batches. To do so, we used Seurat’s canonical correlation analysis (multi-CCA) procedure for batch correction with default parameters36. Briefly, this identifies vectors along which the datasets correlate, and then aligns values along these vectors to reduce batch variation. T-SNE plots were used to visualize variation in the data after alignment in the top 20 canonical correlation vectors.
Pseudotime analysis was performed using the Monocle package v2.99.126 with default parameters. UMI counts from 35,000 randomly sampled cells per timepoint were imported into Monocle’s CellDataSet object with an expected negative binomial distribution. T-SNE plots were used for visualization, and the “SimplePPT” method was employed to learn a tree-like trajectory between the cells. When ordering the cells along this trajectory, cells previously assigned to the “Cycling Progenitors” cell type were specified as the starting state. Finally, Scrublet v0.139 was used to assess the effect of droplets that may have contained more than one cell, with an expected doublet rate of 0.1 and a score threshold of 0.39, chosen based on histograms of simulated doublet scores (Extended Data Fig. 3F).
Comparison to published single-cell RNA-seq data.
To compare the cell types found in the dorsally patterned organoids to previously published data from whole-brain organoids3 and endogenous tissue18,28–30, we downloaded UMI count data available from those publications, created Seurat objects, and submitted it to the same normalization, clustering, and visualization pipeline as above. In the case of Fan et al.,29 log(TPM+1) were used instead of UMI counts. To compare variability in cell type proportion between dorsally patterned organoids and whole-brain organoids, intraclass correlation was computed by creating a table of cell type proportions across each individual organoid, and using the icc command in the irr R package v0.84, with model=“twoway”, type=“agreement”, and unit=“single”. To compare cell type classifications between organoid data and fetal human data (as in Fig. 4A and Extended Data Fig. 5A), cell types as assigned to each cell by Nowakowski et al.18 were aggregated into more general cell types (after removing clusters not found in organoids: oligodendrocyte precursors, endothelial, and microglia, or with too few cells: unknown and astrocytes) and used to train a Random Forest classifier to distinguish between cell types27. This was done with the tuneRF function in the randomForest R package40 with doBest=T, after the data was downsampled to 314 cells per cell type (the size of the smallest cell type). The classifier was then applied to the organoid data to assign organoid cells to one of the human cortex cell types. To calculate correlations between cell types (as in Fig. 3e), we assigned cell types to cells in Nowakowski et al.18 using the same method that was used for organoids. The Spearman correlation was calculated between the gene expression of highly variable genes in the Nowakowski et al.18 dataset in the “average cell” in each cell type (calculated with Seurat’s AverageExpression function). To measure reproducibility of clusters per individual organoid, human cortex, or mouse cortex sample, data was downsampled to have 659 cells per individual (to match the sample with the fewest cells, adult human cortex 5) before clustering all individuals in a dataset together. Mutual information was calculated between cluster assignments and individuals with the mpmi R package. Z-scores were calculated by creating background distributions for each dataset, by permuting cluster assignments and re-calculating the mutual information score 1,000 times.
Statistics and Reproducibility.
A total of 21 single organoids collected at 3 and 6 months, derived from 4 different cell lines, from 6 independent batches (PGP1: 3 batches; HUES66, GM08330, and 11a: 1 batch each; n=3 organoids per batch and timepoint) were profiled by single-cell RNA-seq. Analysis of over 166,242 single cells revealed reproducibility in the diversity of cell types generated “organoid-to-organoid” for 20/21 organoids (~95% efficiency) (Extended Data Table 1). A total of 82 single organoids, derived from 5 different lines, from 8 independent batches (PGP1: 3 batches; HUES66: 2 batches; GM08330, 11a, and Mito 210: 1 batch each) were analyzed by IHC for expression of EMX1, PAX6, MAP2 at 1 month (n=26/26 positive); 3 months (n=37/37 positive for PAX6 and MAP2; and 36/37 positive for EMX1); and 6 months (n=19/19 positive for PAX6 and MAP2; 11/19 positive for EMX1) (Fig. 1c, Extended Data Fig. 2b, and Extended Data Table 1). IHC for CTIP2 and SATB2 was performed on 3 month organoids derived from 5 different cell lines, from 8 independent batches (PGP1: 3 batches; HUES66: 2 batches; GM08330, 11a, and Mito 210: 1 batch each) (n=32/37 positive) (Fig. 1c, Extended Data Fig. 2b). IHC for GFAP and S100B (Fig. 2c) was performed on 6 month organoids derived from 1 cell line (PGP1, 1 batch) (n=3/3 positive). IHC for VGluT1 and PSD95 (Fig. 3c) was performed on 3 month organoids from 2 cell lines, from 2 independent batches (PGP1 and 11a: 1 batch each) (n=8/8 positive). IHC for SOX2 (Extended Data Fig. 2b) was performed on 3 month organoids from 5 cell lines, from 7 batches (PGP1: 2 batches; HUES66: 2 batches; 11a, GM08330, and Mito210: 1 batch) (n=34/34 positive). IHC for Ki67 (Extended Data Fig. 2b) was performed on 3 month organoids from 4 cell lines, from 4 batches (PGP1, 11a, HUES66, and GM08330: 1 batch each) (n=22/22 positive). IHC for FOXG1, HOPX, TBR1, and TBR2 at 3 months and 6 months (Extended Data Fig. 2d) was performed on organoids from one cell line (PGP1: 1 batch) (n=7/7 positive). IHC for HOPX at 3 months was also performed on two additional cell lines (HUES66 and GM08330: 1 batch each) (n=12/12 positive). IHC for cleaved Caspase 3 (Extended Data Fig. 3e) was performed on organoids from one batch of the PGP1 cell line, at 3, 4, 5 and 6 months (n=3 for each timepoint). Overall, expression of MAP2, EMX1, PAX6, CTIP2, and SATB2 was assessed at 1, 3 and 6 months on organoids from each independent batch, and at 2, 4 and 5 months for one batch of PGP1 (Extended Data Fig. 1b).
RNA in situ Hybridization for EOMES (TBR2), Reelin, and TBR1 was performed on 3 month organoids from 4 cell lines (PGP1, 11a, GM08330, HUES66), from 4 batches (n=22/22 positive). No statistical methods were used to predetermine the sample size.
Data availability.
Single-cell RNA-seq data that support the findings of this study have been deposited at Gene Expression Omnibus, accession number GSE129519, and at the Single Cell Portal (portals.broadinstitute.org/single_cell/study/reproducible-brain-organoids). The reference datasets used for comparison are available in the Gene Expression Omnibus at accession numbers GSE86153, GSE116470, and GSE103723, or in dbGaP at accession phs000989.v3, and phs000424.v8.p1.
Code availability.
The code used for data analysis is available on GitHub (https://github.com/AmandaKedaigle/BrainOrganoidsReproducibility).
Extended Data
Extended Data Figure 1: Comparison of organoids and spheroids generated by different protocols.
a, From left: self-patterned whole-brain organoids3, dorsally patterned forebrain organoids (protocol modified from Kadoshima et al.5), and dorsal and ventral forebrain spheroids (protocol modified from Rigamonti et al.15). All models are generated from the PGP1 line and cultured for 6 months. b, IHC for neuronal (MAP2), dorsal forebrain progenitor (EMX1 and PAX6), CFuPN (CTIP2), and CPN (SATB2) markers, across a time course from 1 to 6 months [scale bars: whole organoids (Whole Org), left column, 200μm; close-up images, 50μm].
Extended Data Figure 2: Analysis of cell type-specific markers in organoids derived from different lines.
a, Expression of selected marker genes used in cell type identification. Violin plots show distribution of normalized expression in cells from CCA-aligned organoids at 3 months (n=9 organoids from 3 batches). CFuPNS: n=15,866 cells; CPNs, n=18,905 cells; Cycling, n=4,035 cells; Immature INs, n=353 cells; Immature PNs, n=6,727 cells; IPCs, 4,276 cells; oRG, n=5,436 cells; and RG, n=3,318 cells. Scale: normalized read counts. b, IHC for neuronal (MAP2), dorsal forebrain progenitor (EMX1 and PAX6), CFuPN (CTIP2), CPN (SATB2), radial glia (SOX2), and proliferation (Ki67) markers in PGP1 (b2), 11a, GM08330, and HUES66 organoids at 3 months. c, In situ RNA hybridization for the IPC (EOMES a.k.a. TBR2), Cajal-Retzius (Reelin), and post-mitotic PN (TBR1) markers in 3 month PGP1 (b2), 11a, GM08330, and HUES66 organoids. d, IHC for the forebrain progenitor (FOXG1), outer radial glia (HOPX), post-mitotic PN (TBR1), and IPC (TBR2) markers in PGP1 (b2) organoids at 3 and 6 months (scale bars for B, C, D: 50 μm). Abbreviations as in Figure 1.
Extended Data Figure 3: Evaluation of apoptosis, hypoxia, and doublets in organoid scRNA-seq data.
a-b, T-SNE plots showing average scaled expression of all genes from the a, apoptosis and b, hypoxia mSigDB Hallmark genesets in PGP1 (b1) organoids at 3 (left) and 6 (right) months. Abbreviations as in Figure 1. n=3 organoids per timepoint. c-d, Histograms showing number of cells expressing c, apoptosis markers and d, hypoxia markers in PGP1 organoids at 3 and 6 months. X-axis indicates average scaled expression of all genes in the corresponding mSigDB Hallmark geneset. The similarity in markers of hypoxia and apoptosis between the three and six month single-cell data indicates that the growth conditions of this protocol preserve the health of the tissue over many months in culture. e, IHC of a 6 month PGP1 organoid for the apoptotic marker activated caspase 3, on the perimeter (Box 1) and in the center of an organoid (Box 2) (scale bar: whole organoid section, 500 μm; close-up images, 100μm). f, Multiplet detection using the Scrublet39 program. Scores represent the probability that the “cell” represents a droplet containing more than one cell. From left, t-SNE plots of PGP1 (two batches: b1, b2; n=3 organoids for b1, and n=3 organoids for b2) and HUES66 (n=3 organoids) organoids at 3 months; and 11a (n=3 organoids), GM08330 (n=3 organoids), and PGP1 (two batches: b1, b3; n=3 organoids for b1, and n=2 organoids for b3) organoids at 6 months. Overall, 2-8% of cells were predicted to be multiplets, which is consistent with the expected multiplet rate (~5%) given our loadings of approximately 10,000 cells per channel35.
Extended Data Figure 4: Cell types in individual organoids are generated following a precise and reproducible temporal order and are transcriptionally similar to human fetal cortex cell types.
a, T-SNE plots produced by Monocle2 showing the contribution of cells from individual PGP1 (b1) organoids at 3 (n=2,665, 3,094, and 2,264 cells from Orgs 1-3) and 6 months (n=3,959, 2,971, and 3,042 cells from Orgs 16-18) to plots in Fig. 3a–b. b, Agreement between cell type classifications in cell populations of 11a, GM08330, and PGP1 organoids (two batches: b1, b3) at 6 months with cell types described in a previously published single-cell RNA-seq dataset of the human fetal cortex18. Dot size and color intensity indicate the percent of organoid cells in each cell cluster assigned to each human cortex cell type by a Random Forest classifier. Abbreviations as in Figure 1.
Extended Data Figure 5: Dorsally patterned forebrain organoids show reproducibility similar to that of endogenous brain, as compared to self-patterned whole-brain organoids.
a-b, Percent distribution of cell types in a, (left) individual 3 month PGP1 (two batches: b1, b2) and HUES66 (n=3 per batch) dorsally patterned forebrain organoids, and (right) individual 6 month 11a, GM08330, and PGP1 (two batches: b1, b3, n=3 per batch) dorsally patterned forebrain organoids, vs. b, individual 6 month self-patterned whole-brain organoids3. c-e, Distribution of cell types as assigned in the original publication across c, individual samples of fetal human cortex29, d, adult human cortex samples from distinct individuals28, and e, adult mouse cortex samples from distinct individuals30. Abbreviations as in Fig. 1. DG, dentate gyrus; CGE, caudal ganglionic eminence; MGE, medial ganglionic eminence.
Extended Data Table 1. Quantification of protocol efficiency.
Efficiency of dorsal forebrain cell type generation as assessed by IHC for neuronal (MAP2) and dorsal progenitor (PAX6 and EMX1) markers at 1, 3 and 6 months, and by single-cell RNA-seq analysis at 3 and 6 months. In addition to data for the 6 experimental batches described in this study, data for two additional batches, a replicate for the HUES66 and one batch for the additional line Mito 210, are also included in the table. Detailed information about repetitions and efficiency can be found in Methods, in the “Statistics and Reproducibility” section.
| Expression of Neuronal and Cortical Markers by IHC |
Generation of Forebrain Cell Types by RNA-seq |
|||||||||||
|---|---|---|---|---|---|---|---|---|---|---|---|---|
| Timepoint | Cell Line | Batches | Organoids Analyzed | MAP2 | PAX6 | EMX1 | Organoids Analyzed | Reproducibility | ||||
| 1 Mo. | PGP1 | 2 | 7 | 7/7 | 100% | 7/7 | 100% | 7/7 | 100% | |||
| 11a | 1 | 4 | 4/4 | 100% | 4/4 | 100% | 4/4 | 100% | ||||
| GM08330 | 1 | 6 | 6/6 | 100% | 6/6 | 100% | 6/6 | 100% | ||||
| Mito 210 | 1 | 4 | 4/4 | 100% | 4/4 | 100% | 4/4 | 100% | ||||
| HUES66 | 2 | 5 | 5/5 | 100% | 5/5 | 100% | 5/5 | 100% | ||||
| Total | 7 | 26 | 26/26 | 100% | 26/26 | 100% | 26/26 | 100% | ||||
| 3 Mo. | PGP1 | 3 | 10 | 10/10 | 100% | 10/10 | 100% | 9/10 | 90% | 6 (2 batches) | 6/6 | 100% |
| 11a | 1 | 6 | 6/6 | 100% | 6/6 | 100% | 6/6 | 100% | ||||
| GM08330 | 1 | 6 | 6/6 | 100% | 6/6 | 100% | 6/6 | 100% | ||||
| Mito 210 | 1 | 3 | 3/3 | 100% | 3/3 | 100% | 3/3 | 100% | ||||
| HUES66 | 2 | 12 | 12/12 | 100% | 12/12 | 100% | 12/12 | 100% | 3 | 3/3 | 100% | |
| Total | 8 | 37 | 37/37 | 100% | 37/37 | 100% | 36/37 | 97% | 9 | 9/9 | 100% | |
| Mito 210 | 1 | 4 | 4/4 | 100% | 4/4 | 100% | 4/4 | 100% | ||||
| 6 Mo. | PGP1 | 2 | 6 | 6/6 | 100% | 6/6 | 100% | 5/6 | 83% | 6 (2 batches) | 5/6 | 83% |
| 11a | 1 | 3 | 3/3 | 100% | 3/3 | 100% | 3/3 | 100% | 3 | 3/3 | 100% | |
| GM08330 | 1 | 3 | 3/3 | 100% | 3/3 | 100% | 3/3 | 100% | 3 | 3/3 | 100% | |
| HUES66 | 1 | 7 | 7/7 | 100% | 7/7 | 100% | 0/7 | 0% | ||||
| Total | 5 | 19 | 19/19 | 100% | 19/19 | 100% | 11/19 | 58% | 12 | 11/12 | 92% | |
| Total | 8 | 82 | 82/82 | 100% | 82/82 | 100% | 73/82 | 89% | 21 | 20/21 | 95% | |
Extended Data Table 2.
Primary antibodies used for immunofluorescence.
| Primary Antibody | Host | Manufacturer | Catalog Number | Dilution |
|---|---|---|---|---|
| Cleaved Caspase 3 | Rabbit | Cell Signaling Technologies | 9661 | 1/300 |
| CTIP2 | Rat | Abcam | AB18465 | 1/100 |
| EMX1 | Rabbit | Atlas Antibodies | HPA006421 | 1/50 |
| FOXG1 | Rabbit | Abcam | 196868 | 1/100 |
| GFAP | Mouse | Sigma-Aldrich | G3893 | 1/400 |
| HOPX | Rabbit | Sigma-Aldrich | HPA030180 | 1/2,500 |
| Ki67 | Mouse | BD Biosciences | 550609 | 1/400 |
| MAP2 | Chicken | Abcam | AB5392 | 1/5,000 |
| PAX6 | Rabbit | Biolegend | 901301 | 1/400 |
| PSD95 | Rabbit | Thermo Fisher | 51-6900 | 1/350 |
| S100B | Rabbit | Abcam | AB41548 | 1/2,000 |
| SATB2 | Mouse | Abcam | AB51502 | 1/50 |
| SOX2 | Goat | RD Systems | AF2018 | 1/50 |
| TBR1 | Rabbit | Abcam | AB31940 | 1/500 |
| TBR2 | Rabbit | Millipore | AB2283 | 1/2,000 |
| VGluT1 | Guinea Pig | Millipore | AB5905 | 1/2,000 |
Extended Data Table 3. Statistics from single-cell RNA-sequencing.
Columns 3-6 represent initial statistics reported from the CellRanger program, for consistency with prior studies; columns 7-9 represent final data after full quality control, as used in the analyses.
| Total Reads | Mean Reads/Cell | Reads Mapped Confidently to Transcriptome | Median Genes/Cell | Cells Passing QC | Mean Mapped Reads in Passing Cells | Median Mapped Reads in Passing Cells | |||
|---|---|---|---|---|---|---|---|---|---|
| 3 Mo. | PGP1 (batch 1) | Org #1 | 282,380,462 | 47,610 | 45.80% | 2,086 | 5,924 | 17,915 | 16,290 |
| Org #2 | 308,237,385 | 44,847 | 47.00% | 1,898 | 6,858 | 18,010 | 15,555 | ||
| Org #3 | 232,194,411 | 46,429 | 45.30% | 2,055 | 4,992 | 17,926 | 15,485 | ||
| PGP1 (batch 2) | Org #4 | 320,293,451 | 35,627 | 48.80% | 2,078 | 8,989 | 14,221 | 12,146 | |
| Org # 5 | 290,649,261 | 38,048 | 49.60% | 1,988 | 7,639 | 15,012 | 11,545 | ||
| Org #6 | 312,301,428 | 28,326 | 49.00% | 1,501 | 11,018 | 11,481 | 9,638 | ||
| HUES66 | Org #7 | 357,410,387 | 33,993 | 53.90% | 1,741 | 10,509 | 15,599 | 13,346 | |
| Org #8 | 360,164,748 | 35,362 | 52.70% | 1,709 | 10,175 | 15,336 | 13,032 | ||
| Org #9 | 458,590,387 | 37,329 | 53.30% | 1,589 | 12,275 | 17,141 | 15,263 | ||
| 6 Mo. | 11a | Org #10 | 328,096,843 | 35,504 | 50.80% | 1,290 | 9,237 | 14,958 | 10,947 |
| Org #11 | 309,099,766 | 36,343 | 52.00% | 1,330 | 8,495 | 15,786 | 11,773 | ||
| Org #12 | 399,350,440 | 50,589 | 49.20% | 1,438 | 7,886 | 20,607 | 15,158 | ||
| GM08330 | Org #13 | 178,317,524 | 30,898 | 50.00% | 1,723 | 5,759 | 11,255 | 8,007 | |
| Org #14 | 175,558,635 | 32,271 | 49.60% | 1,758 | 5,436 | 11,513 | 8,362 | ||
| Org #15 | 124,971,025 | 30,743 | 51.00% | 1,724 | 4,061 | 10,635 | 7,485 | ||
| PGP1 (batch 1) | Org #16 | 420,342,563 | 49,850 | 52.50% | 1,477 | 8,425 | 20,150 | 14,760 | |
| Org #17 | 300,940,886 | 47,496 | 52.80% | 1,727 | 6,327 | 19,659 | 14,726 | ||
| Org #18 | 314,512,990 | 48,565 | 56.80% | 1,501 | 6,461 | 22,105 | 16,655 | ||
| PGP1 (batch 3) | Org #19 | 249,698,784 | 30,376 | 50.60% | 1,472 | 8,215 | 12,331 | 9,489 | |
| Org #20 | 150,922,738 | 23,055 | 47.80% | 1,581 | 6,539 | 9,253 | 7,102 | ||
| Org #21 | 347,029,455 | 31,479 | 58.00% | 2,053 | 11,022 | 17,026 | 15,005 | ||
Supplementary Material
Acknowledgements:
We thank J.R. Brown and C. Gerhandinger for insightful discussions and editing of the manuscript; T. Nguyen, V. Jokhi, A. S. Shetty, J. Stogsdill, D. Di Bella, X. Jin, and K. Shekhar for help with scRNA-seq analysis and classification; M. Cuoco, J. Waldman, and D. Dionne for help with scRNA-seq library preparation; the Eggan lab for providing the 11a line; the Talkowski lab for the GM08330 line; and the Cohen lab for the Mito 210 line. This work was supported by grants from the Stanley Center for Psychiatric Research, the Broad Institute of Harvard and MIT, and the National Institute of Health (R01-MH112940) to P.A. and J.L., the Klarman Cell Observatory to J.L and A.R, and the Howard Hughes Medical Institute to A.R. This work is dedicated to the memory of Yoshiki Sasai, who was a pioneer of the field of brain organoids and first established the protocol that we build upon in this study.
Footnotes
The authors declare no competing interests.
Supplementary Information is linked to the online version of the paper at www.nature.com/nature.
References
- 1.Silbereis JC, Pochareddy S, Zhu Y, Li M & Sestan N The Cellular and Molecular Landscapes of the Developing Human Central Nervous System. Neuron 89, 248–268 (2016). [DOI] [PMC free article] [PubMed] [Google Scholar]
- 2.Quadrato G, Brown J & Arlotta P The promises and challenges of human brain organoids as models of neuropsychiatric disease. Nat. Med 22, 1220–1228 (2016). [DOI] [PubMed] [Google Scholar]
- 3.Quadrato G et al. Cell diversity and network dynamics in photosensitive human brain organoids. Nature 545, 48–53 (2017). [DOI] [PMC free article] [PubMed] [Google Scholar]
- 4.Lancaster MA et al. Cerebral organoids model human brain development and microcephaly. Nature 501, 373–379 (2013). [DOI] [PMC free article] [PubMed] [Google Scholar]
- 5.Kadoshima T et al. Self-organization of axial polarity, inside-out layer pattern, and species-specific progenitor dynamics in human ES cell-derived neocortex. Proc. Natl. Acad. Sci 110, 20284–20289 (2013). [DOI] [PMC free article] [PubMed] [Google Scholar]
- 6.Yoon SJ et al. Reliability of human cortical organoid generation. Nat. Methods 16, 75–78 (2018). [DOI] [PMC free article] [PubMed] [Google Scholar]
- 7.Pollen AA et al. Establishing Cerebral Organoids as Models of Human-Specific Brain Evolution. Cell 176, 743–756. e17 (2019). [DOI] [PMC free article] [PubMed] [Google Scholar]
- 8.Camp JG et al. Human cerebral organoids recapitulate gene expression programs of fetal neocortex development. Proc. Natl. Acad. Sci 112, 15672–15677 (2015). [DOI] [PMC free article] [PubMed] [Google Scholar]
- 9.Qian X et al. Brain-Region-Specific Organoids Using Mini-bioreactors for Modeling ZIKV Exposure. Cell 165, 1238–1254 (2016). [DOI] [PMC free article] [PubMed] [Google Scholar]
- 10.Lancaster MA et al. Guided self-organization and cortical plate formation in human brain organoids. Nat. Biotechnol 35, 659–666 (2017). [DOI] [PMC free article] [PubMed] [Google Scholar]
- 11.Bagley JA, Reumann D, Bian S, Lévi-Strauss J & Knoblich JA Fused cerebral organoids model interactions between brain regions. Nat. Methods 14, 743–751 (2017). [DOI] [PMC free article] [PubMed] [Google Scholar]
- 12.Xiang Y et al. Fusion of regionally-specified hPSC-derived organoids models human brain development and interneuron migration. Cell Stem Cell 21, 383–398.e7 (2017). [DOI] [PMC free article] [PubMed] [Google Scholar]
- 13.Birey F et al. Assembly of functionally integrated human forebrain spheroids. Nature 545, 54–59 (2017). [DOI] [PMC free article] [PubMed] [Google Scholar]
- 14.Bershteyn M et al. Human iPSC-Derived Cerebral Organoids Model Cellular Features of Lissencephaly and Reveal Prolonged Mitosis of Outer Radial Glia. Cell Stem Cell 20, 435–449. e1–e4 (2017). [DOI] [PMC free article] [PubMed] [Google Scholar]
- 15.Rigamonti A et al. Large-scale production of mature neurons from human pluripotent stem cells in a three-dimensional suspension culture system. Stem Cell Reports 6, 993–1008 (2016). [DOI] [PMC free article] [PubMed] [Google Scholar]
- 16.Church GM The Personal Genome Project. Mol. Syst. Biol 1, E1–E3 (2005). [DOI] [PMC free article] [PubMed] [Google Scholar]
- 17.Pollen AA et al. Molecular Identity of Human Outer Radial Glia during Cortical Development. Cell 163, 55–67 (2015). [DOI] [PMC free article] [PubMed] [Google Scholar]
- 18.Nowakowski TJ et al. Spatiotemporal gene expression trajectories reveal developmental hierachies of the human cortex. Science (80-. ). 358, 1318–1323 (2017). [DOI] [PMC free article] [PubMed] [Google Scholar]
- 19.Molyneaux BJ et al. Novel Subtype-Specific Genes Identify Distinct Subpopulations of Callosal Projection Neurons. J. Neurosci 29, 12343–12354 (2009). [DOI] [PMC free article] [PubMed] [Google Scholar]
- 20.Arlotta P et al. Neuronal subtype-specific genes that control corticospinal motor neuron development in vivo. Neuron 45, 207–221 (2005). [DOI] [PubMed] [Google Scholar]
- 21.Zhang Y et al. Purification and Characterization of Progenitor and Mature Human Astrocytes Reveals Transcriptional and Functional Differences with Mouse. Neuron 89, 37–53 (2016). [DOI] [PMC free article] [PubMed] [Google Scholar]
- 22.Darmanis S et al. A survey of human brain transcriptome diversity at the single cell level. Proc. Natl. Acad. Sci 112, 7285–7290 (2015). [DOI] [PMC free article] [PubMed] [Google Scholar]
- 23.Lodato S & Arlotta P Generating Neuronal Diversity in the Mammalian Cerebral Cortex. Annu. Rev. Cell Dev. Biol 31, 699–720 (2015). [DOI] [PMC free article] [PubMed] [Google Scholar]
- 24.Greig LC, Woodworth MB, Galazo MJ, Padmanabhan H & Macklis JD Molecular logic of neocortical projection neuron specification, development and diversity. Nat. Rev. Neurosci 14, 755–769 (2013). [DOI] [PMC free article] [PubMed] [Google Scholar]
- 25.Kohwi M et al. A Subpopulation of Olfactory Bulb GABAergic Interneurons Is Derived from Emx1- and Dlx5/6-Expressing Progenitors. J. Neurosci 27, 6878–6891 (2007). [DOI] [PMC free article] [PubMed] [Google Scholar]
- 26.Qiu X et al. Reversed graph embedding resolves complex single-cell trajectories. Nat. Methods 14, 979–982 (2017). [DOI] [PMC free article] [PubMed] [Google Scholar]
- 27.Shekhar K et al. Comprehensive Classification of Retinal Bipolar Neurons by Single-Cell Transcriptomics. Cell 166, 1308–1323.e30 (2016). [DOI] [PMC free article] [PubMed] [Google Scholar]
- 28.Habib N et al. Massively parallel single-nucleus RNA-seq with DroNc-seq. Nat. Methods 14, 955–958 (2017). [DOI] [PMC free article] [PubMed] [Google Scholar]
- 29.Fan X et al. Spatial transcriptomic survey of human embryonic cerebral cortex by single-cell RNA-seq analysis. Cell Res. 28, 730–745 (2018). [DOI] [PMC free article] [PubMed] [Google Scholar]
- 30.Saunders A et al. Molecular Diversity and Specializations among the Cells of the Adult Mouse Brain. Cell 174, 1015–1030.e16 (2018). [DOI] [PMC free article] [PubMed] [Google Scholar]
Supplementary References
- 31.Sheridan SD et al. Epigenetic characterization of the FMR1 gene and aberrant neurodevelopment in human induced pluripotent stem cell models of fragile X syndrome. PLoS One 6, e26203 (2011). [DOI] [PMC free article] [PubMed] [Google Scholar]
- 32.Sugathan A et al. CHD8 regulates neurodevelopmental pathways associated with autism spectrum disorder in neural progenitors . Proc. Natl. Acad. Sci 111, E4468–E4477 (2014). [DOI] [PMC free article] [PubMed] [Google Scholar]
- 33.Velasco S, Paulsen B & Arlotta P Highly reproducible human brain organoids recapitulate cerebral cortex cellular diversity. Nat. Protoc. Exch (2019). [Google Scholar]
- 34.Quadrato G, Sherwood JL & Arlotta P Long term culture and electrophysiological characterization of human brain organoids. Protoc. Exch (2017). doi: 10.1038/protex.2017.049 [DOI] [Google Scholar]
- 35.Zheng GXY et al. Massively parallel digital transcriptional profiling of single cells. Nat. Commun 8, 1–12 (2017). [DOI] [PMC free article] [PubMed] [Google Scholar]
- 36.Butler A, Hoffman P, Smibert P, Papalexi E & Satija R Integrating single-cell transcriptomic data across different conditions, technologies, and species. Nat. Biotechnol 36, 411–420 (2018). [DOI] [PMC free article] [PubMed] [Google Scholar]
- 37.Arya S, Mount D, Kemp SE & Jefferis G RANN: Fast Nearest Neighbour Search (Wraps ANN Library) Using L2 Metric. R package version 2.6. (2018). [Google Scholar]
- 38.McDavid A, Finak G & Yajima M MAST: Model-based Analysis of Single Cell Transcriptomics. R package version 161 (2018). [Google Scholar]
- 39.Wolock SL, Lopez R & Klein AM Scrublet: computational identification of cell doublets in single-cell transcriptomic data. bioRxiv 1–18 (2018). [DOI] [PMC free article] [PubMed] [Google Scholar]
- 40.Liaw A & Wiener M Classification and Regression by randomForest. R News 2, 18–22 (2002). [Google Scholar]
Associated Data
This section collects any data citations, data availability statements, or supplementary materials included in this article.
Supplementary Materials
Data Availability Statement
Single-cell RNA-seq data that support the findings of this study have been deposited at Gene Expression Omnibus, accession number GSE129519, and at the Single Cell Portal (portals.broadinstitute.org/single_cell/study/reproducible-brain-organoids). The reference datasets used for comparison are available in the Gene Expression Omnibus at accession numbers GSE86153, GSE116470, and GSE103723, or in dbGaP at accession phs000989.v3, and phs000424.v8.p1.


