Abstract
Background:
For patients with peanut allergy, there are currently no methods to predict who will develop sustained unresponsiveness (SU) after oral immunotherapy (OIT).
Objective:
Assess IgE binding to peanut (PN), Ara h 2 and to specific linear epitopes of Ara h 2 as predictors of the important clinical parameters: eliciting dose threshold and attainment of SU following OIT.
Methods:
Samples and clinical data were collected from children undergoing OIT. PN- and Ara h 2-sIgE were quantified by ImmunoCap®. IgE binding to linear peptides of Ara h 2 and Ara h 6 was measured with peptide microarrays.
Results:
Lower values of PN-sIgE correlated with eliciting dose (P = 0.001) and with a higher likelihood of achieving SU (P < 0.0001) but these relationships were lost at higher values for PN-sIgE (≥ 14 kIU for eliciting dose and ≥ 35 kIU/L for SU). In subjects with PN-sIgE ≥ 14kIU/L, binding of IgE to epitopes 5 & 6 of Ara h 2 was associated with a lower eliciting dose at baseline challenge (P < 0.001; Pc < 0.02). In subjects with PN-sIgE ≥ 35kIU/L, a combined model of IgE binding to epitopes 1, 5 and 6 with PN-sIgE was highly predictive of attainment of SU (AUC of 0.86; P = 0.0067).
Conclusion:
In young patients with peanut allergy, measurement of PN-sIgE and IgE binding to specific linear epitopes of Ara h 2 in baseline samples may allow stratification of patients regarding sensitivity to challenge and outcome of OIT.
Keywords: allergens, food allergy, IgE, immunotherapy, peanut allergy, tolerance induction
1. INTRODUCTION
IgE-mediated food allergy, particularly to peanuts (PN), is a major health problem, affecting 1–4% of children in the United States and northern Europe.1–4 Oral immunotherapy (OIT) is generally associated with favorable outcomes including attainment of sustained unresponsiveness (SU). 5–9 SU is most likely to occur in subjects who start with lower levels of peanut-sIgE and particularly in subjects who begin OIT at a younger age.10 Although the basophil activation test correlates with severity and threshold of allergic reactions to PN,11, 12, additional biomarkers, particularly that do not need live cells, are needed to predict sensitivity to challenge and new biomarkers are needed to predict who will develop SU after OIT.
Among the 17 known PN allergens13, the highly homologous 2S albumins, Ara h 2 and Ara h 6, are the most potent for eliciting IgE-mediated mast cell activation.14–17 Measurement of specific IgE to either Ara h 2 or Ara h 6 has higher diagnostic value for predicting clinically relevant PN allergy than does measurement of IgE to other peanut proteins.18, 19
Patterns of IgE binding to linear epitopes of peanut allergens in microarray immunoassays have described both positive20–22 and negative23 correlations between the complexity of epitopes identified and the presence of clinically relevant peanut allergy.
This study was designed to explore, in a cohort of children undergoing OIT, possible associations of PN- or Ara h 2-sIgE and/or of IgE binding to linear epitopes of Ara h 2 and Ara h 6 with either sensitivity to peanut allergens during challenge or the attainment of sustained unresponsiveness (SU) as described in the next section.
2. METHODS
2.1. Subjects and samples
Samples of plasma were obtained from a study of OIT in preschool children with suspected or known peanut allergy, the DEVIL study.10 The analysis of these samples at the University of Colorado, Denver were approved by the respective institutional review boards and either the parents or guardians for all subjects gave informed consent. Single aliquots of plasma, obtained prior to challenge and OIT, were thawed once and refrozen in aliquots at −80°C.
The DEVIL study enrolled a total of 49 subjects, 9–36 months of age who were peanut allergic or peanut sensitized (Table E1). The first 40 subjects enrolled in the study were previously reported10 as that was the sample size required by the power analysis. Of the 49 subjects enrolled, 46 reacted with clinically significant signs and symptoms to an open label challenge at doses ranging from 1 mg to 300 mg of peanut protein (the eliciting dose). For those successfully completing OIT, peanuts were withheld for 4 weeks and a final double blind placebo controlled challenge was performed. SU was defined as lack of reactivity to a challenge with 5000 mg of peanuts at this final challenge. Those who either withdrew or completed the study and did not achieve SU were grouped together as not achieving SU.
Measurement of IgE binding to specific linear epitopes of Ara h 2 and Ara h 6 was limited to samples with PN-IgE of ≥ 14 IU/ml, a criterion for our previous study that allowed optimal detection of IgE binding to epitopes 23 and, at least for older children, identifies a group of patients with a high likelihood of having a positive PN challenge.24 Of the 46 subjects enrolled, 27 had baseline PN-sIgE of ≥14 kIU/L. Four samples were not studied due to insufficient numbers of microarrays, leaving 23 samples that were analyzed in this study (Table E2).
2.2. Peptides and microarray printing
A library of 77 peptides, consisting of 20 amino acids (AAs) in length overlapping by 17 AAs (offset of 3) covering the entire sequence of Ara h 2 and its isoforms, and Ara h 6 and its isoforms was synthesized as previously described.23
2.3. Assays
Peanut-specific IgE (PN-sIgE), peanut-specific IgG4 (PN-sIgG4) and Ara h 2-specific IgE (Ara h 2-sIgE) were determined by ImmunoCap®. For the microarray assays, all samples of plasma were assayed as previously described.23 Each sample was studied 2–3 times on separate days and the data were averaged. Within assay coefficient of variance (CV) ranged from 16 – 22% with a mean of 18 ± 2%. Between assay CV was determined for three sera that were assayed on 3 – 11 separate days. For peptides that were part of epitopes that had a Z score >3 (see below), the between assay CV ranged from 17–61% with a mean of 39 ± 2%.
2.4. Statistics
R statistical software25 and GraphPad Prism 5.0c for the Macintosh (GraphPad; La Jolla, CA) were used to generate graphs and for statistical analysis. For analysis of sIgE levels (PN, Ara h 2 and for specific peptides) and for eliciting dose, the data were log10 transformed prior to statistical analysis. The following statistical tests were used: Spearman rank order correlation coefficients for correlations; Student’s t-test for comparison of geometric means of the log-transformed continuous variables; and Fisher’s exact test for comparing frequencies of two possible outcomes. We assessed binding of IgE to 77 overlapping peptides (as described above) and quantified binding to the 15 epitopes that were previously identified from IgE binding to these peptides.23 So, where applicable, we used a Bonferroni correction of 15. Corrected P values are denoted as Pc. Once we identified specific epitopes of importance (epitopes 1, 5 and 6 of Ara h 2; see below), we no longer did multiple comparisons. P values of ≤ 0.05 were considered to be significant. All comparisons except the receiver operating curve (ROC) analyses were two-sided. The ROC curves were generated with R using the ggplot2 package26 and were based on logistic regression models. All AUC data were compared to an AUC of 0.5 using a one-sided Wilcoxon test for which P < 0.025 denotes a significant difference.
Z-scores for individual peptides were calculated similarly to what we previously described.23 First, measurements for each sample run of different slides were quantile normalized to reduce interassay variability. Next, we let
where m() denotes the median, and mad denotes the median absolute deviation calculated using the mad function in the R stats, each package 25 with default values. This formula is our preference as to how to state the calculation of Z-scores and gives the same results as the formula described previously.23 Binding to an individual peptide was considered to be positive if the z-score was >3 (signal was significantly (P < 0.003) above the background).
2.5. Definition of an epitope and of positive binding of IgE to an epitope
Epitopes were defined as previously described 23 except that, on 4 occassions (out of a total of 345), we elected to call positive binding where there was a very focused immune response for an epitope such that there were significant (z-score > 3) binding to several peptides within an epitope but the mean z-score for the previously determined epitopes was <3.
3. RESULTS
3.1. Eliciting dose
In subjects enrolled in the DEVIL study, there was an inverse relationship between the dose of peanut protein that elicited symptoms and levels of PN-sIgE (r = −0.479, P = 0.001) (Figure 1A). The relationship between PN-sIgE and eliciting dose was also seen for subjects with PN-sIgE<14 kIU/L (r = −0.460; p=0.048) (Figure 1 B) but not for those with PN-sIgE ≥ 14 kIU/L (r = −0.103; p = 0.610) (Figure 1C). There was also an inverse relationship between the eliciting dose and levels of Ara h 2-sIgE (r = −0.457; p = 0.005) (Figure 1D), but this did not hold up if the total cohort was divided into those with PN-sIgE < 14 kIU/L (r = −0.132; p = 0.512) (Figure 1E) and those with with PN-sIgE ≥ 14 kIU/L (r=0.105; p=0.675) (Figure 1F). We also examined levels of PN-sIgG4. There was no relationship between levels of PN-sIgG4 and eliciting dose (r=−0.071; p=0.637; data not shown). The ratio of PN-sIgE/IgG4 did correlate with eliciting dose (r=−0.534; p<0.0001; data not shown) but this was not substantially different from the data with PN-IgE alone.
FIGURE 1.
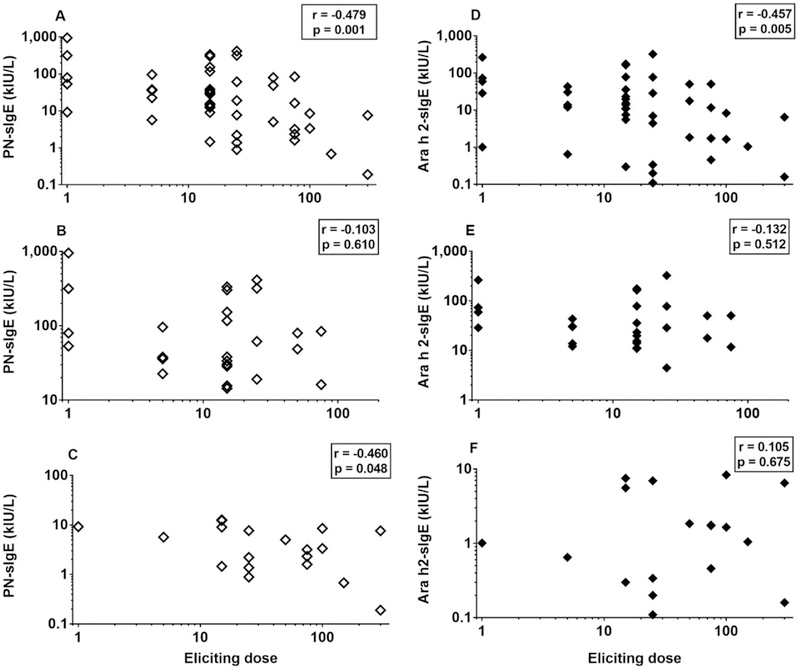
Increased levels of PN-sIgE are associated with lower eliciting dose upon oral challenge (A-C). This is true for the entire cohort (A) and for those with PN-sIgE < 14 kIU/L. However, this is not seen in those with PN-sIgE ≥ 14 kIU/L (C). Increased levels of Ara h 2-sIgE are also associated with lower eliciting dose upon oral challenge, but for the entire cohort (D). This relationship was not seen in the sub-groups with PN-sIgE < 14 kIU/L or with PN-sIgE ≥14 kIU/L (E, F). Data shown are for those who reacted to the initial challenge in the DEVIL study (n=46) (A, D) and for those who reacted and had PN-sIgE < 14 kIU/L (B, E) and those with PN-sIgE ≥ 14 kIU/L (C, F) (see Table E1).
We then examined the IgE binding to individual epitopes of Ara h 2 and Ara h 6 in samples with PN-sIgE ≥ 14 kIU/L as described in the methods section. Prior to correction for multiple comparisons, there was a suggestion of a relationship between binding to epitope 5 (n=3; P = 0.0975; Pc = 1) (not shown) and epitope 6 (n=4; P = 0.0128; Pc = 0.192) (not shown) of Ara h 2 and the eliciting dose. However, when binding to either epitope 5 or epitope 6 (n=5) was examined, there was a much stronger relationship with lower eliciting dose. Those subjects whose IgE bound either of these epitopes were more likely to have a lower eliciting dose (P < 0.0005; Pc = 0.008) (Figure 2A). However, the strength of the signals (epitopes 5 + epitope 6 combined) showed only a weak inverse correlation with the eliciting dose (r = −0.431; P = 0.04) (Figure 2B).
FIGURE 2. IgE binding to epitopes 5 and 6 is associated with lower eliciting dose upon oral challenge.
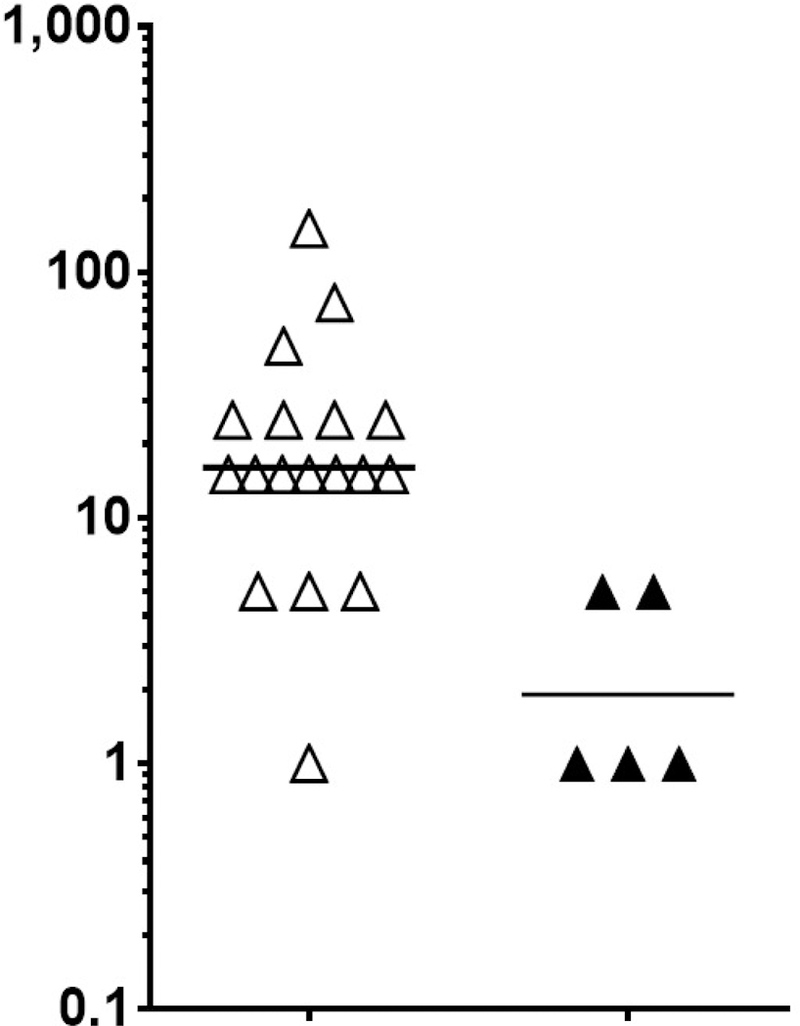
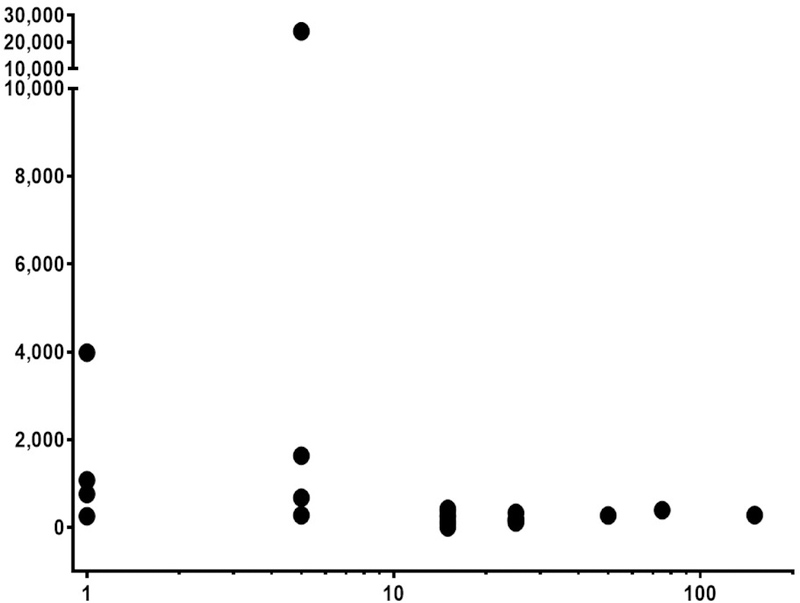
A) Subjects (n = 23; all with PN-sIgE of ≥ 14 kIU/L) were separated into those that did not have strong evidence of binding to either epitope 5 or epitope 6 (z < 3; open triangles) and those that had strong evidence of binding (z ≥ 3; closed triangles) (see Table E2). B) The raw data (signal from epitope 5 plus the signal from epitope 6) are plotted against the eliciting dose.
3.2. Attainment of SU
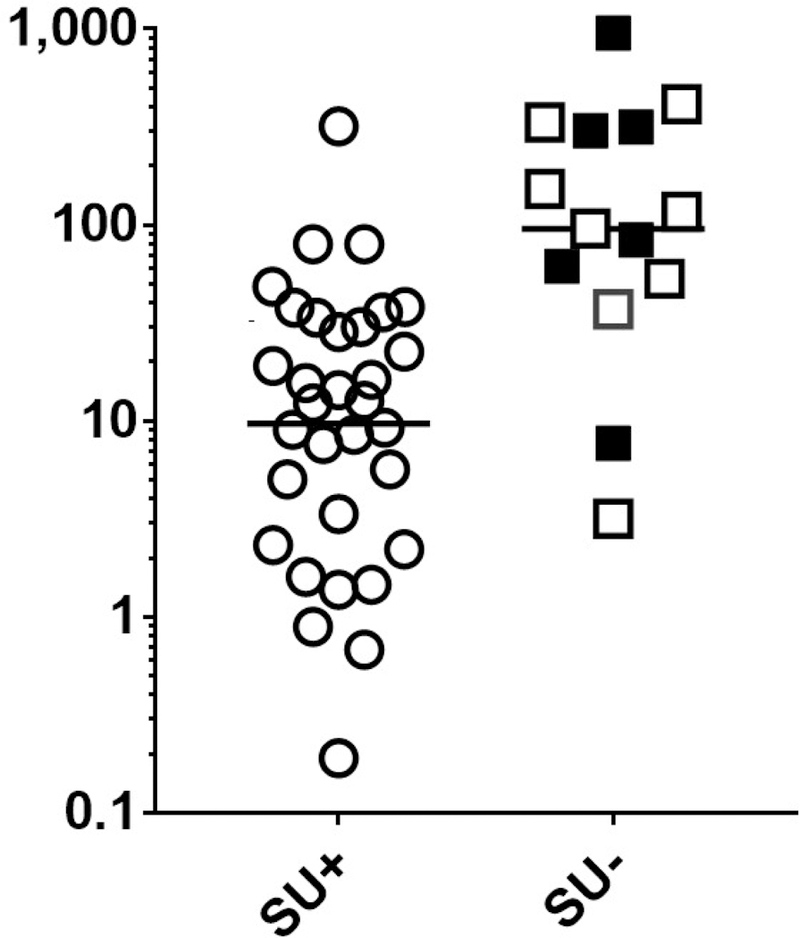
As was initially reported with the first 40 subjects from the DEVIL study10, we found a strong inverse relationship between both PN-sIgE (Figure 3A) and Ara h 2-sIgE (Figure 3B) and achievement of SU (P < 0.0001 for each). We then examined our data for possible cut-off values. Visual examination of the data for those who did not achieve SU (squares in Fig 3), suggested a demarcation at PN-sIgE of 35 kIU/L (dashed line, Figure 3A) and Ara h 2-sIgE of 24 kIU/L (dashed line, Figure 3B). Those achieving SU were much more likely to have PN-sIgE of < 35 kIU/L (25 of 32 =78%) than those not achieving SU (2 of 14 = 14%) (P < 0.0001). Also, those achieving SU were much more likely to have Ara h 2-sIgE of < 24 kIU/L (27 of 31 = 87%) than those not achieving SU (2 of 14 = 14%) (P < 0.0001). Looking at these data from the stand-point of these cut-off values, 25 of 27 (93%) of those with PN-sIgE < 35 kIU/L and 25 of 27 (93%) of those with Ara h 2-sIgE < 24 kIU/L achieved SU whereas, for those with PN-sIgE ≥ 35 kIU/L, only 7 of 20 (35%) achieved SU and for those with Ara h 2-sIgE ≥ 24 kIU/L, only 4 of 16 (25%) achieved SU (Figure 3A and Figure 3B). Specificity, sensitivity, positive predictive value (PPV) and negative predictive value (NPV) for these cut-offs are shown in Table E3. So, for subjects with PN-sIgE < 35 kIU/L or Ara h 2-sIgE of <24 kIU/L there is a strong relationship with attainment of SU (PPV=0.93). However, for those with PN-sIgE of ≥ 35 kIU/L, there was not a clear relationship between the level of either PN-sIgE (Figure 4A) or Ara h 2-sIgE (Figure 4B) and attainment of SU. Of note, there were no significant differences in PN-sIgE, Ara h 2-sIgE or IgE binding to epitopes between those who withdrew and those who completed the study but did not achieve SU (Figures 3 and 4). We then asked if the frequency or strength of binding of IgE to epitopes of Ara h 2 or Ara h 6 were related to the outcome of SU in this group. Of the 15 epitopes examined, IgE binding only to epitope 1 of Ara h 2 showed a possible inverse relationship to achievement of SU (Figure 4C; P = 0.0189; Pc = 0.284).
FIGURE 3. For all subjects, levels of PN-sIgE and Ara h 2-sIgE are inversely associated with attainment of sustained unresponsiveness.
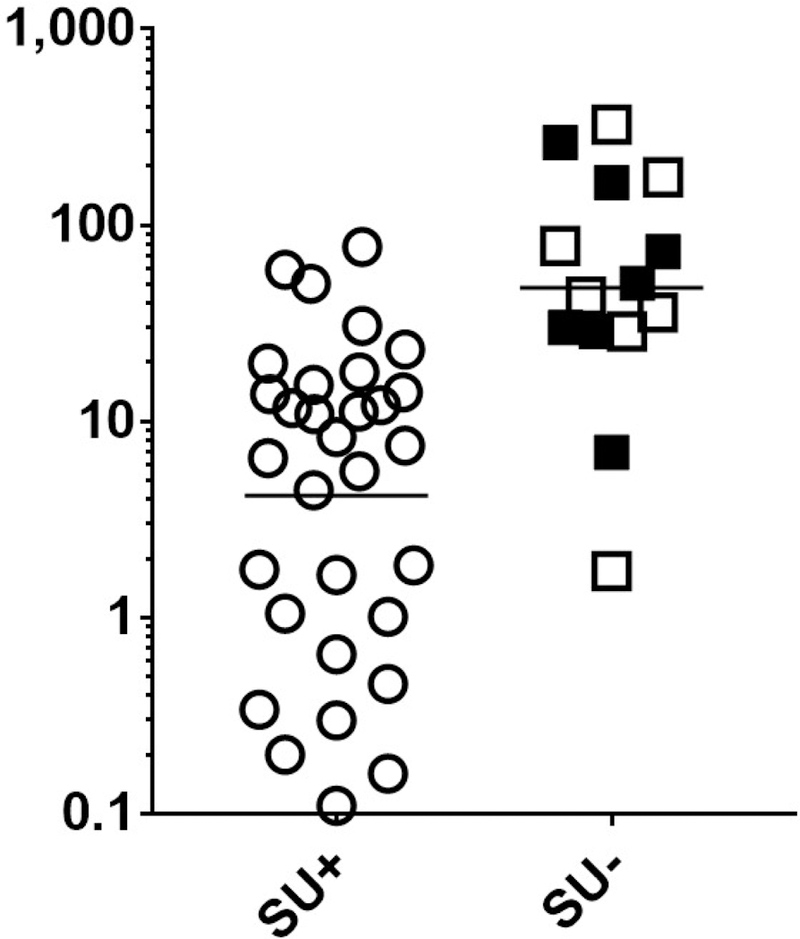
Data shown are for all who were dosed in the DEVIL study (n = 46) (A, B) (Table 1E). Data from subjects who did not achieve SU due to withdrawals are shown as filled squares and those who completed OIT and did not achieve SU are shown in open squares. Cut-offs of PN-sIgE of ≥ 35 kIU/L (dashed line in A) and ≥ 24 kIU/L (dashed line in B) are shown.
FIGURE 4. Among subjects with PN-sIgE of ≥ 35 kIU/L, IgE binding to epitope 1 of Ara h 2 is inversely associated with attainment of sustained unresponsiveness.
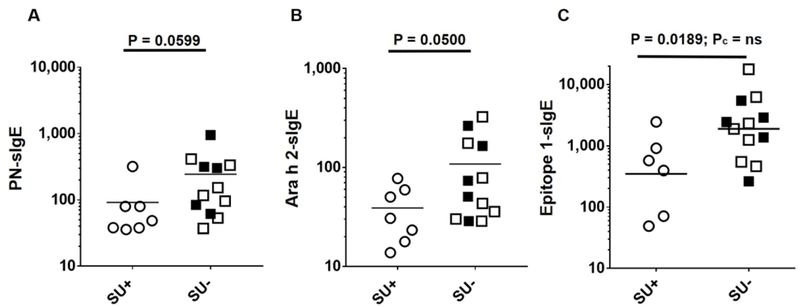
These are the samples with PN-sIgE of ≥ 35 kIU/L. A) PN-sIgE, B) Ara h 2-sIgE and C) binding of IgE to eitope 1 of Aa h 2. Data from subjects who did not achieve SU due to withdrawals are shown as filled squares and those who completed OIT and did not achieve SU are shown in open squares.
Finally, we examined the possibility that measuring IgE binding to epitopes of Ara h 2 may improve prediction of attainment of SU within the group with PN-sIgE ≥35 kIU/L. ROC analyses (Table E4 with selected data shown graphically in Figure 5) revealed that, for subjects with PN-sIgE ≥ 35 kIU/L, levels of PN-IgE were modestly related to attainment of SU (AUC = 0.76; P = 0.0415) whereas levels of Ara h 2-sIgE were not significantly related to attainment of SU (AUC = 0.71; P = 0.0871). For these subjects with PN-sIgE ≥ 35 kIU/L, PN-sIgG4 was not significantly related to attainment of SU (AUC=0.521; p=0.877) and the PN-sIgE/IgG4 ratio (AUC=0.740; p=0.076) was less useful than PN-sIgE alone. However, the strength of IgE binding to epitope 1 (AUC = 0.79; P = 0.0264) and to epitopes 1, 5 and 6 together (AUC = 0.82; P = 0.0160) were more strongly related to attainment of SU. Using PN-IgE levels and binding to epitopes 1, 5 and 6 as variables led to the highest AUC (AUC = 0.86; P = 0.0067).
FIGURE 5. Receiving operator curve.
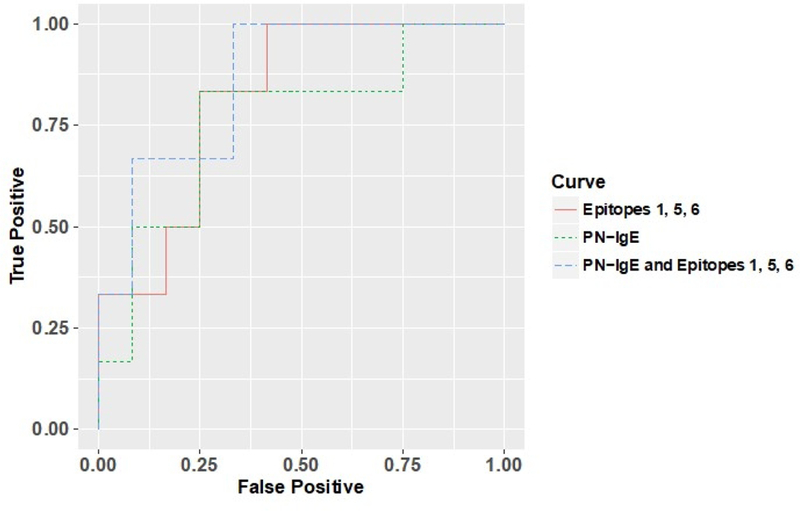
Data are shown for subjects with PN-sIgE of ≥35 kIU/L. An ROC curve for PN-sIgE (green dashed line), cumulative IgE binding to epitopes 1, 5 and 6 of Ara h 2 (orange solid line) and a composite analysis using PN-sIgE and cumulative IgE binding to epitopes 1, 5 and 6 of Ara h 2 (blue dashed line).
3.3. Localization of epitopes 1, 5 and 6 of Ara h 2.
Given the potential importance of IgE binding to epitopes 1, 5 and 6 of Ara h 2, we modeled the location of these epitopes onto the published structure of Ara h 2 and found that these epitopes localize to contiguous areas of Ara h 2 (Figure 6). This area on Ara h 2 overlaps to a large extent with an area on Ara h 6 that was identified by modeling PN-sIgE mimotopes to surface structures.27
FIGURE 6. Localization of epitopes 1, 5 and 6 on the reported structure of Ara h 2.
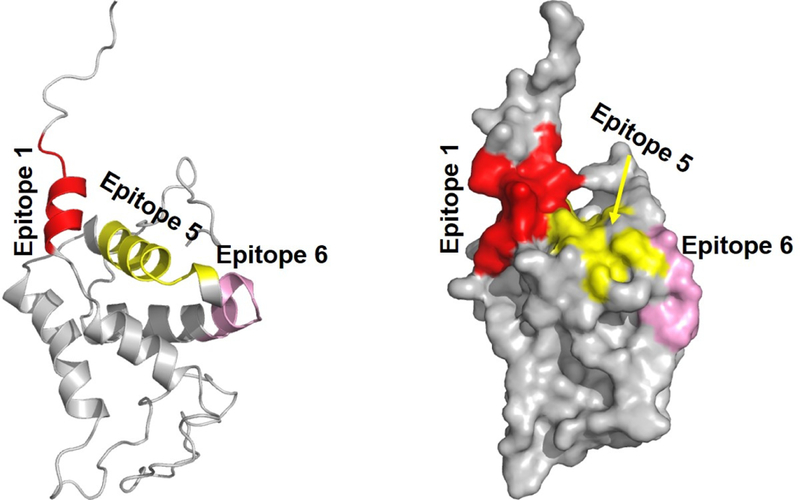
This is the X-ray crystal structure of Ara h 2 (PDB entry 3OB4) where the missing flexible loop regions were generated by modeling as described in27. A) ribbon structure and B) surface analysis. Epitopes are color coded: 1, orange, 5, yellow and 6, pink.
4. DISCUSSION
This study was designed to determine if measurement of PN-IgE, Ara h 2 IgE and/or IgE binding to linear epitopes of Ara h 2 and Ara h 6 have utility in the prediction of the sensitivity of peanut allergic subjects to ingested peanut protein and/or to outcomes of OIT. Samples were diluted to contain the same amounts of peanut-specific IgE, removing the potential confounder of varied amounts of PN-sIgE. Since PN-sIgE is highly correlated with Ara h 2-sIgE (r=0.93; P < 0.0001 in this study), normalizing on the PN-IgE data is similar to normalizing on the Ara h 2-IgE data.
There are several important findings from this analysis of data and samples from the DEVIL study.10 1) When all subjects are analyzed together, regardless of the level of sIgE, the eliciting dose in an open challenge with peanut protein administered prior to beginning OIT was inversely associated with levels of PN-sIgE or Ara h 2-sIgE (Figure 1A). For levels of PN-sIgE, this relationship was also seen for subjects with PN-sIgE of <14 kIU/L (Figure 1B) but was lost for those subjects with PN-sIgE of ≥ 14 kIU/L (Figure 1 C). 2) In subjects with PN-sIgE ≥ 14 kIU/L, the eliciting dose was inversely associated with IgE binding to epitopes 5 and 6 of Ara h 2 (Figure 2) and not associated with levels of PN-sIgE or Ara h 2-sIgE (Figures 1 C and 1 F). 3) When all subjects were analyzed together, lower levels of PN-sIgE and Ara h 2 sIgE were associated with the eventual attainment of SU (Figure 3 A,B). For those with PN-sIgE<35, the PN-sIgE data appear to be sufficient to predict outcomes from OIT, since 25 of 27 (93%) achieved SU. This was also true for Ara h 2-sIgE < 24 kIU/L where 28 of 30 (93%) achieved SU. However, for the patients with PN-sIgE ≥ 35, PN-sIgE was not a good predictor since only 7 of 19 (37%) achieved SU (Table E1 and Figure 3A). This was also true for Ara h 2-sIgE ≥ 24. 4) For subjects with PN-IgE ≥ 35 kIU/L, who have the highest risk of failing to achieve SU, levels of IgE binding to epitope 1 was associated with increased likelihood of not attaining SU, although there was considerable overlap (Figure 5C). In an ROC analysis, adding data from IgE binding to linear epitopes 1, 5 and 6 together improved the AUC and statistical significance (Table E4). 5) The linear epitopes identified in this study are potentially of clinical importance; epitopes 1, 5 and 6 of Ara h 2 fold together to form a patch that is homologous to an area on Ara h 6 that was identified by modeling PN-sIgE mimotopes to surface structures.27 Thus, this area of Ara h 2 which has now been identified in two independent analyses, may be particularly important in cross-linking allergen-sIgE leading to activation of mast cells.
There are a number of important caveats. 1) The subjects studied were all preschool children and these findings may not apply to older children or adults. 2) For IgE binding to linear epitopes, we only examined samples that had PN-IgE of ≥ 14 kIU/L. The cut-off of PN-sIgE of 14kIU/ml may be less relevant for these pediatric subjects who have been clinically challenged compared to older subjects (7–70 years).24 However, since we found that, for samples with PN-sIgE of < 35 kIU/L, the PN-sIgE data were as useful as the epitope data, it is unlikely that epitope data for subjects with PN-sIgE of < 14 kIU/L would be informative. 3) The SU failures include drop outs and those who completed the study, making this a potentially heterogeneous group. 4) The analysis of IgE binding to epitopes of Ara h 2 that focused on subjects with PN-sIgE ≥ 35 kIU/L was performed post hoc, possibly leading to inadvertent bias. 5) In the group of patients with PN IgE>35, only 2 out of 6 subjects who achieved SU (SU+) had epitope-1 specific IgE levels below any of the data points for the SU- group (Figure 4C) and the remaining 4/6 are indistinguishable based on the values observed. However, another way to look at these data is that 5 of 6 subjects with PN-sIgE>35 who achieved SU (SU+) had epitope-1 specific IgE levels below the mean of those in the SU- group. Furthermore, 11 of 12 subjects with PN-sIGE >35 who did not achieve SU (SU-) had epitope-1 specific IgE levels above the mean of those in the SU+ group (Figure 4C). Statistical analysis demonstrates these differences are significant with a p=0.0189).
In conclusion, for the children who participated in the DEVIL study, lower levels of PN-sIgE was an excellent predictor of sensitivity to challenge at baseline and to achievement of SU. Unexpectedly, the relationships of PN- or Ara h 2-sIgE levels to sensitivity to challenge were lost in those subjects with PN-sIgE of ≥14 kIU/L and the usefulness of measuring PN- or Ara h 2-sIgE levels for predicting the attainment of SU was lost in those subjects with PN-sIgE ≥ 35 kIU/L. In these settings, measurement of IgE binding to specific epitopes of Ara h 2 appears to have clinical value. Although these findings need to be validated in an independent cohort, it appears that, in addition to measuring PN-sIgE, measuring IgE binding to specific epitopes of Ara h 2 may be useful for stratifying patients prior to peanut challenges and prior to initiating OIT.
Supplementary Material
ACKNOWLEDGEMENTS
We thank all of subjects who participated in these studies.
Financial support: This work was supported by an R01-AI099029 (SCD), NIH NIAID K23 AI099083 (BPV), and NIH NIAID R01 AI068074 (AWB) NIH NIAID R21 AI 109090 (WB) and from divisional funds. Also, this work was supported by a grant from the National Center for Advancing Translational Science (NCATS) of the NH to the Colorado Clinical and Translational Sciences Institute (CCTSI), UL1TR002535. Contents are the authors’ sole responsibility and do not necessarily represent official NIH views.
SCD, XC, BPV, MK, AWB and WB have received grant support from the National Institutes of Health. BPV is a consultant to Aimmune Therapeutics. MG is an employee of Janssen Pharmaceuticals. AWB has received research grants from Food Allergy Research and Education (FARE), National Institutes of Health, and Wallace Research Foundation. Dr. Burks is a consultant on the advisory board for the following: Aimmune (Advisory Panel); Astellas Biomerica, Inc.; Evelo/Epiva Biosciences; GLG Research; Insys Therapeutics; PPD Development; Sanofi US Svcs, UKKO; and Valeant Pharma North America/consultant. Dr. Burks reports ownership interest in Allertein (minority stockholder).
Footnotes
Conflict of Interest Statement: DR, SSN, JC, SE and CMGM have no relevant conflicts of interest.
REFERENCES
- 1.Nwaru BI, Hickstein L, Panesar SS, et al. Prevalence of common food allergies in Europe: a systematic review and meta-analysis. Allergy. 2014;69:992–1007. [DOI] [PubMed] [Google Scholar]
- 2.Jones SM, Burks AW. Food Allergy. N Engl J Med. 2017;377:1168–1176. [DOI] [PubMed] [Google Scholar]
- 3.Dunlop JH, Keet CA. Epidemiology of Food Allergy. Immunol Allergy Clin North Am. 2018;38:13–25. [DOI] [PubMed] [Google Scholar]
- 4.Venter C, Sicherer SH, Greenhawt M. Management of Peanut Allergy. The journal of allergy and clinical immunology In practice. 2019;7:345–355 e342. [DOI] [PubMed] [Google Scholar]
- 5.Vickery BP, Ebisawa M, Shreffler WG, Wood RA. Current and Future Treatment of Peanut Allergy. The journal of allergy and clinical immunology In practice. 2019;7:357–365. [DOI] [PubMed] [Google Scholar]
- 6.Investigators PGoC, Vickery BP, Vereda A, et al. AR101 Oral Immunotherapy for Peanut Allergy. N Engl J Med. 2018;379:1991–2001. [DOI] [PubMed] [Google Scholar]
- 7.Remington BC, Krone T, Koppelman SJ. Quantitative risk reduction through peanut immunotherapy: Safety benefits of an increased threshold in Europe. Pediatr Allergy Immunol. 2018;29:762–772. [DOI] [PubMed] [Google Scholar]
- 8.Nachshon L, Goldberg MR, Katz Y, Levy MB, Elizur A. Long-term outcome of peanut oral immunotherapy-Real-life experience. Pediatr Allergy Immunol. 2018;29:519–526. [DOI] [PubMed] [Google Scholar]
- 9.Yee CSK, Albuhairi S, Noh E, et al. Long-Term Outcome of Peanut Oral Immunotherapy Facilitated Initially by Omalizumab. The journal of allergy and clinical immunology In practice. 2019;7:451–461 e457. [DOI] [PubMed] [Google Scholar]
- 10.Vickery BP, Berglund JP, Burk CM, et al. Early oral immunotherapy in peanut-allergic preschool children is safe and highly effective. J Allergy Clin Immunol. 2017;139:173–181 e178. [DOI] [PMC free article] [PubMed] [Google Scholar]
- 11.Song Y, Wang J, Leung N, et al. Correlations between basophil activation, allergen-specific IgE with outcome and severity of oral food challenges. Ann Allergy Asthma Immunol. 2015;114:319–326. [DOI] [PubMed] [Google Scholar]
- 12.Santos AF, Du Toit G, Douiri A, et al. Distinct parameters of the basophil activation test reflect the severity and threshold of allergic reactions to peanut. J Allergy Clin Immunol. 2015;135:179–186. [DOI] [PMC free article] [PubMed] [Google Scholar]
- 13.Anonymous. Allergen Nomenclature. http://www.allergen.org/search.php?allergensource=peanu&searchsource=Search, 2016.
- 14.Koppelman SJ, Wensing M, Ertmann M, Knulst AC, Knol EF. Relevance of Ara h1, Ara h2 and Ara h3 in peanut-allergic patients, as determined by immunoglobulin E Western blotting, basophil-histamine release and intracutaneous testing: Ara h2 is the most important peanut allergen. Clin Exp Allergy. 2004;34:583–590. [DOI] [PubMed] [Google Scholar]
- 15.Porterfield HS, Murray KS, Schlichting DG, et al. Effector activity of peanut allergens: a critical role for Ara h 2, Ara h 6, and their variants. Clin Exp Allergy. 2009;39:1099–1108. [DOI] [PMC free article] [PubMed] [Google Scholar]
- 16.Chen X, Zhuang Y, Wang Q, et al. Analysis of the Effector Activity of Ara h 2 and Ara h 6 by Selective Depletion from a Crude Peanut Extract. Journal of Immunological Methods. 2011;372:65–70. [DOI] [PMC free article] [PubMed] [Google Scholar]
- 17.Kulis M, Chen X, Lew J, et al. The 2S albumin allergens of Arachis hypogaea, Ara h 2 and Ara h 6, are the major elicitors of anaphylaxis and can effectively desensitize peanut-allergic mice. Clinical and Experimental Allergy. 2012;42. [DOI] [PMC free article] [PubMed] [Google Scholar]
- 18.Kukkonen AK, Pelkonen AS, Makinen-Kiljunen S, Voutilainen H, Makela MJ. Ara h 2 and Ara 6 are the best predictors of severe peanut allergy: a double-blind placebo-controlled study. Allergy. 2015;70:1239–1245. [DOI] [PubMed] [Google Scholar]
- 19.Beyer K, Grabenhenrich L, Hartl M, et al. Predictive values of component-specific IgE for the outcome of peanut and hazelnut food challenges in children. Allergy. 2015;70:90–98. [DOI] [PubMed] [Google Scholar]
- 20.Shreffler WG, Lencer DA, Bardina L, Sampson HA. IgE and IgG4 epitope mapping by microarray immunoassay reveals the diversity of immune response to the peanut allergen, Ara h 2. J Allergy Clin Immunol. 2005;116:893–899. [DOI] [PubMed] [Google Scholar]
- 21.Flinterman AE, Knol EF, Lencer DA, et al. Peanut epitopes for IgE and IgG4 in peanut-sensitized children in relation to severity of peanut allergy. J Allergy Clin Immunol. 2008;121:737–743 e710. [DOI] [PubMed] [Google Scholar]
- 22.Lin J, Bruni FM, Fu Z, et al. A bioinformatics approach to identify patients with symptomatic peanut allergy using peptide microarray immunoassay. J Allergy Clin Immunol. 2012;129:1321–1328 e1325. [DOI] [PMC free article] [PubMed] [Google Scholar]
- 23.Otsu K, Guo R, Dreskin SC. Epitope analysis of Ara h 2 and Ara h 6: characteristic patterns of IgE-binding fingerprints among individuals with similar clinical histories. Clin Exp Allergy. 2015;45:471–484. [DOI] [PMC free article] [PubMed] [Google Scholar]
- 24.Maloney JM, Rudengren M, Ahlstedt S, Bock SA, Sampson HA. The use of serum-specific IgE measurements for the diagnosis of peanut, tree nut, and seed allergy. J Allergy Clin Immunol. 2008;122:145–151. [DOI] [PubMed] [Google Scholar]
- 25.R Core Team. R: A language and environment for statistical computing. 2013; http://www.R-project.org/, 2018.
- 26.Wickham H ggplot2: Eleant Graphics for Data Analysis. New York: Springer-Verlag; 2016. [Google Scholar]
- 27.Chen X, Negi SS, Liao S, Gao V, Braun W, Dreskin SC. Conformational IgE epitopes of peanut allergens Ara h 2 and Ara h 6. Clin Exp Allergy. 2016;46:1120–1128. [DOI] [PMC free article] [PubMed] [Google Scholar]
Associated Data
This section collects any data citations, data availability statements, or supplementary materials included in this article.


