

Abstract
Background:
Impairment of executive function (EF), the goal-directed regulation of thoughts, actions, and emotions, drives negative outcomes and is common across neurodevelopmental disorders including Attention Deficit Hyperactivity Disorder (ADHD) and Autism Spectrum Disorder (ASD). A primary challenge to its amelioration is heterogeneity in symptom expression within and across disorders. Parsing this heterogeneity is necessary to attain diagnostic precision, a goal of the NIMH Research Domain Criteria Initiative. We aimed to identify transdiagnostic subtypes of EF that span the normal to impaired spectrum and establish their predictive and neurobiological validity.
Methods:
Community detection was applied to clinical parent-report measures in 8-14 year-old children with and without ADHD and ASD from two independent cohorts (Discovery N=320; Replication N=692) to identify subgroups with distinct behavioral profiles. Support vector machine (SVM) classification was used to predict subgroup membership of unseen cases. Preliminary neurobiological validation was obtained with existing functional magnetic resonance imaging (fMRI) data on a subsample (N=84) by testing hypotheses about sensitivity of EF subgroups versus DSM categories.
Results:
We observed three transdiagnostic EF subtypes characterized by behavioral profiles that were defined by relative weakness in: 1) flexibility and emotion regulation; 2) inhibition; and 3) working memory, organization, and planning. The same tripartite structure was also present in the typically developing children. SVM trained on the Discovery sample and tested on the Replication sample classified subgroup membership with 77.0% accuracy. Split-half SVM classification on the combined sample (N=1012) yielded 88.9% accuracy (this SVM is available for public use). As hypothesized, frontal-parietal engagement was better distinguished by EF subtype than DSM-diagnosis and the subgroup characterized with inflexibility failed to modulate right IPL activation in response to increased executive demands.
Conclusions:
The observed transdiagnostic subtypes refine current diagnostic nosology and augment clinical decision-making for personalizing treatment of executive dysfunction in children.
Introduction
Goal-directed regulation of thoughts, actions and emotions is impaired in multiple developmental disorders. Regulatory processes collectively termed executive function (EF) allow for managing oneself and our resources flexibly in the pursuit of goals. A stronger predictor of school achievement than IQ (Blair & Razza, 2007), childhood EF profoundly impacts adult outcomes, including socioeconomic status (SES) and likelihood of criminal conviction, even after controlling for SES and IQ (Moffitt et al., 2011). Processes comprising EF reflect a spectrum, manifested as dispositional traits at the normative end and psychopathology at the maladaptive end. Current symptom nosology for identifying EF impairment is limited in capturing heterogeneity observed within and across disorders.
EF impairment is only partially captured by symptoms of inattention, hyperactivity, and impulsivity that define ADHD (American, Psychological, & Association, 2013). These symptoms rarely occur in isolation, however, as ADHD is highly associated with emotional dysfunction, expressed as internalizing (odds ratio= 4.1) and externalizing (odds ratio=10.0) symptoms or their combination (odds ratio=10.6) (Yoshimasu et al., 2012). Such a pattern of comorbidity suggests that regulatory dysfunction is not limited to domains of attention and action, but also includes emotion. Indeed, discovery methods applied to temperamental traits distinguished ADHD subtypes defined by high positive and negative emotionality (Karalunas et al., 2014). The presence of comorbidity, suggestive of multiple causal pathways (Nigg, 2013), poses a major clinical challenge as it enhances symptom heterogeneity and confounds treatment efficacy (Jensen et al., 2001).
The challenge is also illustrated by ASD. A large proportion of autistic children meet criteria for ADHD (41%-78% (Murray, 2010). Furthermore, 1 in 5 children diagnosed with ASD have a pre-existing ADHD diagnosis (Miodovnik, Harstad, Sideridis, & Huntington, 2015). Comorbid ADHD exacerbates ASD social symptoms (Sprenger et al., 2013) and relates to worse adaptive function (Yerys et al., 2009), quality of life (Sikora, Vora, Coury, & Rosenberg, 2012), and intervention outcomes (Lecavalier et al., 2017), prompting incorporation of concurrent diagnoses in DSM-5 and clinical practice guidelines (Mahajan et al., 2012). Executive dysfunction in ASD extends to domains not queried by DSM criteria for ADHD (e.g., flexibility/shifting) and occurs concurrently with internalizing and externalizing symptoms (Vaillancourt et al., 2017), suggesting that regulatory impairment encompasses attention, action, and emotion. Furthermore, impairment is progressive, increasing from childhood to adolescence (Rosenthal et al., 2013); persistent, continuing despite amelioration of core ASD symptoms (Troyb et al., 2014); and drives negative outcomes (Pugliese et al., 2015).
A primary barrier to addressing comorbid EF impairment is the limitation of current nosology to capture heterogeneity within and across disorders. Based upon performance on laboratory tasks, neuropsychological models cast EF as “cognitive control”, a latent construct reflecting prefrontal cortex mediated processes such as working memory, response inhibition, shifting, and response selection (Miyake et al., 2000), in addition to planning and fluency (Pennington, 1997). Using parent reports of everyday behavior, selectively greater deficits have been observed in working memory and inhibition for ADHD (Davidson, Cherry, & Corkum, 2015) and set-shifting for ASD (Gioia, Isquith, Kenworthy, & Barton, 2002). However, deficits across all parent-reported domains have been reported for both disorders (Kenworthy, Yerys, Anthony, & Wallace, 2008; Lai et al., 2017; Pennington & Ozonoff, 1996) with modest and variable effect sizes on laboratory tasks for discriminating between ADHD and TD (d=.46-.69) (Willcutt, Doyle, Nigg, Faraone, & Pennington, 2005) and ASD and ADHD (k=.38-.40) (Geurts, Verte, Oosterlaan, Roeyers, & Sergeant, 2004). Furthermore, this conceptualization of EF ignores interaction with emotional processing, often termed “hot EF” (Zelazo, 2012), a notable limitation considering high comorbidity with internalizing and externalizing psychopathology reviewed earlier. Indeed, set-shifting and inhibition predicted internalizing and externalizing psychopathology in ASD and ADHD (Lawson et al., 2015). Thus, emotion dysregulation likely accounts for substantial shared variance between ADHD and ASD. In consideration of the high comorbidity between ASD, ADHD, and internalizing and externalizing symptoms, adopting a transdiagnostic approach to parsing EF heterogeneity ought to be promising.
We applied a data-driven approach to two cohorts of ASD, ADHD, and TD children as follows: First, in contrast to a measure-centric approach common for identifying theoretical EF dimensions, our people-centric approach addresses the clinical challenge of identifying which child has what type of EF deficit, regardless of DSM category. This requires classifying children into distinct subgroups, each defined by a distinctive behavioral profile. In contrast to latent class models that most often classify according to severity, we used graph-theory based community detection (introduced by (Fair, Bathula, Nikolas, & Nigg, 2012), which is one of the methods that detects structure in networks by optimizing segregation among participants into communities based on correlation across behavioral features, without apriori specification of the number of communities; correlation rather than Euclidian distance is used because it does not assume that behavioral features have similar distributions. This method is well-suited for identifying subgroups composed of similar individuals among individuals differing on multiple dimensions. To the extent that the selected behavioral feature-set adequately captures regulation of attention, action, and emotion, the observed community structure reveals subtypes of EF that are distinguished by behavioral profiles. Second, we determined whether the same subtypes are observed in normative behavior, as predicted by spectrum models of psychopathology (Posner & Rothbart, 2000). If confirmed, the behavioral profile distinguishing each subtype represents a behavioral dimension of EF with distributions spanning the normal-to-impaired spectrum. Third, we prioritized clinical relevance by using as features for community detection, scores on parent-report measures assessing: ADHD symptoms (ADHD Rating Scale, ADHD-RS); (DuPaul, Power, Anastopoulos, & Reid, 1998), emotional problems (Child Behavior Checklist - CBCL) (Achenbach, 2009), and EF (Behavior Rating Inventory for EF - BRIEF) (Gioia, Isquith, Guy, & Kenworthy, 2000). Use of easy-to-administer and common clinical measures enhances the clinical utility of the discovered community structure, which upon validation can be used for subtyping future cases.
Discovered subtypes were validated through independent replication, machine learning techniques, and association with neural biomarkers. First, we sought independent replication (N=692) of the community structure obtained from the discovery sample (N=320). Second, as individual classification is essential for translation to the clinic, we tested predictive validity using support vector machine (SVM) learning, by training on the discovery sample and testing on the replication sample. As a further test of generalizability for the purpose of creating a publicly available tool for subtyping individual future cases, we capitalized on the large combined sample (N=1012) for split-half validation, training a second SVM on N=506 and testing on the other half.
Third, we sought preliminary neurobiological validation using an existing fMRI dataset (N=84) from the discovery sample, in which each participant completed two fMRI runs differing in EF demands. Critically, contrasting the two runs allows for testing anatomical hypothesis about flexibility of attentional modulation from attention network theory: manipulation of task-relevance of salient information between the two runs taps attentional reorienting (Corbetta & Shulman, 2002) or updating of task context (Geng & Vossel, 2013), which engages ventral attention network regions of right inferior parietal lobule (rIPL) and right inferior frontal gyrus (rIFG). The rIPL, in particular, is sensitive to shifting of visual attention in the context of task-relevance (Krall et al., 2015) such as that evoked here by visually salient distractors. We tested two hypotheses: 1) grouping based on community detection derived EF-subtypes will account for more variance in neural engagement during selective attention even under low-EF demand than that based on DSM diagnoses and 2) ventral attention network regions, rIPL and rIFG, will increase response to salient distractors (relative to non-salient distractors) in the “top-down” run in which distractors are task-relevant relative to the “bottom-up” run in which distractors are not task-relevant. Such modulation by task-context ought to be sensitive to individual differences in cognitive flexibility. In light of the observed results from community detection, the EF subgroup defined by inflexibility ought to have weaker modulation of ventral-attention regions relative to the other EF subgroups, manifesting a significant Run X Group interaction with EF subgroups but not with DSM groups.
Methods
Participants
Data from two independent samples (8-14 years, IQ>70, no medical diagnosis) with primary diagnosis of ADHD, ASD or none were extracted from respective databases of participants in research studies. Each site obtained the measures from parents in the context of an assessment appointment; only children with complete data were included in the study. See online Appendix S1. for recruitment, inclusion/ exclusion criteria, demographics, and measures (Table S1–S2 and Figure S1). The discovery sample (N=320; 62.5% males; ASD:N=97, ADHD:N=84, and TD:N=139) was enrolled from 2005-2015 at Children’s National Hospital System (CNHS) and Georgetown University (GU). A subset (N=122) had undergone fMRI and of these N=84 met head motion criteria (ASD:N=21; ADHD:N=15; TD:N=48). The replication sample (N=692; 67.9% males; ASD:N=143, ADHD:N=223, TD:N=326) was enrolled from 2002-2016 at Kennedy Krieger Institute (KKI). ADHD and ASD diagnoses were based on DSM-IV-TR or DSM-5 criteria and ASD diagnosis was confirmed with the Autism Diagnostic Interview—Revised (ADI-R)(Lord, Rutter, & Le Couteur, 1994) and/or the Autism Diagnostic Observation Schedule—Generic (ADOS-G)(Lord et al., 2000) following the criteria established by the NICHD/NIDCD Collaborative Programs for Excellence in Autism (Lainhart et al., 2006). All children were part of past or ongoing research studies at each site and were recruited through institutional clinics.
Ethical Considerations
Participants provided written consent according to respective institutional guidelines. Community detection (CD) and SVM-based predictive validation (methods details in Appendix S1.)
Using the Louvain algorithm and a consensus clustering approach, CD was performed separately on the GU/CNHS and KKI cohorts, on 12 domain T-scores derived from three parent-report measures (ADHD-RS subscales - Inattention and Hyperactivity/Impulsivity, BRIEF domains - Inhibit, Shift, Emotional Control, Initiate, Working Memory, Plan/Organize, Organization of Materials, and Monitor, and CBCL Internalizing and Externalizing composites). Each participant’s z transformed T-scores were correlated to every other participant’s scores, creating square correlation matrices (r) providing distance information between any given participant pair. CD was applied to the matrices and behavioral profiles for communities (i.e., mean Z scores for the 12 domains, termed EF profiles) were assessed for similarity across samples by Pearson’s correlation. Association of EF profiles with gender was assessed with Cramer’s V, as effect size is more meaningful for interpretation with large samples than statistical significance.
Two SVMs were generated: 1) To test predictive validity of subtype classification, a classifier was trained on the CNHS/GU sample and tested on KKI sample; 2) To generate a clinical tool for classifying future cases, generalization was tested with split-half validation on the combined sample (N=1012), by randomly splitting into halves (N=506 each) matched for site, age, sex, and IQ; CD performed separately on each half determined independent subgroup membership (Table S3). Then, a SVM was trained on one half and tested on the remaining split-half sample.
Two more CD analyses were performed, first on the combined TD sample (N=465) to determine whether the same community structure observed above was evident in normative EF heterogeneity. Second, CD was applied to the combined sample (N=1012) to generate two parameters for describing the distributions of each EF subgroup. Area under curve (AUC) across the 12 T-scores was calculated for each participant as an index of severity, a higher AUC indicates more severe expression of the EF profile defining the subtype. In light of the large sample, the AUC distribution can serve as “norms” for comparing individual future cases classified with the split-half SVM - which AUC quartile the child falls in is informative of their degree of EF impairment associated with their subtype. Each individual’s within-module z-degree score (a community version of degree centrality) indicates their position within their subgroup such that those with high positive scores have more group members with profiles like them and thus, occupy central positions whereas those with high negative scores have fewer group members like them and thus, occupy peripheral positions within the group. Examination of the position of ASD, ADHD, and TD participants in these distributions for each subgroup provides insight into whether each EF profile cuts across DSM diagnoses.
Neurobiological validation: fMRI Protocol
Echo-planar images were acquired on a Siemens Trio 3T (3.0x3.0x3.0 mm, TR=2000ms, TE=30ms, flip=90°, FOV=192x192mm). Subjects’ head was stabilized with foam cushions and the task was back-projected via a mirror mounted on the headcoil. Each participant performed two runs of a sustained attention task (modified from (Zink, Pagnoni, Martin, Dhamala, & Berns, 2003), see Figure S2) that comprised two fMRI runs in which each stimulus was presented for 750 ms within a 2000 ms interstimulus interval. In both runs, distractors (small flickering shape) were flashed in the periphery, which were either visually-salient, comprising colorful shapes of different frequency to preserve novelty (on 25% trials) or familiar being always an open circle (on 25% trials); no distractors occurred on the remaining 50% of trials and 25% of trials contained the triangle-target. Both runs had 168 total trials lasting 5:46 mins, in a jittered event-related design using OPTSEQ2 (Dale, 1999). Instructions to the participants required a right-handed key-press response to a central target (triangle) in the first run, and therefore, peripheral distractors were unexpected and irrelevant to the task – this run is termed “bottom-up”. Instructions to the participants for the second run required performance of an additional task, a left-handed key-press response to a peripheral distractor target (red star) – this dual-task run is termed “top-down”. Thus, the peripheral distractors were task-irrelevant in the bottom-up run but task-relevant in the top-down run – this manipulation requires updating of task context across runs. Run order was not counterbalanced in order to preserve the unexpectedness of the distraction in the first, bottom-up run. Participants were instructed for the dual-task demands of the top-down run only after the end of the bottom-up run. Thus, both fMRI runs were identical in stimulus presentation differing only in EF demands, low in bottom-up run and high in the top-down run.
Imaging Analysis
Images were slice time and motion corrected, normalized to EPI template and resliced to 3mm, smoothed with 8mm FWHM and correct Salient vs. Familiar trial contrast specified for each participant in SPM12. For testing hypothesis #1, that EF-subtype would account for more variance than DSM diagnosis, a one-sample t-test (age, mean FD as covariates) for Salient vs. Familiar distractor trials in the Bottom-up run identified regions sensitive to the quality of distracting information (p < .05 FDR corrected: p<.0014, k>10 voxels). Activated clusters were used as regions of interest (ROIs) to extract mean parameter estimates to test which grouping, DSM groups or EF subgroups, yielded significant main effect, with separate and nested ROI X Group MANOVAs. To test hypothesis #2 about flexibility, activation change in response to updating task context, rIPL and rIFG ROIs from the group-average of the bottom-up run were applied to the Top-down run for extracting parameter estimates for the Salient vs. Familiar trial contrast. For each ROI, Run (bottom-up, top-down) X Group interaction was tested with separate ANOVAs for DSM and EF-subtype grouping. Significant interaction was followed up with t-tests examining difference between runs in each group.
Results
Community detection and SVM-based predictive validity
We obtained 3 communities (termed EF subgroups) with strong segregation in CNHS/GU (Q=.424), KKI (Q=.431) and combined (Q=.420) samples (Figure1, Table 1, Figure S3, Table S4). In each sample, one-way ANOVAs indicated that the three EF subgroups differed significantly on mean Z score for each EF measure (ps<.05-p<.001). For each sample, subgroups were predominantly male and did not differ in age, and IQ (ps>.5). The 3 EF profiles were highly similar between samples, rs=0.82-0.99, ps<0.001 and association with gender was weak, Cramer’s V (df=2): CNHS/GU=0.09, KKI=0.14, and Combined=0.12.
Figure1.
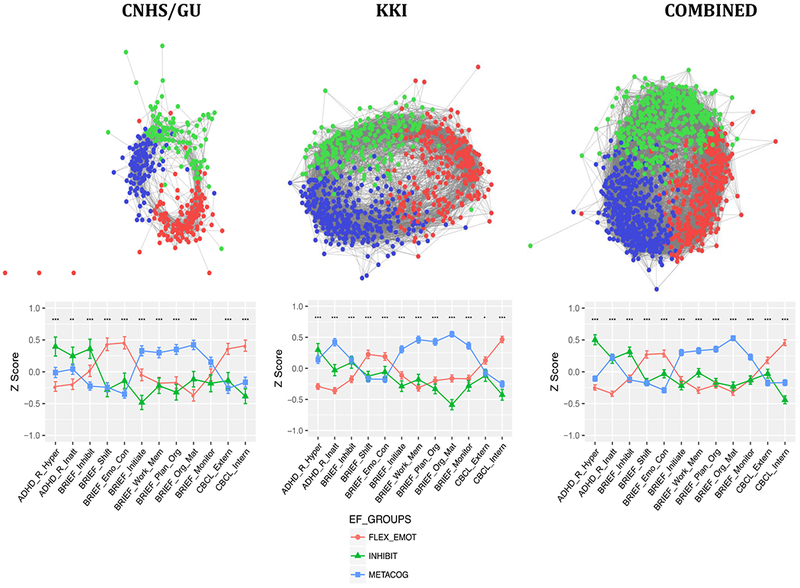
Results of community detection for each sample. For each sample, the top panel shows a spring-embedded graphical representation that is typically used to visualize the network structure of detected communities. Nodes correspond to individuals in each EF subgroup and length of connecting lines to the correlation between individuals. The graph is thresholded for visualization purposes at r=.6, which is sufficient to see clearly the network structure within each subgroup. However, reported results were generated with an unthresholded modularity algorithm as described in Methods and Appendix S1. Each community is color-coded corresponding to the legend in the graphs in the bottom panel, which plot mean Z scores (± SEM) showing the profile of each EF subtype - left to right, ADHD Rating Scale Hyperactivity/Impulsivity and Inattention; BRIEF Inhibit, Shift, Emotional Control, Initiate, Working Memory, Planning and Organization, Organization of Materials, and Monitor, and CBCL Internalizing and Externalizing symptoms. On the Y-axis, Z=0 indicates the sample mean, and higher z scores indicate higher impairment.
Table 1.
Number and percentage in parenthesis of children by DSM category in each EF subgroup for each sample.
| CNHS/GU | TD(%) | ASD(%) | ADHD(%) | Total |
|---|---|---|---|---|
| Flex_Emot | 57(41) | 52(53) | 29(33) | 138 |
| Inhibit | 32(23) | 12(12) | 20(24) | 64 |
| Metacog | 50(35) | 33(34) | 35(41) | 118 |
| Total | 139 | 97 | 84 | 320 |
| KKI | TD(%) | ASD(%) | ADHD(%) | Total |
| Flex_Emot | 151(46) | 70(48) | 31(13) | 252 |
| Inhibit | 86(26) | 31(21) | 86(38) | 203 |
| Metacog | 89(27) | 42(29) | 106(47) | 237 |
| Total | 326 | 143 | 223 | 692 |
| Combined | TD(%) | ASD(%) | ADHD(%) | Total |
| Flex_Emot | 208(44) | 122(50) | 60(19) | 390 |
| Inhibit | 118(25) | 43(17) | 106(34) | 267 |
| Metacog | 139(29) | 75(31) | 141(45) | 355 |
| Total | 465 | 240 | 307 | 1012 |
Note: Distribution of ASD children with comorbid ADHD is as follows – CNHS/GU: 16/52 (Flex_Emot), 7/12 (Inhibit), 9/33 (Metacog); KKI: 35/70 (Flex_Emot), 18/31 (Inhibit), 29/42 (Metacog).
Inspection of Figure 1 indicates that EF profiles defining each subgroup are remarkably similar between cohorts and for the full combined sample. EF profiles can be described by relative weaknesses (peaks in graph) as follows: “FLEX-EMOT” reflects primarily greater flexibility and emotional regulation problems, as suggested by peaks for BRIEF sub-domains of Shift, Emotional Control and CBCL Internalizing and/or Externalizing symptoms. “INHIBIT” reflects primarily greater problems with inhibition, as suggested by peaks for Hyperactivity/Impulsivity on the ADHD-RS and BRIEF Inhibit. “METACOG” had greater problems with Working memory, Planning, and Organization domains that contribute to the BRIEF Metacognition Index. These behavioral profiles cut across diagnostic categories, as the distribution of participants in each EF subgroup spans ASD, ADHD, and TD participants (Table 1); the distribution of ASD children with comorbid ADHD also cut across EF subgroups. For each sample, TD children are relatively evenly distributed across the three EF subgroups, whereas children with ASD and ADHD are disproportionally represented in the FLEX-EMOT and INHIBIT subgroups with more ASD children having the FLEX-EMOT profile and more ADHD children having the INHIBIT profile (, ps<.001). Figure 2 shows the distribution of AUC (Table S5) and within-module z-scores for each EF subgroup for the combined sample. For AUC (Figure 2A), TD participants are primarily represented in the first quartile, indicating lower impairment as expected; and ASD and ADHD children span the remainder of the range, indicating that degree of impairment is not associated with a specific diagnosis. Distribution of within-module z-scores (Figure 2B) shows that central/peripheral positions in the subgroup are not segregated by diagnosis.
Figure2.
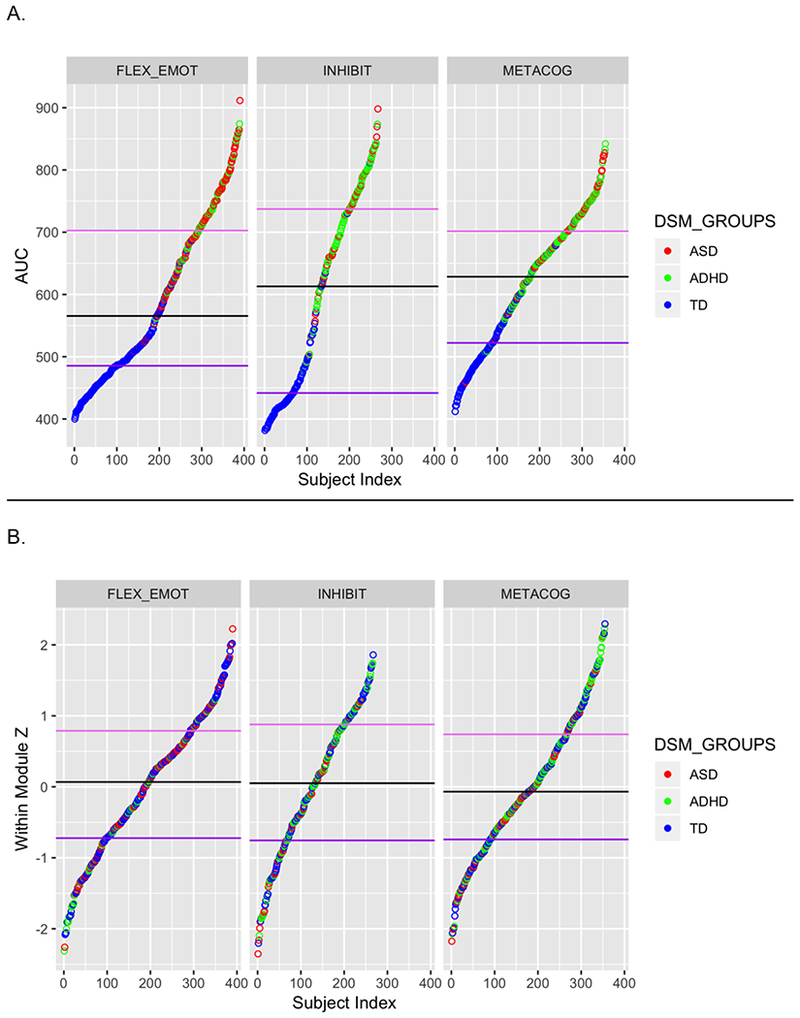
Distribution of values of two metrics describing the Combined sample, which show the dimensional spectrum and transdiagnostic composition of each EF subgroup: (A) Area Under the Curve (AUC) across the 12 T-scores is an index of severity of the weaknesses defining the EF subtype, as higher peaks in the profile provide higher AUC values. For each subtype, lower end of the distribution are occupied by TD participants as expected, with ASD and ADHD participants equally represented by ASD and ADHD participants in the remaining distribution. (B) Within-module z-scores (a community version of degree centrality) which indicates each participant’s position within their subgroup, with the positive end of the y axis indicating central positions (individuals who have higher number of group members correlated with them) and the negative end indicating peripheral positions (individuals who have fewer group members correlated with them). TD, ASD, and ADHD participants represent the full range of the distribution.
Results of SVM classification demonstrated high accuracy, indicating that the observed community structure is generalizable. Subgroup-classification for the KKI sample following training on the CNHS/GU sample was 77.0% (FLEX-EMOT:71.6%; INHIBIT:88.0%; METACOG:76.2%). Random split-half validation conducted on the combined sample had 88.9% accuracy (FLEX-EMOT:88.3%; INHIBIT:89.3%; METACOG:89.3%) – access this SVM at https://dcnl-georgetownu.shinyapps.io/rdoc-svm/.
The observed tripartite community structure also characterized the combined TD sample (Q=.46) and the 3 EF profiles were highly similar to each full sample (rs=0.81-0.97, ps<0.005; Figure 3, Figure S4).
Figure3.
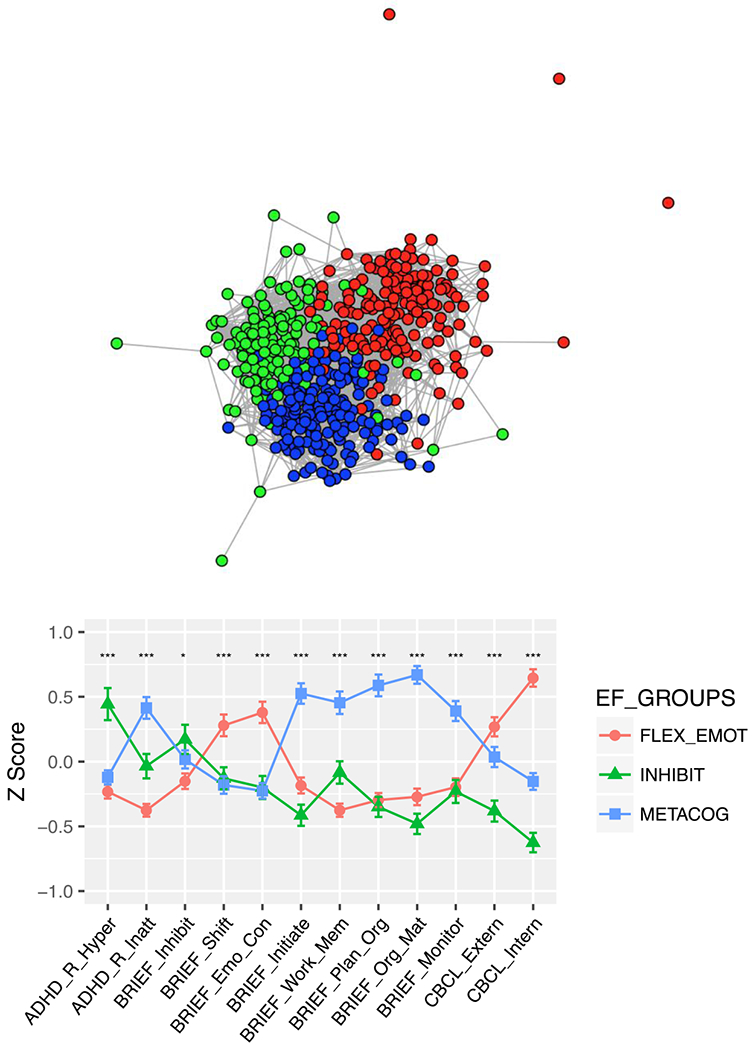
Results of community detection for the combined TD sample, with top panel showing a spring-embedded graph of the network structure of detected communities (EF subtype), with nodes corresponding to individuals and length of lines to the correlation between individuals in that community. Similar to Figure 1, the graph is thresholded at r=.6 for visualization purposes. Each community is color-coded corresponding to the legend in the graphs in the bottom panel, which plot the profile of mean Z scores (± SEM) for each EF subtype. Domain scores labeled as in Figure 1.
fMRI results
A one sample t-test of the Salient vs. Familiar trials contrast during the bottom-up run yielded 12 significant clusters encompassing the ventral and dorsal attention networks, including bilateral IPL, IFG, dorsal/mid cingulate, middle frontal gyrus, left precentral/supplementary motor area, and thalamus (Figure 4A, Table S6). Consistent with studies manipulating the task-relevance of visually salient information, these regions were suppressed during the bottom-up run in which distractors were task-irrelevant. MANOVAs supported Hypothesis #1, that the EF subtypes (FLEX-EMOT:N=27, INHIBIT:N=21, METACOG:N=36) accounted for more variance in neural engagement than diagnoses (ASD:N=21; ADHD:N=15; TD:N=48): Separate models indicated a significant main effect of EF-group (Model 1:F(24, 142) =1.74, p=.025; etâ2=.23) but not DSM-group (Model 2:p=.58; etâ2=.13), and a model with both Group factors (Model 3) showed a significant effect of EF-group (F(24, 138)=1.7, p=.03) but not DSM-Group, p=.46). Model 1 (EF-group) and 2 (DSM-Group) were directly compared with Model 3 (both groups) as two nested ANOVA models (#1-Model 3 with Model 1 and #2-Model 3 with Model 2) to determine whether EF-Groups accounted for more variance than DSM-Groups. Nested Model #1 was not significant indicating that adding DSM-Group factor did not increase significantly the amount of variance explained by EF-group alone (p=.46). Nested Model #2 was significant, F(24, 138)=1.8, p=.017), indicating that the EF-group factor significantly increased the amount of variance explained beyond that accounted for by DSM-groups.
Figure4.

Group average of activation for Salient vs. Familiar distractor trials during the “bottom-up” run of the sustained attention task (A) and activation in right inferior parietal lobule (RIPL) and right insula/inferior frontal gyrus (insula/IFG) by run. FLEX-EMOT subgroup failed to increase RIPL activation in “top-down” run relative to “bottom-up” run (top right).
Hypothesis #2 predicted a significant Group X Run interaction with EF groups but not DSM groups. This was observed in rIPL (F(2, 162)=5.57, p =.005) such that activation increased during the Top-down run for INHIBIT (t(23)=5.56, p<.001) and METACOG (t(34)=4.06, p<.001) groups, but not for FLEX-EMOT (t(24)=.47, p=.64) (Figure 4B). All other interactions were not significant (ps>.6). Main effects of run, higher activation during the top-down than bottom-up run, were observed for rIFG with EF-Group and for both ROIs with DSM-Groups (F(1, 162)>17.6, ps<.0001), indicating that task-instructions evoked the expected change in attentional state between fMRI runs (behavioral results in SI).
Discussion
Community detection applied to common clinical parent-report measures from two large independent cohorts revealed three subgroups with distinct EF-profiles defined by relative weakness in 1) behavioral flexibility and emotion regulation (FLEX-EMOT); 2) hyperactivity/impulsivity and inhibition (INHIBIT); and 3) working memory, organizing, and planning (METACOG). EF profiles spanned the normal to impaired spectrum and distributions cut across ADHD, ASD, and TD samples. This tripartite community structure also characterized TD children alone, suggesting that heterogeneity in disordered EF is nested within normal variability. Support vector machine based classification of new cases was >77% accurate, establishing predictive validity of the observed community structure. Preliminary neurobiological validity was obtained with available fMRI data that showed higher sensitivity of EF than DSM groups to variance in ventral/dorsal attention network regions and support for predicted ventral attention attenuation selectively in the FLEX-EMOT subgroup. These results support the existence of three subtypes of EF, useful clinically for guiding diagnosis and treatment, tracking treatment outcomes, and probing neural correlates.
The robustness of the observed community structure suggests high generalizability. The strength of segregation (Qs=.42-.43) was similar across sample sizes (N=320-1012) and was replicated in two independent cohorts. Community structure was not associated with age, intelligence, or gender, and not dependent on level of impairment as it also characterized the TD-only sample. With the goal of maximizing clinical utility and access, we selected measures commonly used to assess EF and emotion regulation in most pediatric clinical settings. While we used parent informants, testing whether teacher informants yield similar results would be useful in light of informant discrepancies for ADHD (Narad et al., 2015) and ASD (Lerner, De Los Reyes, Drabick, Gerber, & Gadow, 2017). Generalizability to performance-based measures, however, is less tractable in light of the weak correlation between behavioral ratings and task performance (Toplak, Bucciarelli, Jain, & Tannock, 2009). Indeed, community detection of performance measures in ADHD did not yield subgroups separated by inhibition and working memory problems (Fair et al., 2012), as observed here. These modes of measurement differ in goals (Toplak, West, & Stanovich, 2013), with ratings assessing behavior that generalizes over contexts and time, whereas performance assesses optimal behavior in a controlled context. To the extent that they tap common conceptualizations of EF, however, parallel patterns of heterogeneity ought to be observed.
Preliminary neurobiological evidence for EF subtype differences from retrospective data supported theory-driven hypotheses. EF subgroups accounted for significantly more variance in frontal-parietal recruitment than diagnostic groups. In addition, consistent with the postulated role of the rIPL node of the ventral attention network in attentional re-orienting and contextual updating, a selective failure of rIPL modulation was observed in the FLEX-EMOT subgroup. This subtype is characterized by flexibility and emotional regulation problems, the latter of which should be evident in fronto-limbic deficits on tasks tapping emotional function. Future work should determine whether variation within a unitary circuit/network distinguishes the EF subtypes, or whether they are subserved by distinct circuitry. Resting-state fMRI is particularly promising as it eliminates reliance on task compliance and reveals functional networks sensitive to trait/symptom measures and psychopathology.
Translational Implications
Our results make some notable clinical advances. Domains of weaknesses defining the EF subgroups confirm processes (flexibility, inhibition, working memory-related processes) distinguished in neuropsychological, neuroanatomical, and developmental conceptualizations of EF (Miyake et al., 2000). They call for further refinement by incorporating emotional regulation within the flexibility dimension, particularly internalizing symptoms. Some differences are apparent between cohorts – externalizing symptoms distinguished the subgroups in the CNHS/GU (higher mean in FLEX-EMOT than other two subgroups) but not in the KKI cohort and inattention symptoms differed between the subgroups in the KKI cohort but less so in the CNHS/GU cohort. Tables S1–S2 show cohort differences such as the ratio of ASD:ADHD samples and elevated inattention symptoms in the ADHD sample in the KKI relative to CNHS/GU cohort. Whether observed differences persist in balanced samples should be tested. Further, deeper phenotyping would be helpful to parse the type of difficulties in regulating externalizing behaviors (e.g., rule-breaking vs. aggression) that are associated with disinhibition or inflexibility. Additionally, whether the observed tripartite structure is stable developmentally and generalizes beyond ADHD and ASD diagnoses and in a broader age range needs to be tested in future work.
Our results suggest refinement of DSM two-dimensional diagnostic criteria for ADHD. INHIBIT maps to Hyperactivity/Impulsivity; however, INHIBIT and METACOG included elevated Inattention variably between cohorts suggesting limited utility as a distinguishing feature. Most importantly, however, these two profiles did not account for all of the ADHD cases, with 19% defined by the FLEX-EMOT profile, emphasizing the utility of EF subtyping within children who are diagnosed with ADHD to further delineate treatment targets in this heterogeneous population. Indeed, children with ADHD who have emotional regulation problems have worse outcomes (Brocki, Forslund, Frick, & Bohlin, 2017), and therefore, better diagnosis could lead to targeted treatment and improved prognosis. Interestingly, community detection applied to temperamental traits in ADHD, revealed segregation by positive and negative emotion regulation problems (Karalunas et al., 2014), which suggests that FLEX-EMOT profile may be further segregated upon deeper phenotyping. For ASD, only half of the samples in each cohort showed the FLEX-EMOT profile, which challenges the often held notion of cognitive inflexibility as the hallmark EF comorbidity in ASD (Leung & Zakzanis, 2014).
Individual classification is essential for clinical translation. SVM results based on the large combined sample (N=1012) attained 88.9% accuracy and could be useful to clinicians for classifying subgroup membership of individuals. This SVM can be used to classify new cases (https://dcnl-georgetownu.shinyapps.io/rdoc-svm/) and compare against Figure 3 (Table S5) for impairment severity – the distribution characteristics (median, quartiles) of AUC for each EF subgroup provides “norms” which can guide treatment decisions. Change in AUC values can serve as a useful objective metric for tracking treatment response. Classification of EF subgroup early may serve to identify risk domains later in development. Future neuroimaging studies can identify the “signatures” of activation and connectivity patterns that signify EF subtype, with AUC values serving as a continuous dimension to probe the EF profile spectrum. Future work is needed to establish the clinical importance of the observed tripartite structure by testing predictive validity for outcomes (e.g., treatment efficacy), but most immediately, knowledge of EF membership can serve to augment clinical decision-making. There is extensive evidence that EF is a fractionated construct both as measured by informant report and laboratory tasks (Friedman & Miyake, 2017; Gioia et al., 2002; Miyake et al., 2000; Teuber, 1972). Many evidence-based treatments for EF in children with developmental disabilities target specific “subtypes” of EF deficit, for example central stimulants are evidence-based for inhibition, working memory and attention deficits, while the computer-based treatment Cogmed improves working memory specifically (Diamond & Ling, 2016) and the cognitive-behavioral treatment Unstuck and On Target improves flexibility (Kenworthy et al., 2014). Furthermore, these results drive clinical research hypotheses concerning the relationships they reveal. For example, it will be important in future longitudinal work to probe causality in the relationship between flexibility, emotional control and internalizing behaviors in order to inform identification of primary treatment targets. The subtypes discovered here likely concur with clinicians’ intuitions. If so, the present empirical confirmation takes a formal step towards refinement of EF nosology and personalizing treatment, realizing a goal of the NIMH Research Domain Criteria Initiative.
Supplementary Material
Acknowledgements
Funding support by NIH: MH110512, MH084961, MH065395, MH078160, MH085328, NS048527, HD040677-07 and 1U54HD090257. The authors have declared that they have no competing or potential conflicts of interest.
Footnotes
Conflict of interest: Kenworthy receives royalties from the sale of the Behavior Rating Inventory of Executive Function. No other competing interests.
Supporting Information
Additional supporting information may be found in the online version of this article:
REFERENCES
- Achenbach TM (2009). The Achenbach System of Empirically Based Assessemnt (ASEBA): Development, Findings, Theory, and Applications. Burlington, VT: University of Vermont Research Center for Children, Youth, & Families. [Google Scholar]
- American, Psychological, & Association. (2013). Diagnostic and statistical manual of mental disorders (5th ed.). Washington, DC. [Google Scholar]
- Blair C, & Razza RP (2007). Relating effortful control, executive function, and false belief understanding to emerging math and literacy ability in kindergarten. Child Dev, 78(2), 647–663. doi: 10.1111/j.1467-8624.2007.01019.x [DOI] [PubMed] [Google Scholar]
- Brocki KC, Forslund T, Frick M, & Bohlin G (2017). Do Individual Differences in Early Affective and Cognitive Self-Regulation Predict Developmental Change in ADHD Symptoms From Preschool to Adolescence? J Atten Disord. doi: 10.1177/1087054717693372 [DOI] [PubMed] [Google Scholar]
- Corbetta M, & Shulman GL (2002). Control of goal-directed and stimulus-driven attention in the brain. Nat Rev Neurosci, 3(3), 201–215. doi: 10.1038/nrn755 [DOI] [PubMed] [Google Scholar]
- Dale AM (1999). Optimal experimental design for event-related fMRI. Hum Brain Mapp, 8(2-3), 109–114. [DOI] [PMC free article] [PubMed] [Google Scholar]
- Davidson F, Cherry K, & Corkum P (2015). Validating the Behavior Rating Inventory of Executive Functioning for Children With ADHD and Their Typically Developing Peers. Appl Neuropsychol Child, 1–11. doi: 10.1080/21622965.2015.1021957 [DOI] [PubMed] [Google Scholar]
- Diamond A, & Ling DS (2016). Conclusions about interventions, programs, and approaches for improving executive functions that appear justified and those that, despite much hype, do not. Dev Cogn Neurosci, 18, 34–48. doi: 10.1016/j.dcn.2015.11.005 [DOI] [PMC free article] [PubMed] [Google Scholar]
- DuPaul GJ, Power TJ, Anastopoulos AD, & Reid R (1998). ADHD Rating Scale-IV: Checklists, norms, and clinical interpretation: Guilford Press; New York. [Google Scholar]
- Fair DA, Bathula D, Nikolas MA, & Nigg JT (2012). Distinct neuropsychological subgroups in typically developing youth inform heterogeneity in children with ADHD. Proc Natl Acad Sci U S A, 109(17), 6769–6774. doi:1115365109 [pii] 10.1073/pnas.1115365109 [DOI] [PMC free article] [PubMed] [Google Scholar]
- Friedman NP, & Miyake A (2017). Unity and diversity of executive functions: Individual differences as a window on cognitive structure. Cortex, 86, 186–204. doi: 10.1016/j.cortex.2016.04.023 [DOI] [PMC free article] [PubMed] [Google Scholar]
- Geng JJ, & Vossel S (2013). Re-evaluating the role of TPJ in attentional control: contextual updating? Neurosci Biobehav Rev, 37(10 Pt 2), 2608–2620. doi: 10.1016/j.neubiorev.2013.08.010 [DOI] [PMC free article] [PubMed] [Google Scholar]
- Geurts HM, Verte S, Oosterlaan J, Roeyers H, & Sergeant JA (2004). How specific are executive functioning deficits in attention deficit hyperactivity disorder and autism? J Child Psychol Psychiatry, 45(4), 836–854. doi: 10.1111/j.1469-7610.2004.00276.x [DOI] [PubMed] [Google Scholar]
- Gioia GA, Isquith PK, Guy S, & Kenworthy L (2000). BRIEF: Behavior Rating Inventory of Executive Function. Odessa, FL: Psychological Assessment Resources. [Google Scholar]
- Gioia GA, Isquith PK, Kenworthy L, & Barton C (2002). Executive Signatures: Profiles of Everyday Executive Function in Acquired and Developmental Disorders. Child Neuropsychol, 8, 121–137. [DOI] [PubMed] [Google Scholar]
- Jensen PS, Hinshaw SP, Kraemer HC, Lenora N, Newcorn JH, Abikoff HB, … Vitiello B (2001). ADHD comorbidity findings from the MTA study: comparing comorbid subgroups. J Am Acad Child Adolesc Psychiatry, 40(2), 147–158. doi: 10.1097/00004583-200102000-00009 [DOI] [PubMed] [Google Scholar]
- Karalunas SL, Fair D, Musser ED, Aykes K, Iyer SP, & Nigg JT (2014). Subtyping attention-deficit/hyperactivity disorder using temperament dimensions: toward biologically based nosologic criteria. JAMA Psychiatry, 71(9), 1015–1024. doi: 10.1001/jamapsychiatry.2014.763 [DOI] [PMC free article] [PubMed] [Google Scholar] [Retracted]
- Kenworthy L, Anthony LG, Naiman DQ, Cannon L, Wills MC, Luong-Tran C, … Wallace GL (2014). Randomized controlled effectiveness trial of executive function intervention for children on the autism spectrum. J Child Psychol Psychiatry, 55(4), 374–383. doi: 10.1111/jcpp.12161 [DOI] [PMC free article] [PubMed] [Google Scholar]
- Kenworthy L, Yerys BE, Anthony LG, & Wallace GL (2008). Understanding executive control in autism spectrum disorders in the lab and in the real world. Neuropsychol Rev, 18(4), 320–338. doi: 10.1007/s11065-008-9077-7 [DOI] [PMC free article] [PubMed] [Google Scholar]
- Krall SC, Rottschy C, Oberwelland E, Bzdok D, Fox PT, Eickhoff SB, … Konrad K (2015). The role of the right temporoparietal junction in attention and social interaction as revealed by ALE meta-analysis. Brain Struct Funct, 220(2), 587–604. doi: 10.1007/s00429-014-0803-z [DOI] [PMC free article] [PubMed] [Google Scholar]
- Lai CLE, Lau Z, Lui SSY, Lok E, Tam V, Chan Q, … Cheung EFC (2017). Meta-analysis of neuropsychological measures of executive functioning in children and adolescents with high-functioning autism spectrum disorder. Autism Res, 10(5), 911–939. doi: 10.1002/aur.1723 [DOI] [PubMed] [Google Scholar]
- Lainhart JE, Bigler ED, Bocian M, Coon H, Dinh E, Dawson G, … Volkmar F (2006). Head circumference and height in autism: a study by the Collaborative Program of Excellence in Autism. American Journal of Medical Genetics. Part A, 140, 2257–2274. doi: 10.1002/ajmg.a.31465 [DOI] [PMC free article] [PubMed] [Google Scholar]
- Lawson RA, Papadakis AA, Higginson CI, Barnett JE, Wills MC, Strang JF, … Kenworthy L (2015). Everyday executive function impairments predict comorbid psychopathology in autism spectrum and attention deficit hyperactivity disorders. Neuropsychology, 29(3), 445–453. doi: 10.1037/neu0000145 [DOI] [PubMed] [Google Scholar]
- Lecavalier L, Smith T, Johnson C, Bearss K, Swiezy N, Aman MG, … Scahill L (2017). Moderators of Parent Training for Disruptive Behaviors in Young Children with Autism Spectrum Disorder. J Abnorm Child Psychol, 45(6), 1235–1245. doi: 10.1007/s10802-016-0233-x [DOI] [PMC free article] [PubMed] [Google Scholar]
- Lerner MD, De Los Reyes A, Drabick DAG, Gerber AH, & Gadow KD (2017). Informant discrepancy defines discrete, clinically useful autism spectrum disorder subgroups. J Child Psychol Psychiatry, 58(7), 829–839. doi: 10.1111/jcpp.12730 [DOI] [PubMed] [Google Scholar]
- Leung RC, & Zakzanis KK (2014). Brief report: cognitive flexibility in autism spectrum disorders: a quantitative review. J Autism Dev Disord, 44(10), 2628–2645. doi: 10.1007/s10803-014-2136-4 [DOI] [PubMed] [Google Scholar]
- Lord C, Risi S, Lambrecht L, Cook EH, Leventhal BL, DiLavore PC, … Rutter M (2000). The autism diagnostic observation schedule-generic: a standard measure of social and communication deficits associated with the spectrum of autism. Journal of Autism and Developmental Disorders, 30, 205–223. doi:11055457 [PubMed] [Google Scholar]
- Lord C, Rutter M, & Le Couteur A (1994). Autism Diagnostic Interview-Revised: a revised version of a diagnostic interview for caregivers of individuals with possible pervasive developmental disorders. Journal of Autism and Developmental Disorders, 24, 659–685. doi:7814313 [DOI] [PubMed] [Google Scholar]
- Mahajan R, Bernal MP, Panzer R, Whitaker A, Roberts W, Handen B, … Autism Speaks Autism Treatment Network Psychopharmacology, C. (2012). Clinical practice pathways for evaluation and medication choice for attention-deficit/hyperactivity disorder symptoms in autism spectrum disorders. Pediatrics, 130 Suppl 2, S125–138. doi: 10.1542/peds.2012-0900J [DOI] [PubMed] [Google Scholar]
- Miodovnik A, Harstad E, Sideridis G, & Huntington N (2015). Timing of the Diagnosis of Attention-Deficit/Hyperactivity Disorder and Autism Spectrum Disorder. Pediatrics. doi: 10.1542/peds.2015-1502 [DOI] [PubMed] [Google Scholar]
- Miyake A, Friedman NP, Emerson MJ, Witzki AH, Howerter A, & Wager TD (2000). The unity and diversity of executive functions and their contributions to complex “Frontal Lobe” tasks: a latent variable analysis. Cogn Psychol, 41(1), 49–100. doi: 10.1006/cogp.1999.0734 [DOI] [PubMed] [Google Scholar]
- Moffitt TE, Arseneault L, Belsky D, Dickson N, Hancox RJ, Harrington H, … Caspi A (2011). A gradient of childhood self-control predicts health, wealth, and public safety. Proc Natl Acad Sci U S A, 108(7), 2693–2698. doi: 10.1073/pnas.1010076108 [DOI] [PMC free article] [PubMed] [Google Scholar]
- Murray MJ (2010). Attention-deficit/Hyperactivity Disorder in the context of Autism spectrum disorders. Curr Psychiatry Rep, 12(5), 382–388. doi: 10.1007/s11920-010-0145-3 [DOI] [PubMed] [Google Scholar]
- Narad ME, Garner AA, Peugh JL, Tamm L, Antonini TN, Kingery KM, … Epstein JN (2015). Parent-teacher agreement on ADHD symptoms across development. Psychol Assess, 27(1), 239–248. doi: 10.1037/a0037864 [DOI] [PMC free article] [PubMed] [Google Scholar]
- Nigg JT (2013). Attention deficits and hyperactivity-impulsivity: what have we learned, what next? Dev Psychopathol, 25(4 Pt 2), 1489–1503. doi:S0954579413000734 [pii] 10.1017/S0954579413000734 [DOI] [PMC free article] [PubMed] [Google Scholar]
- Pennington BF (1997). Dimensions of executive function in normal and abnormal development In Krasnegor NA, Lyon GR, & Goldman-Rakic PS (Eds.), Attention, memory, and executive function (pp. 327–348). Baltimore: Brookes. [Google Scholar]
- Pennington BF, & Ozonoff S (1996). Executive functions and developmental psychopathology. J Child Psychol Psychiatry, 37(1), 51–87. [DOI] [PubMed] [Google Scholar]
- Posner MI, & Rothbart MK (2000). Developing mechanisms of self regulation. Dev Psychopathol, 12(3), 427–441. [DOI] [PubMed] [Google Scholar]
- Pugliese CE, Anthony LG, Strang JF, Dudley K, Wallace GL, Naiman DQ, & Kenworthy L (2015). Longitudinal Examination of Adaptive Behavior in Autism Spectrum Disorders: Influence of Executive Function. J Autism Dev Disord. doi: 10.1007/s10803-015-2584-5 [DOI] [PMC free article] [PubMed] [Google Scholar]
- Rosenthal M, Wallace GL, Lawson R, Wills MC, Dixon E, Yerys BE, & Kenworthy L (2013). Impairments in real-world executive function increase from childhood to adolescence in autism spectrum disorders. Neuropsychology, 27(1), 13–18. doi:2013–01868-002 [pii] 10.1037/a0031299 [DOI] [PMC free article] [PubMed] [Google Scholar]
- Sikora DM, Vora P, Coury DL, & Rosenberg D (2012). Attention-deficit/hyperactivity disorder symptoms, adaptive functioning, and quality of life in children with autism spectrum disorder. Pediatrics, 130 Suppl 2, S91–97. doi:peds.2012-0900G [pii] 10.1542/peds.2012-0900G [DOI] [PubMed] [Google Scholar]
- Sprenger L, Buhler E, Poustka L, Bach C, Heinzel-Gutenbrunner M, Kamp-Becker I, & Bachmann C (2013). Impact of ADHD symptoms on autism spectrum disorder symptom severity. Res Dev Disabil, 34(10), 3545–3552. doi: 10.1016/j.ridd.2013.07.028 [DOI] [PubMed] [Google Scholar]
- Teuber HL (1972). Unity and diversity of frontal lobe functions. Acta Neurobiol Exp (Wars), 32(2), 615–656. [PubMed] [Google Scholar]
- Toplak ME, Bucciarelli SM, Jain U, & Tannock R (2009). Executive functions: performance-based measures and the behavior rating inventory of executive function (BRIEF) in adolescents with attention deficit/hyperactivity disorder (ADHD). Child Neuropsychol, 15(1), 53–72. doi:794041160 [pii] 10.1080/09297040802070929 [DOI] [PubMed] [Google Scholar]
- Toplak ME, West RF, & Stanovich KE (2013). Practitioner review: do performance-based measures and ratings of executive function assess the same construct? J Child Psychol Psychiatry, 54(2), 131–143. doi: 10.1111/jcpp.12001 [DOI] [PubMed] [Google Scholar]
- Troyb E, Rosenthal M, Eigsti IM, Kelley E, Tyson K, Orinstein A, … Fein D (2014). Executive functioning in individuals with a history of ASDs who have achieved optimal outcomes. Child Neuropsychol, 20(4), 378–397. doi: 10.1080/09297049.2013.799644 [DOI] [PMC free article] [PubMed] [Google Scholar]
- Vaillancourt T, Haltigan JD, Smith I, Zwaigenbaum L, Szatmari P, Fombonne E, … Bryson S (2017). Joint trajectories of internalizing and externalizing problems in preschool children with autism spectrum disorder. Dev Psychopathol, 29(1), 203–214. doi: 10.1017/S0954579416000043 [DOI] [PubMed] [Google Scholar]
- Willcutt EG, Doyle AE, Nigg JT, Faraone SV, & Pennington BF (2005). Validity of the executive function theory of attention-deficit/hyperactivity disorder: a meta-analytic review. Biol Psychiatry, 57(11), 1336–1346. doi:S0006-3223(05)00171-X [pii] 10.1016/j.biopsych.2005.02.006 [DOI] [PubMed] [Google Scholar]
- Yerys BE, Wallace GL, Sokoloff JL, Shook DA, James JD, & Kenworthy L (2009). Attention deficit/hyperactivity disorder symptoms moderate cognition and behavior in children with autism spectrum disorders. Autism Res, 2(6), 322–333. doi: 10.1002/aur.103 [DOI] [PMC free article] [PubMed] [Google Scholar]
- Yoshimasu K, Barbaresi WJ, Colligan RC, Voigt RG, Killian JM, Weaver AL, & Katusic SK (2012). Childhood ADHD is strongly associated with a broad range of psychiatric disorders during adolescence: a population-based birth cohort study. J Child Psychol Psychiatry, 53(10), 1036–1043. doi: 10.1111/j.1469-7610.2012.02567.x [DOI] [PMC free article] [PubMed] [Google Scholar]
- Zelazo PDC, S M (2012). Hot and cool executive function in childhood and adolescence: Development and plasticity. Child Dev Perspect, 6, 354–360. [Google Scholar]
- Zink CF, Pagnoni G, Martin ME, Dhamala M, & Berns GS (2003). Human striatal response to salient nonrewarding stimuli. The Journal of Neuroscience: The Official Journal of the Society for Neuroscience, 23, 8092–8097. [DOI] [PMC free article] [PubMed] [Google Scholar]
Associated Data
This section collects any data citations, data availability statements, or supplementary materials included in this article.