Abstract
The International Agency for Research on Cancer (IARC) and the United States Environmental Protection Agency (USEPA) classified ethylene oxide (EtO) as a known human carcinogen. Critically, both noted that the epidemiological evidence based on lymphoid and breast cancers was “limited,” but that the evidence in animal studies was “sufficient” and “extensive” (respectively) and that EtO is genotoxic. The USEPA derived one of the highest published inhalation unit risk (IUR) values (3 × 10⁻³ per [µg/m3 EtO]), based on results from 2 epidemiological studies. We performed focused reviews of the epidemiological and toxicological evidence on the carcinogenicity of EtO and considered the USEPA’s reliance on a genotoxic mode of action to establish EtO’s carcinogenicity and to determine likely dose–response patterns. Higher quality epidemiological studies demonstrated no increased risk of breast cancers or lymphohematopoietic malignancies (LHM). Similarly, toxicological studies and studies of early effect biomarkers in animals and humans provided no strong indication that EtO causes LHM or mammary cancers. Ultimately, animal data are inadequate to define the actual dose–response shape or predict tumor response at very low doses with any confidence. We conclude that the IARC and USEPA classification of EtO as a known human carcinogen overstates the underlying evidence and that the IUR derived by USEPA grossly overestimates risk.
Keywords: chemical, dose response, modeling, cancer
Summary
Ethylene oxide (EtO) is a highly reactive chemical used as a sterilizing agent and a feedstock for producing other chemicals. The International Agency for Research on Cancer (IARC) and the United States Environmental Protection Agency (USEPA) classified EtO as a known human carcinogen.1,2 Critically, both noted that the epidemiological evidence based on lymphoid and breast cancers was “limited” but that the evidence in animal studies was “sufficient” and “extensive” (respectively) and that EtO is genotoxic. The USEPA concluded, “Overall, confidence in the hazard characterization of EtO as ‘carcinogenic to humans’ is high” and derived one of the highest published inhalation unit risk (IUR) values (3 × 10⁻³ per [µg/m3 EtO]), based on results from 2 epidemiological studies. This high IUR has fueled community-based risk assessments that predict alarmingly high cancer risks in communities surrounding facilities using EtO.
We performed focused reviews of the epidemiological and toxicological evidence on the carcinogenicity of EtO and considered the USEPA’s reliance on a genotoxic mode of action (MOA) to establish EtO’s carcinogenicity and to determine likely dose–response patterns. We then compared the EPA potency estimate with alternatives based on laboratory animal data.
Higher quality epidemiological studies demonstrated no increased risk of breast cancers (in fact, decreased risk was observed) or lymphohematopoietic malignancies (LHM), including the studies USEPA used to derive the IUR. Similarly, toxicological studies and studies of early effect biomarkers in animals and humans provided no strong indication that EtO causes LHM or breast/mammary cancers. Only one study demonstrated a clear monotonic dose–response with leukemia in female Fisher rats; however, this strain has a high background rate of leukemia and may not be an appropriate model for human leukemogenicity. Nevertheless, an IUR based on this toxicology study is 2 orders of magnitude lower than that derived by USEPA. Ultimately, animal data are inadequate to define the actual dose–response shape or predict tumor response at very low doses with any confidence. The USEPA’s1 conclusion that EtO is genotoxic and likely has a mutagenic MOA, according to USEPA policy, should have indicated a linear dose–response.
We conclude that the IARC and USEPA classification of EtO as a known human carcinogen overstates the underlying evidence and that the IUR derived by USEPA grossly overestimates risk.
Introduction
Ethylene oxide (CAS Number 75-21-8), also known as oxirane, is a highly reactive chemical used as a feedstock for the production of other chemicals, including glycol ethers and polyglycol ethers, as well as a variety of emulsifiers, detergents, and solvents. Ethylene oxide also is widely used to disinfect medical equipment, especially components that would be damaged if heat sterilized, and as a fumigant for disinfecting food products, including spices.2
The IARC classified EtO as a group 1 carcinogen (carcinogenic to humans), even though they determined that “There is limited evidence in humans for a causal association of ethylene oxide with lymphatic and haematopoietic cancers…and breast cancer.” However, the IARC Working Group also concluded: “There is sufficient evidence in experimental animals for the carcinogenicity of ethylene oxide” and, “There is strong evidence that the carcinogenicity of ethylene oxide, a direct-acting alkylating agent, operates by a genotoxic mechanism.” The IARC evaluation ended with the following: “In making the overall evaluation, the Working Group considered that there is sufficient evidence for the carcinogenicity of ethylene oxide in experimental animals, and relied heavily on the compelling data in support of the genotoxic mechanism described above.”2(p396)
In December 2016, the USEPA issued in final form Evaluation of the Inhalation Carcinogenicity of Ethylene Oxide (CASRN 75-21-8), updating a 1985 risk assessment and a revised draft in 2006. The USEPA’s final, 2016 version, following IARC’s 2012 evaluation, classified EtO as a human carcinogen, upgrading its 1985 classification of EtO as “probably carcinogenic to humans” (Group B1), but “bordering on Group B2, however, because of limitation in the human evidence.”3 The USEPA justified the decision to classifying EtO as “carcinogenic to humans” as follows:
…(1) strong, but less than conclusive on its own, epidemiological evidence of lymphohematopoietic cancers and breast cancer in EtO-exposed workers, (2) extensive evidence of carcinogenicity in laboratory animals, including lymphohematopoietic cancers in rats and mice and mammary carcinomas in mice following inhalation exposure, (3) clear evidence that EtO is genotoxic and sufficient weight of evidence to support a mutagenic mode of action for EtO carcinogenicity, and (4) strong evidence that the key precursor events are anticipated to occur in humans and progress to tumors, including evidence of chromosome damage in humans exposed to EtO. Overall, confidence in the hazard characterization of EtO as “carcinogenic to humans” is high.1
The USEPA also increased 30-fold the IUR estimate for adults from 1 in 10 000 to 30 in 10 000 excess cancers per microgram per cubic meter. Inhalation unit risks can be interpreted roughly as a standardized carcinogenicity potency index and can be compared with those of other carcinogens. For example, the updated IUR for EtO is 100 times higher than the IUR for 1,3-butadiene, and nearly 700 times higher than the IUR for vinyl chloride, both well-established human carcinogens. The USEPA IUR is 1000 times higher than the unit risk number of 4 ppb proposed by the Texas Commission on Environmental Quality for EtO, based on the same epidemiological evidence.4 The USEPA IUR for EtO, if valid, suggests that EtO is one of the most potent known human carcinogens.
Because the IUR is high, the concentration of EtO considered “safe” (ie, associated with no more than a one in a million increased lifetime cancer risk) is very low: it was estimated to be 0.0002 µg/m3 [0.0001 parts per billion (ppb), which is equivalent to 0.1 parts per trillion (ppt)]. This concentration is well below the current limit of detection5 and thousands of times lower than estimated endogenous levels of EtO in humans.6 Derivations of community-level cancer risks using this high-potency estimate for EtO have led to alarmingly high cancer risk estimates in some communities, as well as plant closings and proposed banning of the chemical.7,8
To better understand the basis for IARC and USEPA classifying EtO as a known and extremely potent human carcinogen, we performed a focused critical review and synthesis of the epidemiological and animal toxicological evidence on the carcinogenicity of EtO. Further, we considered USEPA’s conclusion of a mutagenic mode of carcinogenic action and evaluated the possible dose–response and interspecies differences in potency. The USEPA’s9 guidelines for carcinogen risk assessment state that “The approach to dose–response assessment for a particular agent is based on the conclusion reached as to its potential mode(s) of action for each tumor type,” meaning dose–response evaluations should be motivated by knowledge of biology and MOA, and not mathematical analysis alone. The goal of this review and integration of evidence was to validate, if possible, the dose–response analysis leading to USEPA’s extremely high IUR estimate.
Methods
Epidemiology Literature Review
We conducted a critical review and synthesis of the epidemiologic studies on occupational exposure to EtO and cancer. Studies first were identified from the 2016 USEPA review. Additionally, we performed searches of PubMed using the terms “ethylene oxide” and “epidemiology”; however, no additional relevant case–control or cohort studies were identified.
We performed a quality-based evaluation of each study using the domains (except “Other”) and associated criteria from the USEPA’s Application of Systematic Review in TSCA Risk Evaluations10 which was updated in 2019.11 Specifically, an overall quality judgment was given for the most recent update of each of the relevant cohort or case–control studies based on the domains of (1) exposure characterization, (2) study participation, (3) potential confounding/variability control, (4) outcome assessment, and (5) analysis (see Supplemental Table S1). Each study was rated high, medium, or low quality on each domain separately for breast cancer or the combined category of all LHM, but numerical quality scoring was not used. In addition, an overall quality rating for each study was derived based on the average of the domain ratings.
Toxicology Data Selection and Review
We relied on the human and laboratory animal data described and summarized by the USEPA toxicological review (see Tables 3-3 to 3-8 of USEPA, 2016).1 Additionally, we performed searches of the PubMed database to identify any additional relevant 2-year cancer bioassays; however, none were found. Studies that identified increases in effect (with reported mean and standard deviation) in 2 or more exposure concentrations above control were considered for dose–response modeling.
Ethylene oxide–induced DNA adducts and mutations were selected as early key events in the MOA for dose–response analysis and interspecies response comparison. Chromosome-level effects, including chromosomal aberrations and indicators of chromosome damage (ie, sister chromatid exchanges and micronuclei formation) were also assessed. Relevant studies with statistically significant findings, as reported by USEPA, were selected for evaluation.
Dose–Response Modeling
Dose–response modeling was conducted using the USEPA’s benchmark dose software (BMDS 3.1.1.). All frequentist models were considered with default conditions, including extra risk assumptions for background and a benchmark response of 10%. We relied on the USEPA’s model selection guidance12 and made no professional judgments regarding model fit or selection. Any model with a goodness of fit P value >.1 was considered “adequate.” When Bayesian model averaging was considered, the model had uninformative priors and assumed no difference in model weight on the average.
Epidemiology of Occupational EtO Exposure and Breast Cancer and LHM
All relevant publications reported results from occupational cohort studies except for one community-based case–control study. Kiran et al13 conducted a community-based case–control study of 31 lymphoma cases from 22 centers in 6 European countries and evaluated 35 chemicals including EtO estimated by experts based on interview responses. No clear association was observed between “ever exposed” to EtO and risk of lymphoma (odds ratio [OR] = 1.3, 95% confidence interval [CI]: 0.7-2.1) or any other exposure surrogate except for workers with >5% of estimated working hours exposed to EtO (OR = 4.3, 95% CI: 1.4-13.0). We did not consider this study for further review because (1) it was the only population-based case–control study, which is considered a weaker study design, and (2) examined lymphomas only.
Hogstedt14 is the most recent of 3 updates of a study of 709 workers from 3 Swedish plants producing EtO.15-17 Exposure was based on duration of employment and job title; however, time-weighted average EtO exposures from 1963 to 1976 were estimated at 5 to 8 ppm.17 Cancer incidence through 1983 and mortality through 1985 were ascertained from the cancer registry. Nine “blood and lymphatic” and no breast cancers were reported.
Kiesselbach et al18 followed a cohort of 2658 men employed at 8 chemical plants in Germany and exposed to EtO for at least 1 year between 1928 and 1981. Exposure to EtO was based on job history with type of exposure, duration of exposure, date beginning and ending work, and a description of accidents or shutdowns. Cause of death was obtained through 1982 from lay statements, physician reports, and hospital reports. Only 5 LHM deaths were reported.
Bisanti et al19 followed a cohort of 1971 chemical workers for mortality from 1940 to 1984. All were men employed at some point during 1938 to 1984 and licensed to handle EtO (637 were licensed only for EtO). Exposure to EtO was assumed as no exposure data were available. Five of 6 LHM deaths occurred among the EtO-only licensed cohort.
Norman et al20 followed a cohort of 1132 sterilization workers employed between 1974 and 1980 for cancer incidence and mortality through 1987. Exposure to EtO was assumed but not quantified. Cancer outcomes were identified through interviews, review of medical records, mailed surveys, cancer registry data (1985-1989), and the National Death Index. Standardized incidence and mortality ratios (SIRs and SMRs, respectively) were estimated using reference rates from the NCI Surveillance, Epidemiology, and End Results Program (SEER; 1978-1981 and 1981-1985) and Western New York (1979-1984). Twelve of the 25 cancers in women were breast cancers, and only 3 cancers were identified in men. No LHM results were reported.
Olsen et al21 followed through 1992 a cohort of 1361 men employed ≥30 days from 1940 to 1992 in 1 of 3 United States plants producing EtO. Work histories were evaluated by plant experts to determine exposure based on job titles and departments. Mortality data through 1992 were obtained from plant health surveillance systems, Social Security records, and the National Death Index. Ten LHM deaths were identified.
Coggon et al,22 updating Gardner et al,23 evaluated cancer mortality risks through 2000 among a cohort of 2876 workers from 4 companies that had manufactured or used EtO and 8 hospital sterilization units. Exposure categories were based on job classification, and reported time–weighted average EtO concentrations prior to 1977 were less than 5 ppm in “almost all jobs.” Cancer mortality was based on death certificates, with 11 breast cancer and 17 LHM deaths observed.
Steenland et al24 evaluated breast cancer incidence in 7576 women employed in sterilization facilities for at least 3 months from the 1940s to the 1980s. Exposure to EtO was modeled for all years from limited measurement data and process change information. Breast cancer incidence data were obtained via interview, death certificates, cancer registries, and medical records; in situ cases were included. Standardized incidence ratio analyses were conducted using SEER referent rates by categories of cumulative EtO exposure. A nested case–control analysis also was used to evaluate the 311 observed breast cancer cases.
Steenland et al25 updated the US National Institute for Occupational Safety and Health (NIOSH) cohort of 18 235 men and women employed in sterilization facilities.26-28 Exposure to EtO was estimated based on modeled exposures for all years based on limited measurement data and process change information. A total of 2835 deaths were observed through 1998. Vital status and cause of death were ascertained via the National Death Index. Life table analyses were conducted using the US population as referent: 103 breast cancer and 79 LHM deaths were reported.
Swaen et al29 updated through 2003 a cohort of 2,063 men employed at any time between 1925 and 1988 in 2 US facilities producing or using EtO; this cohort had been previously investigated in 4 studies.30-33 Exposure was estimated based on interviews and industrial hygiene measurements. Cause of death was obtained from the National Death Index and analyzed using mortality rates for US men as the referent. A total of 27 LHM deaths were reported. Valdez-Flores et al34 pooled the mortality updates of Swaen et al29 and Steenland et al.25
Mikoczy et al35 updated a cohort of 2,171 men and women employed for at least 1 year prior to 1986 in 2 sterilization facilities in Sweden.36,37 Detailed exposure assessment was derived based on 2 plant-specific job exposure matrices. Incidence data were obtained from the Swedish Cancer Registry and cause of death from the Swedish population registry for 1972 through 2006. A total of 41 breast cancers and 18 LHM were analyzed using national referent rates. A nested case–control analysis also was performed.
Breast Cancer
Five updated occupational cohorts—primarily sterilization workers exposed to EtO—reported results for female breast cancer.20,22,24,25,35 Steenland et al24 reported results for breast cancer incidence and Steenland et al25 for breast cancer mortality based on the same cohort. For exposure assessment, the Mikoczy et al35 study was rated as high quality, Steenland et al24 and Steenland et al25 were rated medium quality, and finally, Coggon et al22 and Norman et al20 were deemed of low quality. All 5 studies were rated as high or medium for study participation and for potential confounding/variability control. Only Mikoczy et al35 was rated as high for outcome assessment, while Norman et al20 was rated as low. Steenland et al25 and Coggan et al22 were classified as high quality, both Mikoczy et al35 and Steenland et al24 were ranked as medium quality, and Norman et al20 as low quality for analysis (note 1). Details of the ratings for each study are reported in Supplemental Table S2.
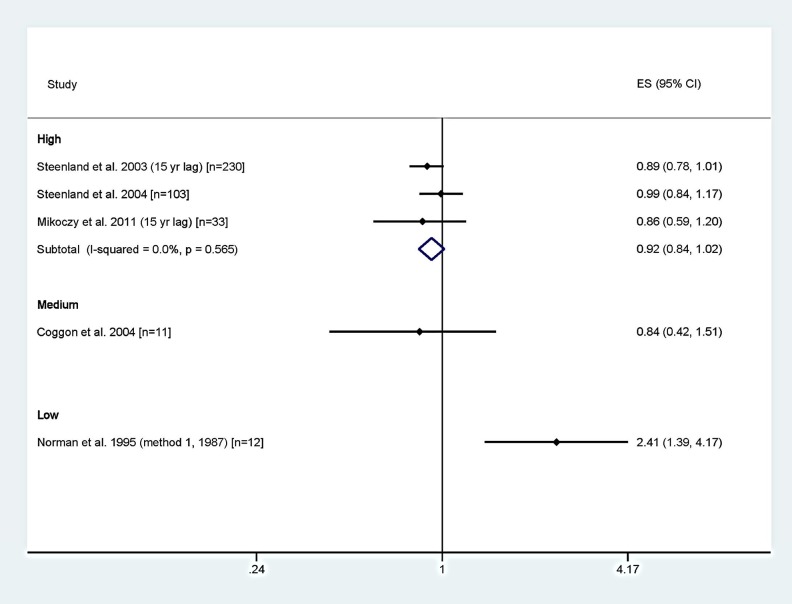
Figure 1 presents forest plots of the results of the studies grouped by overall quality rating and random-effects meta-relative risk (RR) estimates for the high-quality studies (the only category with more than one study). The medium- or high-quality studies reported no increased risk and suggested slight deficits of breast cancers. The breast cancer meta-analysis resulted in a meta-RR of 0.92 (95% CI: 0.84-1.02) for the high-quality studies. The only study reporting an increase in breast cancers was classified as low quality.20
Figure 1.
Forest plot of SIRs and SMRs for breast cancer by overall study quality rating with meta-analysis by study quality. ES indicates effect size; SMR, standardized mortality ratio; SIR, standardized incidence ratio.
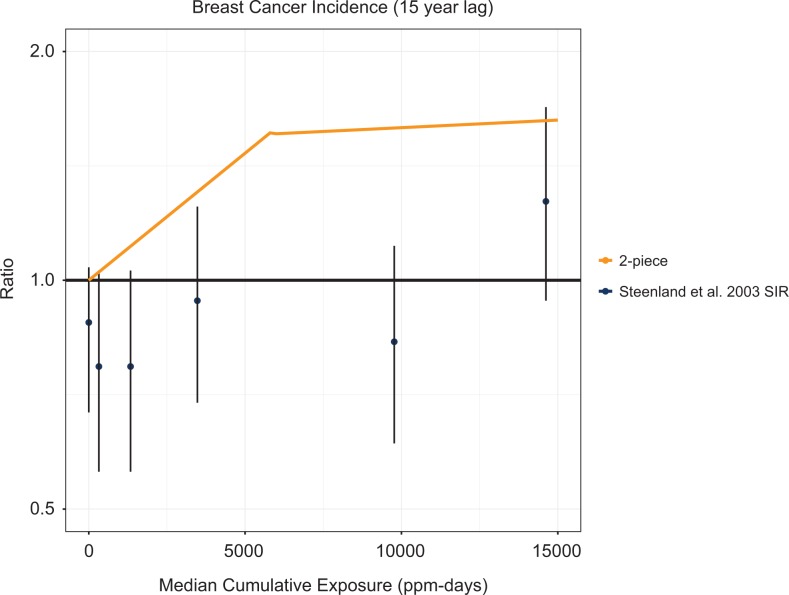
Despite reporting no overall increase in breast cancer risk and statistically significant deficits in the lowest exposure group (SIR = 0.52, 95% CI: 0.25-0.96 for 0-0.13 ppm-years35 and SIR = 0.74, 95% CI: 0.57-0.97 for <647 ppm-years and no lag24), both Mikoczy et al35 and Steenland et al24 performed RR analyses for EtO exposure and breast cancer using the groups with risk deficits as the referent group. This presents interesting methodological questions of relevance and validity. Figure 2 presents the SIRs and corresponding confidence intervals from Steenland et al,24 the breast cancer study with the most exposure categories, that ultimately served as the basis for the 2-piece linear model for breast cancer used in part by USEPA1 to derive the IUR for EtO. Although the original study data indicate risk deficits in all but the highest exposure levels (not statistically significantly), the USEPA selected the RR analyses from Steenland et al24—which USEPA claimed to be superior to estimates based on the general population—to construct a 2-piece dose–response model predicting positive risks at all nonzero exposure levels. The rationale for considering the recalibrated risk estimates to be preferable was not explained.
Figure 2.
Standardized incidence ratios for breast cancer from Steenland et al24 and the USEPA1 2-piece linear breast cancer model.
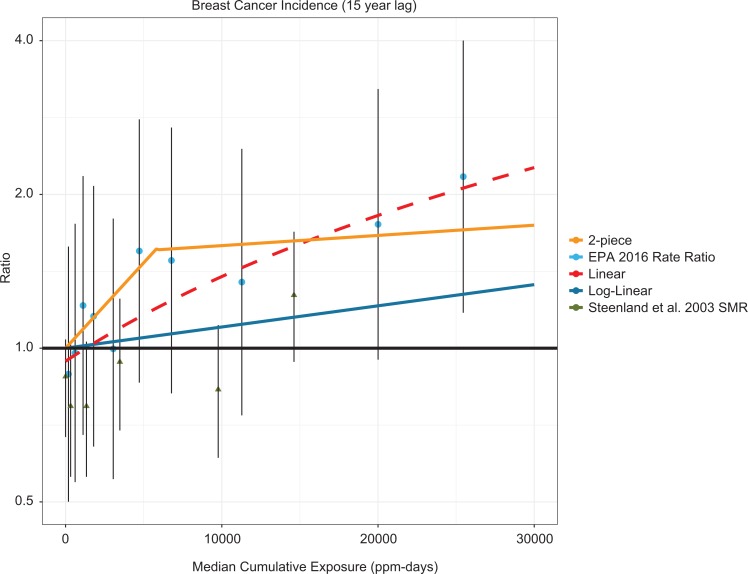
Figure 3 presents the breast cancer analyses and dose–response lines using USEPA’s reanalysis of the data from Steenland et al.24 This analysis also reclassified cumulative exposure into 10 arbitrary categories such that each contained about the same number of cases. The USEPA’s dose–response analysis did not include a simple linear model; therefore, we fit a linear regression to the reported rate ratios from USEPA1 and Steenland et al.24 This figure demonstrates that these analyses, when recalibrated so that the referent group is reset from a statistically significant deficit to “background” (ie, RR = 1.0), exhibit a dose–response relationship that appears to be generally linear. Steenland et al38 also examined numerous alternative models of the NIOSH cohort internal comparison data for breast cancer across multiple exposure categories noting that many of the different models reasonably fit the data. Steenland et al38 highlighted that the 2-piece model exhibited a steep increase in risk across the lowest cumulative exposure categories followed by attenuation across higher levels. No discussion or rationale was provided for recalibrating the data using a referent group that demonstrated a statistically significant deficit. This gave rise to the “supra-linear” 2-piece dose–response model.
Figure 3.
Standardized incidence ratios for breast cancer from Steenland et al,24 RRs of the internal comparison data for breast cancer in USEPA,1 the USEPA1 2-piece linear and log-linear breast cancer models, and a linear model of the RR data. SMRs are shown as triangles. RR indicates relative risk; SMR, standardized mortality ratio.
Lymphohematopoietic Malignancies
Several occupational cohort studies reported associations between EtO exposure and various lymphohematopoietic cancers.13,14,18-22,25,29-32,35,37,39 Although the cancers within the broad category of lymphohematopoietic cancers have several different known or suspected causes, the combined LHM category may be the only way to provide a general summary across studies. Presumably, if a strong excess of any specific type or group of LHM, such as “lymphoid cancers,” were caused by EtO, the all LHM category would reflect some modestly increased risk and that stratified analyses by specific LHM would identify the specific cancer(s) contributing to the increased risk of all LHM.
Eight publications reported results for combined LHM based on the most recently updated cohorts.14,18,19,21,22,25,29,35 For exposure assessment, Mikoczy et al35 and Swaen et al29 were rated as high quality, Steenland et al25 as medium quality, and the remaining studies as low quality. Four studies were rated high quality21,25,29,35 and 4 studies were rated as medium14,18,19,22 on study participation. For outcome assessment, Mikoczy et al35 was rated as high quality and Kisselbach et al18 as low quality with all others as medium quality. Only Steenland et al26 was rated high quality for variable control and potential confounding. Kisselbach et al18 and Hogstedt14 were rated as low quality, while the remaining 5 publications were rated as medium quality. Bisanti et al,19 Kisselbach et al,18 and Hogstedt14 were all rated as low quality for analysis. Steenland et al25 and Mikoczyet al35 were determined to be of medium quality with the remaining 3 studies achieving a high rating. Details of the ratings for each study are reported in Supplemental Table S3.
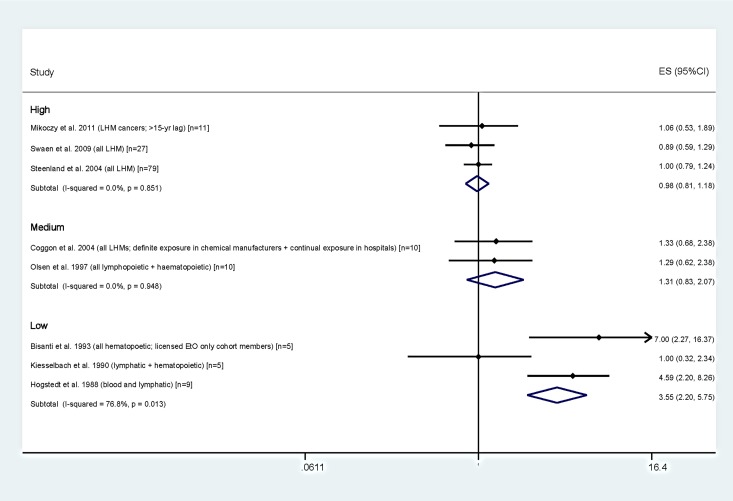
Figure 4 presents the results for LHM by category of overall study quality and a random-effects meta-analysis for each quality category. None of the 6 studies rated as medium or high quality reported statistically significant increases for LHM, and SMRs clustered around the null with relatively narrow confidence limits. In contrast, 3 of 4 studies we considered as low quality reported increased LHM, 2 of which were statistically significant.14,19 These were notably the studies with the smallest numbers: the 2 largest studies, both rated as high quality, demonstrated no excess LHM as a group (SMR = 0.889 in Swaen et al29; SMR = 1.00 in Steenland et al25). The LHM meta-RRs were 0.98 (95% CI: 0.81-1.18) for the high quality studies, 1.31 (95% CI: 0.83-2.07) for the medium quality studies, and 3.55 (95% CI: 2.20-5.75) for the low quality studies.
Figure 4.
Forest plot of SIRs and SMRs for LHM by overall study quality rating with meta-analyses by study quality. ES indicates effect size; LHM, lymphohematopoietic malignancies; SMR, standardized mortality ratio; SIR, standardized incidence ratio.
Some studies reported results for specific LHM. For example, Hogstedt14 and Bisanti et al19 reported significantly elevated risks of leukemia (SMR = 6.11, 95% CI: 1.7-15.7) and lymphosarcoma/reticulosarcoma (SMR = 16.93, 95% CI: 3.49-49.53). Swaen et al39 reported an increased risk of Hodgkin lymphoma (SIR = 4.97, 95% CI = 2.38-9.15). Steenland et al25 presented results for non-Hodgkin lymphoma (NHL): SMR = 1.00 (95% CI: 0.72-1.35), based on 31 deaths overall, but was higher for men (SMR = 1.29: 95% CI: 0.78-2.01) and lower for women (SMR = 0.73: 95% CI: 0.38-1.29). A similar pattern was present for Hodgkin disease (overall SMR = 1.24, 95% CI: 0.53-2.43; SMR for men = 1.83, 95% CI: 0.59-4.27; SMR for women = 0.47, 95% CI: 0.05-11.87), but opposite for myeloma (SMR = 1.19, 95% CI: 0.54-2.26 for women and SMR = 0.61, 95% CI: 0.17-1.56 for men). Standardized mortality ratio results for lymphocytic leukemia were not presented in Steenland et al,25 but leukemia SMRs were near unity overall, for both men and women. Because few studies reported results for the same specific LHM, the small numbers reported for each, and the apparent mixed results by gender, meaningful syntheses at the individual disease level is not possible.
Simple dose–response relationships between EtO exposure estimates such as duration of employment or cumulative exposure and LHM were examined in several studies.13,19,21,25,29,35 No consistent evidence of any dose–response relationship was observed.
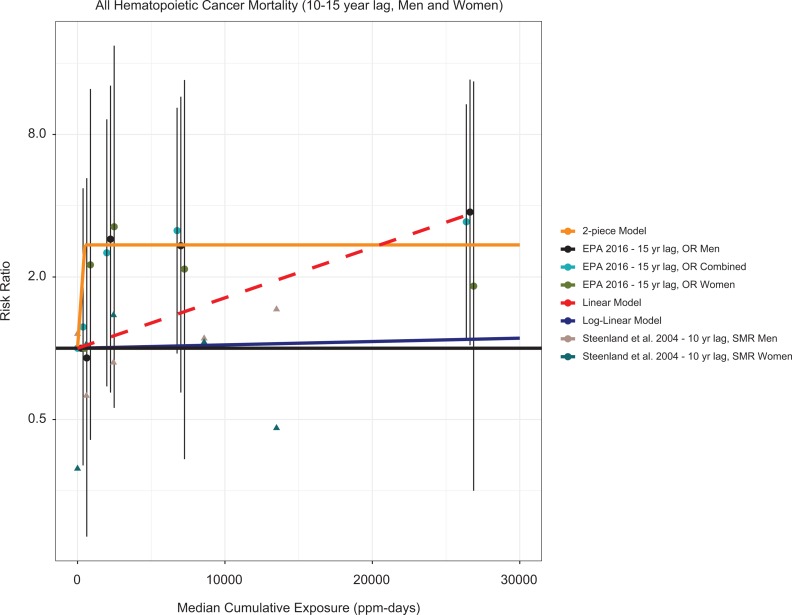
Given the large numbers of LHM deaths reported in Steenland et al25 and the stronger exposure estimates, it in principle should present the best opportunity to evaluate potential dose–response relationships. Figure 5 presents Steenland et al’s25 hematopoietic cancer mortality analyses and dose–response lines using USEPA’s reanalysis of the data from Steenland et al.25 As with the breast cancer analysis, the USEPA’s dose–response analysis did not include a simple linear model; therefore, we fit a linear regression to the reported odds ratios from USEPA,1 with the intercept forced to the origin (as is done with the USEPA’s other models). Based on a weak trend for lymphoid tumors for both genders combined, Steenland et al25 presented a log cumulative exposure model with a 15-year lag for males as the “best fitting” model. However, the large discrepancy between this model and one based on the original study SMR results was not adjudicated.
Figure 5.
SMRs for hematopoietic cancer from Steenland et al25 odds ratios (ORs) of the internal comparison data for breast cancer in USEPA,1 the USEPA1 2-piece linear and log-linear hematopoietic cancer models, and a linear model of the RR data. SMRs are shown as triangles. RR indicates relative risk; SMR, standardized mortality ratio.
Epidemiology Synthesis
For breast cancers, the studies indicated slightly lower risk overall, but among those in the lowest cumulative EtO exposure category, the risk was profoundly lower.24,35 For LHM, the studies rated as medium or high quality demonstrated no increase or decreased risk, although some sporadic associations were reported for specific categories of LHM, with no consistency across studies or specific LHM. Limitations to this body of literature include small numbers of specific LHM, use of weak exposure surrogates in lieu of quantifiable individual exposure data, and possible mixed exposures. Nevertheless, the evidence from several studies of workers exposed to relatively high concentrations of EtO over relatively long duration in a range of workplace settings fails to demonstrate clear or consistent associations between occupational exposure to EtO and breast cancer or LHM as a group. The literature currently precludes evaluation of specific LHM.
Toxicological Evidence of Carcinogenicity
The lack of association between occupational EtO exposure and breast cancer or LHM may reflect the lack of an underlying causal association, at least at the levels to which workers historically had been exposed to EtO. In order to perform quantitative risk assessment, the evaluation of the tumorigenic dose–response for EtO in animals is needed to eliminate these uncertainties and to allow confirmation of the biological relevance (or lack thereof) for these tumors. Tumor incidence data from relevant end points (ie, LHM or breast cancer–related tumors) are summarized in Table 1.
Table 1.
LHM and Mammary Tumor Incidence From 2-Year Bioassays.a
| Study | Species | Concentration (ppm) | Malignant Lymphoma Incidence | Mammary Carcinoma Incidence | Leukemia Incidence |
|---|---|---|---|---|---|
| National Toxicology Program40 | Female B6C3F1 mice | 0 | 18%b | 2% | NR |
| 50 | 13%b | 17%b,c | NR | ||
| 100 | 45%b,c | 12% | NR | ||
| Lynch et al41,43 | Male Fischer 344 rats | 0 | NR | NA | 31% |
| 50 | NR | NA | 48%c | ||
| 100 | NR | NA | 39% | ||
| Snellings et al,42/Garman et al44 | Male Fischer 344 rats | 0 | NR | NA | 13% |
| 10 | NR | NA | 18% | ||
| 33 | NR | NA | 31% | ||
| 100 | NR | NA | 30% | ||
| Female Fischer 344 rats | 0 | NR | 2%-4%d | 9% | |
| 10 | NR | 4%d | 20% | ||
| 33 | NR | 4%d | 29% | ||
| 100 | NR | 8%d | 58%* |
Abbreviations: LHM, lymphohematopoietic malignancies, NA, not applicable; NR, none reported; NTP, National Toxicology Program.
a The original study did not report or identify a tumor-response for this end point.
b Incidences reported in this table reflect those reported by the NTP.40 The EPA’s reported incidence is slightly different.
c Statistically significant.
d The EPA did not report incidence of mammary carcinoma, likely due to the lack of a significant increase in tumor incidence. However, data from the original study42 are reported here.
The available in vivo 2-year cancer bioassays provide limited evidence that EtO causes mammary tumors or LHM,40-42 contradicting the USEPA’s justification for classifying EtO as a known human carcinogen.1 The USEPA stated that there was “extensive” evidence of cancers in laboratory animals (specifically LHM and mammary cancers), but when considering these data for dose–response analysis, only the leukemia incidence data in female Fischer 344 (F344) rats, reported by Snellings et al,42 meet the USEPA’s12 requirements for estimating a benchmark dose (BMD). Specifically, a study requires the following minimal criteria: (1) a minimum of 2 doses with tumor incidence above control and (2) a significant dose-related trend.
Other tumors are noted by the USEPA,1 specifically lung, brain, and uterine cancers. However, BMD models on these end points are not as sensitive as the models of leukemia incidence (data not shown) and would not be recommended for use in derivation of an IUR. Testicular mesothelioma may be equally sensitive to leukemia incidence, but this cancer type is uncommon in humans and the incidence across studies42,43 is highly variable (ie, 13%-27% response at 100 ppm). There is no epidemiological evidence of an EtO-related increase in these tumors.2
Although the F344 rat data42 show an apparent dose–response trend in leukemia incidence, the National Toxicology Program (NTP) ceased use of F344 rats in their 2-year bioassays due to high background control incidence of mononuclear cell leukemia (MNCL).45,46 Historically, approximately 20% to 50% of F344 controls develop MNCL over the course of their lifetime.45 Therefore, the observed leukemia dose–responses in F344 rats may not be relevant to humans.
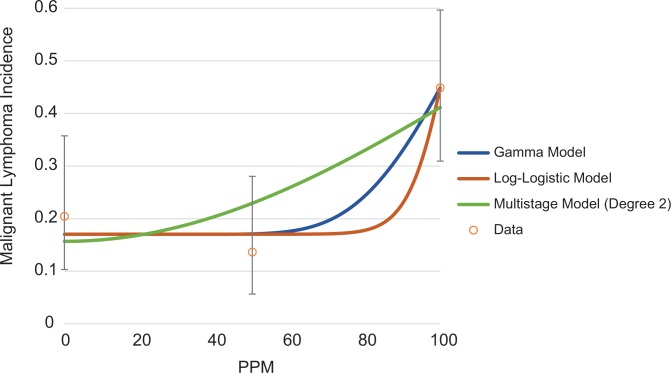
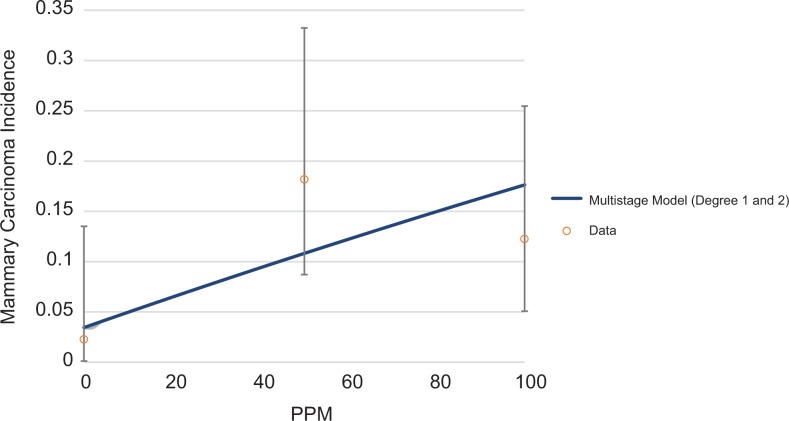
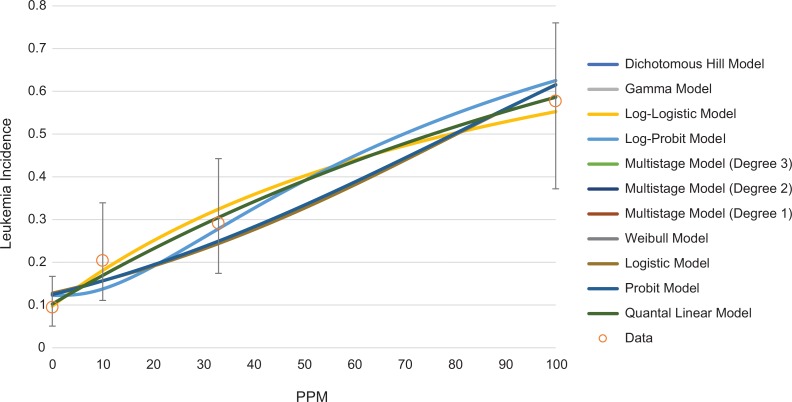
Although most of the animal studies on EtO-associated LHM and mammary tumors are negative and/or do not meet the USEPA’s12 recommended requirements for data selection in dose–response modeling, quantitative dose–response models can be fit to some of the cancer incidence data presented in Table 1. Examples of possible dose–response shapes for lymphoma, mammary carcinoma, and leukemia are shown in Figures 6, 7, and 8, respectively. All models were fit using the USEPA’s BMD Software (BMDS Version 3.1.1). The USEPA’s12 BMD guidance states that only models with a goodness of fit P value >.1 are adequate for use in BMD estimation, although multistage models with a goodness of fit P value >.05 may be considered. For lymphoma, only 2 models, the γ and log-logistic models are appropriate for estimation of a BMD and benchmark dose lower limit (BMDL) for malignant lymphoma, with a P value >.1. The multistage model (2 degrees) has a goodness of fit P value of .07. All of these models predict a concave dose–response (Figure 6). None of the models fit to the mammary carcinoma incidence had adequate fit, but the multistage model (with 1 and 2 degrees) had a goodness of fit P value of .057 and is shown in Figure 7. For leukemia, all models adequately fit the data (Figure 8). Multiple dose–response shapes can be fit to these data with satisfactory model performance, including models with thresholds or concave and convex curves. Additional information on model fit for each end point is provided in the Supplemental Material.
Figure 6.
Array of potential dose–response models fit to NTP’s40 malignant lymphoma incidence data (female mice). NTP indicates National Toxicology Program.
Figure 7.
Multistage (degree 1 and 2) dose–response models fit to NTP’s40 mammary carcinoma incidence data (female mice). NTP indicates National Toxicology Program.
Figure 8.
Array of potential dose–response models fit to Snellings et al’s42 leukemia incidence data (female Fischer rats).
Regardless of the model selected, there is no compelling evidence to indicate—at least at the relatively high doses administered—that the toxicological dose–response data follow a supralinear dose–response, such as the 2-step model used by USEPA in deriving the IUR for EtO. Although threshold or biphasic models may be feasible, there are too few data points associated with exposures clearly below the lowest observable adverse effect level (LOAEL) to validly select one of these.
As with the epidemiological evidence, there is no strong indication of a dose–response relationship between EtO exposure and lymphoma or breast and mammary cancers in rodents. However, a clear dose–response relationship is observed for leukemia (Figure 8) in one study, although the responses were within the range of historical controls. Nevertheless, as shown in Figures 6 to 8, dose–response models can be fit to the animal data and used for estimation of an IUR. The USEPA’s1 assessment did calculate unit risk estimates of approximately 3 to 4.55 × 10⁻⁵ µg/m3 (1-2.5 ppb) from the animal bioassays (see table 4-20 of the USEPA 2016 risk assessment) using a software program called Tox_Risk, rather than the USEPA’s own BMDS. Furthermore, only one model type (multistage) was used, and the USEPA inappropriately dropped data due to nonmonotonic risk patterns. Current USEPA practice is to consider the full suite of models since no model is biologically informed, although USEPA’s BMD guidance does denote an agency preference for the multistage model.9,12 Additionally, although removal of high-dose groups to address non-monotonic dose–responses can be appropriate, it should not be done when there are only 2 exposed groups. The USEPA’s model choices resulted in (ultimately) a straight line between the control and lowest evaluated dose. We therefore reevaluate these unit risk estimates using the USEPA’s recommend BMDs and BMDLs, as calculated by the USEPA’s BMDS software, which has multiple, flexible, dose–response shapes.
The recommended BMDL for lymphoma is approximately 51 ppm, which is adjusted to a lifetime equivalent of 9.1 ppm, based on the dosing regimen (ie, 6 h/d × 5 d/wk).40 This translates to an IUR of 0.011 or a 10−5 risk at 0.9 ppb EtO. Mammary carcinoma incidence is not recommended for dose–response evaluation, but a BMDL of 37 ppm, or 6.6 ppm after duration adjustment (6 h/d × 5 d/wk),40 was predicted by the multistage model (degrees 1 and 2). All of the models adequately fit the leukemia response in female rats,42 but the USEPA’s BMDS software recommends the log-logistic model (BMDL of 6.9 ppm EtO). Because no model was markedly better than another, the modeled average BMDL, as calculated with BMDS Bayesian averaging, of 8.9, or 1.9 ppm after duration adjustment (ie, 7 h/d × 5 d/wk) is also considered. This translates to an IUR of 0.053 or a 10−5 risk at 0.2 ppb.
Synthesis of Animal Carcinogenicity Studies
The animal bioassay data confirm that there is no observed clear treatment-related risk of breast or mammary cancers. Lymphohematopoietic malignancies incidence in animals is unclear and may be a result of high historical background in the tested species. The ability to calculate an IUR for LHM, including lymphoma and leukemia, indicates a possible exposure–response relationship, although the animal data predict exposure-responses that are significantly less potent than those of the EPA’s 2016 analysis. However, the IUR calculated from the leukemia incidence in female rats42 is 20-fold more potent than the risk calculated by Texas Commission on Environmental Quality (TCEQ).4 The IUR calculated from lymphoma incidence in female mice40 is approximately 4-fold more potent than the TCEQ unit risk, under the same assumptions. However, the USEPA’s1 risk estimation is approximately1000-fold more potent than the IURs derived from animal data and the TCEQ unit risk estimate based on the same epidemiological evidence.
Because both the epidemiological and toxicological evidence do not clearly demonstrate an association between EtO exposure and LHM or breast/mammary cancer (contradicting the USEPA1 and IARC2 cancer classifications), we consider MOA information to establish the plausibility of the association between EtO exposure and cancer risk, as well as predict the potential dose–response relationship(s).
Mode of Action
Description of the USEPA’s Proposed MOA
The USEPA’s9 Guidelines for Carcinogen Risk Assessment emphasize use of MOA information in the assessment of the human carcinogenic potential of an agent. Mode of action refers to “a sequence of key events and processes, starting with interaction of an agent with a cell, proceeding through operational and anatomical changes, and resulting in cancer formation.”9 The term key event refers to “an empirically observable precursor step that is itself a necessary element of the MOA or is a biologically based marker for such an element.”9 Chemicals may exhibit carcinogenic action via numerous different modes of action, including mutagenicity, mitogenesis, inhibition of cell death, cytotoxicity with reparative cell proliferation, and immune suppression.9
The USEPA conducted a MOA analysis for EtO carcinogenicity based on the Agency’s MOA framework and concluded that “the weight of evidence supports a mutagenic MOA for EtO carcinogenicity” based on mutagenic, genotoxic, and carcinogenic outcomes in laboratory animal and human evidence.1,9,47 Specifically, the USEPA proposed a mutagenic MOA for all tumor types with the following key events: “(1) DNA adduct formation by EtO, which is a direct-acting alkylating agent; (2) the resulting heritable genetic damage, including DNA mutations, particularly in oncogenes and tumor suppressor genes, and chromosomal alterations; and (3) clonal expansion of mutated cells during later stages of cancer development; eventually resulting in (4) tumor formation.”1 According to the USEPA, while other processes (eg, oxidative stress) may contribute to EtO-induced tumor formation, the available evidence suggests that mutagenesis is the primary MOA and limited to no evidence exists for alternative modes of action.1 This mutagenic MOA is considered to be relevant to both breast cancer and lymphohematopoietic cancers, although additional tumor-specific mechanisms may apply.1 Notably, according to the USEPA’s 2005 Guidelines, a linear low-dose extrapolation approach should be used for a mutagenic MOA.9 Based on this mutagenic MOA, the low-dose response for tumor formation is expected to be linear, but more recent arguments for nonlinear dose–responses and even thresholds also apply.48
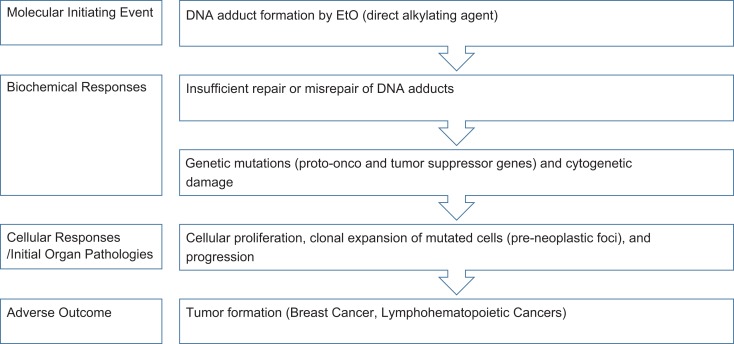
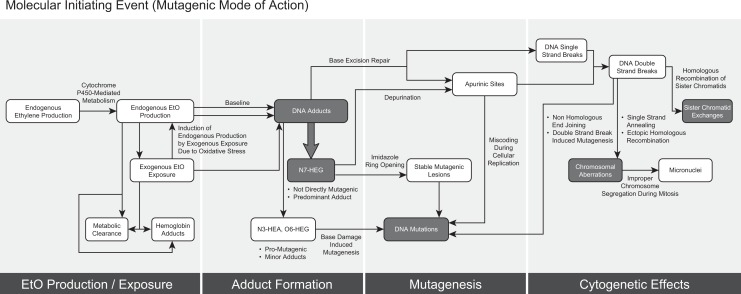
Given the USEPA’s conclusion that EtO exhibits a mutagenic mode of carcinogenic action and using their supporting evidence, the intent of the present analysis was to identify key events in the MOA and evaluate the dose response and interspecies differences in potency for these end points. To identify end points for analysis, we organized the key events proposed by USEPA into response stages and described the proposed MOA in more detail in Figure 9. Further, we have also drawn out details of the mutagenic and genotoxic mechanisms, which expands on the MOA and describes the biochemical and molecular interactions and responses for the key events, for the molecular initiating event and biochemical responses in Figure 10. 49 As summarized by the USEPA, EtO is a direct alkylating agent, which upon exposure to cells, reacts with DNA to form DNA adducts.1 EtO-induced DNA adduct formation is the molecular initiating event, or the initial chemical–organismal interaction at the molecular level that perturbs the cell and triggers the mutagenic MOA.1,50 At the biochemical level, insufficient repair or misrepair of DNA adducts can lead to genetic mutations (potentially in proto-onco and tumor suppressor genes), as well as cytogenetic effects.1 At the cellular and organ levels, proliferation of preneoplastic foci results in clonal expansion of mutated cells, which leads to progression and ultimately formation of mammary tumors or breast cancers and LHM (the adverse outcome).1,49 More detailed descriptions of the 4 key stages are supplied in Supplemental Material, and as expanded in Figure 10.
Figure 9.
Proposed mutagenic mode of action for ethylene oxide carcinogenicity.
Figure 10.
Molecular initiating event (mutagenic mode of action).
Evaluation of Dose–Response for Key Events
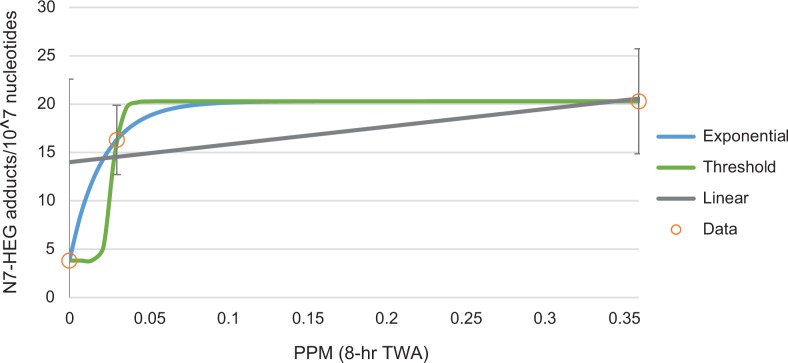
Overall, the proposed genotoxic MOA predicts that, in the low-dose region, the dose–response for cancer is expected to be linear. This predicted dose–response pattern is consistent with the animal tumorigenicity data (see Figures 6 –8) in the range of the data. Dose–response analysis of the early effect data in humans and animals provides no evidence that a dose–response other than linear is justified, given the genotoxic MOA assumption and EPA policy. This determination is not due to an abundance of data suggesting clear, linear dose–response shapes but, instead, a general impression of linearity across the doses administered, as well as uncertainty and variability in the underlying human data that do not suggest departures from the linear low-dose extrapolation default from the current analysis. For example, only one study identified a significant dose–response relationship between EtO exposure and adduct arising from exogenous exposures. Yong et al51 measured exogenous adduct formation in hospital workers and determined that the “high” exposure group had elevated exogenous adduct levels. The study had a sample of only 58 employees, divided between “low” and “high” exposure groups, and compared with 6 controls. The exposure estimates were imprecise and the authors reported “considerable interindividual variation” in adduct levels.51 Because of these study limitations and uncertainties, the observed numbers of adducts are highly variable, allowing for adequate fitting of an array of dose–response models with drastically different shapes (Figure 11). The uncertainties in dose–response shape for the key events, especially when human early effect data are used, demonstrate the importance of MOA when considering and selecting dose–response model shapes.
Figure 11.
Uncertainty in the human data on ethylene oxide exogenous adduct formation allows for fitting of multiple dose–response shapes.
Evaluation of Species-Specific Differences
As noted in previous sections, there are dramatic differences in the expected cancer potency of EtO predicted by studies in animals and humans. Herein, we compare the potency of key events in the USEPA’s proposed genotoxic MOA to determine whether underlying species-specific sensitivity may account for the 100-fold difference in cancer potency calculated by the USEPA.
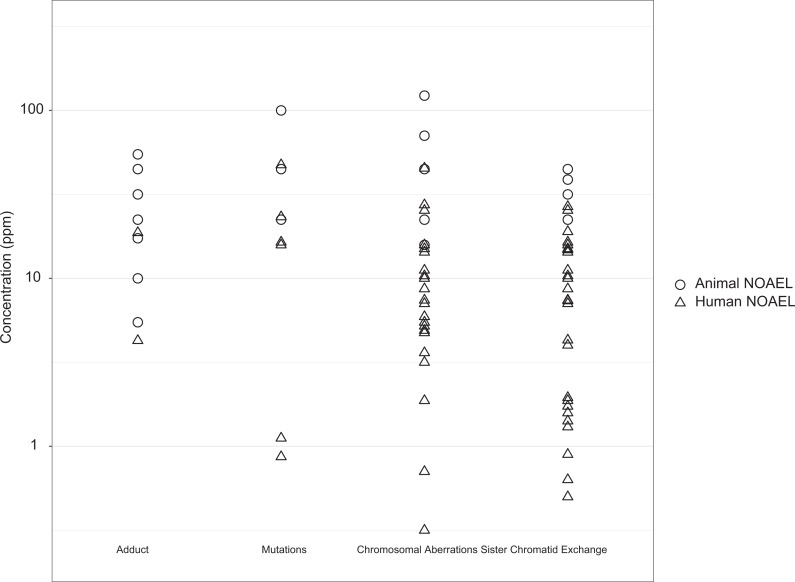
Figure 12 shows the no observed adverse effect level (NOAELs; or NOAEL equivalents) from humans and laboratory animals for selected key end points from the mutagenic MOA. For the interspecies response comparison, we used the USEPA tables 3-6, 3-7, and 3-8 to identify NOAELs or calculate NOAEL equivalents for each end point and study. When a NOAEL was not available, the LOAEL was divided by 10 to obtain a NOAEL equivalent, per the US USEPA’s default LOAEL-to-NOAEL uncertainty factor.52 For animal studies evaluating more than one exposure duration, the longest exposure duration was selected for analysis. For human studies reporting only a range of exposure concentrations, instead of a mean, the mean was calculated and used as the LOAEL or NOAEL. Measurements from human studies that evaluated only acute exposures (not in addition to chronic exposures; ie, accidental exposure group53) or reported exposure concentration as peak or cumulative exposure rather than a time-weighted average or range54,55 were excluded from the figure.
Figure 12.
Human and laboratory animal responses to key events.
The ranges of NOAELs shown in Figure 12 substantially overlap for the selected key end points. The same pattern was observed for micronuclei formation, another indicator of chromosome-level effects (not shown) with a NOAEL range from 20 to 50 ppm for animals and 0.0125 to 22.5 ppm for humans. Although the data suggest some possibility that humans are more sensitive than rodents, this is likely due to artifacts of study design and dosing selection (eg, animal studies use high doses that might not characterize responses at lower doses). Overall, these data demonstrate minimal difference in the human and animal responses to EtO exposure for selected key end points from the mutagenic MOA. Any differences would be in sensitivity, not dose–response shape based on dose–response modeling. This finding is in contrast to the roughly 2 orders of magnitude difference in the USEPA’s total extra cancer IUR calculated based on human and animal data.1
The differences in human and animal responses may be due to human data uncertainty (eg, small sample size, imprecise or uncertain exposures, higher interindividual variability for early biomarkers), or high environmental background exposures. Other possible explanations include differences in baseline physiology as well as toxicokinetics and toxicodynamics between humans and animals. However, comparisons of various measurements of endogenous conditions, exogenous exposures, ADME (absorption, distribution, metabolism, and excretion) characteristics, and effects do not suggest a 100-fold difference in sensitivity between humans and laboratory animals, which again does not justify the 2 orders of magnitude higher cancer potency in humans compared to animals predicted by the USEPA.1
Endogenous production of ethylene is similar between humans and laboratory animals (41 and 2.8 nmol/h in humans and rats, respectively).56 Background N7-HEG adducts in DNA of unexposed laboratory animals and humans and the levels of adducts detected in rodents and humans vary widely and depend on the analytical method used.1 However, Föst et al57 evaluated N7-HEG adducts in lymphocytes from both humans and rats using gas chromatography-mass spectrometry and reported adduct levels on the same order of magnitude (8.5 and 5.6 picomoles/milligram [pmol/mg] DNA, respectively).
Additionally, blood concentrations of EtO in humans, mice, and rats exposed to a particular air concentration of EtO are approximately equal and are linearly related to inhalation concentration.58 Ethylene oxide air/blood partition coefficients for humans and laboratory animals are on the same order of magnitude (61 in humans, 64 in rats, 74 in mice), which the USEPA1 uses to justify using ppm equivalence for cross-species scaling for extrarespiratory effects.58-60 Ethylene oxide blood elimination half-lives are also not 100-fold different between humans and laboratory animals (42 minutes in humans, 11-14 minutes in rats, 2-3 minutes in mice).61-63 These findings further do not support the 2 order of magnitude difference in cancer potency between humans and animals predicted by the USEPA.1
Notably, the available data regarding EtO metabolism suggest that glutathione conjugation dominates in smaller animals such as mice and to a lesser extent rats (∼20% in humans, ∼60% in rats, ∼80% in mice) and hydrolysis dominates in larger species, including humans (∼80% in humans, 40% in rats, and 20% in mice).1,64 Although both of these pathways are considered detoxifying, the glutathione pathway is faster but saturable, and mice have been shown to shift to slower hydrolysis at higher exposures.1,62
Specific laboratory animals generally have higher background cancer rates than humans for some tumor types. For example, background MNCL rates in Fisher rats from NTP studies approach 50%.45,65
Overall, the relative species differences in these various markers of exposure and effect for EtO for which data are available do not align with the orders of magnitude difference in cancer potency suggested by the USEPA-derived IUR from the epidemiology studies.
Discussion and Conclusions
Despite IARC’s conclusion that “There is limited evidence in humans for a causal association of EtO with lymphatic and haematopoietic cancers…and breast cancer,” and USEPA’s acknowledging that the epidemiological evidence was “strong, but less than conclusive on its own,” USEPA selected 2 epidemiological studies conducted by NIOSH as the basis for their derivation of the IUR for EtO. However, as demonstrated by our review and synthesis of the epidemiological evidence, occupational exposure to EtO was not clearly or consistently associated with the increased occurrence of breast cancers or LHM—or any cancer. In fact, one of the NIOSH studies demonstrated an anomalously statistically significant deficit of breast cancer among the least exposed workers, and no increase among more highly exposed workers. Similarly, fewer than expected LHM were observed in the lowest exposed group and no increase overall or among more highly exposed workers. Unfortunately, little consistency was found in the way study results were reported for specific LHM. Ideally, had results for at least major categories of LHM (eg, lymphomas, leukemias, myeloid malignancies, and perhaps their more common subtypes) been reported across more studies, a fuller evaluation might have been possible. Interpretation of risks associated with all LHM remains challenging unless the individual diseases comprising the group are evaluated.
Because further statistical analysis of “relative risk” designated the lowest exposed workers as the “referent” category, the groups of more highly exposed workers appeared to be at increased risk of breast cancers and LHM (specifically the subset described as “lymphoid cancers”). Although designating the least exposed members of a cohort as the referent constitutes a standard methodology in epidemiology, proper application requires verification that the group designated as the referent validly represents the background rate (ie, that unrelated to exposure) and does not have an unexplained (due to chance, bias, or possible biphasic effect) higher or lower rate of disease. In the USEPA risk assessment, the basic study data demonstrating no increased risk (and perhaps a “protective” effect among low exposure groups) appear to have been dropped in favor of the RR models recalibrated to the reduced risk of the referent groups.
The broader body of epidemiological studies demonstrates no increased cancer risks. We conclude that the epidemiological evidence may not reach the level described by IARC as “limited” and certainly does not comport with USEPA’s conclusion that the evidence was “strong” (and presumably positive). This alone may not call into question the classification of EtO as a known human carcinogen but also does not support it. The measures of association and dose–response analyses in Steenland et al25 and Swaen et al29 were heavily relied upon by the USEPA when they concluded that EtO was carcinogenic to humans, as both of these studies had adequate sample size, quantifiable measurements of EtO exposure, and sufficient follow-up time.1 Steenland et al25 examined many cancers and reported a significant increased risk of bone cancer and NHL for males in the highest exposure category. However, the other subtypes of lymphohematopoietic cancers were not significantly increased at any level of exposure and their use of the transformed log cumulative EtO exposure metric limits these results. Similar to Steenland et al,25 Swaen et al29 investigated the association between EtO exposure and many cancers but did not report a significantly increased risk of any cancer or with each increasing exposure category. Additionally, the study by Swaen et al29 was limited to only men and had mixed exposures to other chemicals besides EtO.
Although we did not perform a new critical review of the animal toxicology studies on EtO and cancer, we did reconsider the animal studies identified in the USEPA review of EtO. Most of the study results were negative. This observation also is in striking contrast with USEPA’s conclusion that there is “extensive evidence of carcinogenicity in laboratory animals, including lymphohematopoietic cancers in rats and mice and mammary carcinomas in mice following inhalation exposure.” One study of leukemia in female F344 rats does provide results that include 2 doses above background42; however, this study was conducted in a species with an unusually high background rate of leukemia and increases uncertainty in its use for risk assessment. However, this remains the only study demonstrating a clear dose–response relationship. Interestingly, the dose–response function appears to be linear at the levels tested (ie, not precluding a threshold, given the consistently negative epidemiology studies). This further challenges the USEPA’s use of a supralinear 2-slope dose–response function, albeit on the recalibrated epidemiological data.
Our review of the carcinogenic potential for EtO demonstrates the necessity of examining the evidence at the cellular level including an evaluation of the MOA and key events. Ethylene oxide is expected to be mutagenic and genotoxic in both humans and animals, but there is no evidence, based on evaluation of key events, that suggests animals and humans have highly different tumorigenic response rates (ie, no interspecies pharmacokinetic correction is needed) or response patterns. Evaluation of potential kinetic, dynamic, or metabolic differences between humans and laboratory animals did not identify significant differences that would explain or predict the drastic differences in toxicology- versus epidemiology-based IUR calculations.
Based on the USEPA’s proposed genotoxic MOA, EtO at adequately high concentrations might be expected to increase cancer risk at some target tissues or organs. However, integrating this hypothesis with the negative epidemiological literature and animal toxicology evidence—which, at best, offers limited evidence of a carcinogenic response—aligns most closely with a classification of EtO as no more than “suggestive evidence of carcinogenic potential.”9
Given that EtO is plausibly carcinogenic based on the most likely MOA, a quantitative risk assessment may be warranted. However, the evidentiary basis for the risk assessment becomes problematic, as does the selection of the most appropriate dose–response model. The extensive evaluation of candidate models performed by Steenland et al24,25 resulted in the selection of a 2-stage spline model representing a steeply upward inclination followed by a segment with a more attenuated slope, which performed comparably well to a square root model. However, all of the models considered were “relative risk” models essentially recalibrated to the anomalously low-risk level (ie, deficit risk) documented among the lowest exposed workers used as the referent group. It is understandable how the first segment of the 2-stage spine model appeared to indicate a greater risk slope than across higher exposure groups: It represents the change in risk from a group with an anomalous deficit of cancers back up to the background risk.
Reasons why the least exposed groups demonstrated lower than expected cancer rates are intriguing. A similar pattern was seen in studies conducted by Marsh et al66,67 on chloroprene exposure and risk of both lung and liver cancers, where overall slight deficits appeared to be driven by clear deficits in the lowest exposure group.68 These observations raise important methodological questions regarding the underlying dose–response relationship and whether the risk deficits observed among the lowest exposure groups reflect a protective effect, chance, or some form of study bias. Considering that many epidemiologists assume that the cancer rate in the lowest exposure group (often without validating this assumption), the potential problem may be more widespread.
Given that the epidemiological evidence is negative (including the NIOSH studies), we recommend that a proper risk assessment validly cannot be based on the epidemiological findings. Furthermore, the integration of the different lines of evidence does not justify deviating from the USEPA’s standard dose–response guidance, that is, a modeling approach using MOA and the best available evidence—which for EtO comes only from one possibly questionable study of leukemia in female F344 rats. Assuming this study was valid for quantitative risk assessment, due to high species–specific background rates of leukemia, the dose–response (at least across the specific doses studied) may follow a linear dose–response relationship. We conclude, based on a focused critical review, synthesis and integration of the published epidemiological and toxicological studies on the carcinogenicity of EtO—informed by consideration of the MOA—that the scientific basis for both IARC’s and USEPA’s classification of EtO as a known human carcinogen is not as strong as stated in their respective reviews. Further, the USEPA’s derivation of the IUR for EtO using a 2-piece, supralinear dose–response model—giving rise to one of the highest cancer potency estimates—appears not to be adequately justified based on the published literature and deviates from USEPA standard risk assessment guidance.
Supplemental Material
Supplemental_Material_-_MOA_-_updated for Ethylene Oxide: Cancer Evidence Integration and Dose–Response Implications by Melissa J. Vincent, Jordan S. Kozal, William J. Thompson, Andrew Maier, G. Scott Dotson, Elizabeth A. Best and Kenneth A. Mundt in Dose-Response
Supplemental Material
Supplemental_Tables_S1-S6 for Ethylene Oxide: Cancer Evidence Integration and Dose–Response Implications by Melissa J. Vincent, Jordan S. Kozal, William J. Thompson, Andrew Maier, G. Scott Dotson, Elizabeth A. Best and Kenneth A. Mundt in Dose-Response
Acknowledgments
The authors thank Mike Tyson and Rebecca Gorman for graphical assistance.
Note
This reflects a summary rating for statistical analysis. For both Steenland et al24 and Mikoczy et al,35 relative risk analyses were performed using as the referent group the group with the lowest estimated cumulative exposure, without verifying that this group reflects the risk of the truly unexposed population. Because this category of workers demonstrated statistically significant deficits in breast cancer risk, bias was introduced when they were used as the referent group. In neither study was this identified as problematic or the subsequent relative risk analyses justified.
Footnotes
Declaration of Conflicting Interests: The author(s) declared the following potential conflicts of interest with respect to the research, authorship, and/or publication of this article: All of the authors are salaried employees of Cardno ChemRisk and this article was prepared as part of their usual employment responsibilities. The preparation of the manuscript is the exclusive professional work of the authors and may not necessarily reflect the views of Cardno ChemRisk or the parent company, Cardno. Prior to preparing this manuscript, W.J.T. and K.A.M. provided scientific consulting services to Vantage Specialty Chemicals, Inc, which served as the impetus for proposing and conducting this critical review and synthesis of the scientific evidence on EtO and cancer risk.
Funding: The author(s) disclosed receipt of the following financial support for the research and/or authorship of this article: The study was supported by Vantage Specialty Chemicals, Inc. The financial sponsor was not involved in any aspect of review and had no access to the draft manuscript prior to submission to and acceptance by Dose-Response.
ORCID iD: William J. Thompson  https://orcid.org/0000-0002-9457-3234
Supplemental Material: Supplemental material for this article is available online.
References
- 1. United States Environmental Protection Agency. Evaluation of the Inhalation Carcinogenicity of Ethylene Oxide (CASRN 75-21-8). In Support of Summary Information on the Integrated Risk Information System (IRIS). EPA/635/R-16/350Fa Washington, DC: National Center for Environmental Assessment, Office of Research and Development, U.S. Environmental Protection Agency; 2016. [Google Scholar]
- 2. International Agency for Research on Cancer. IARC Monographs on the Evaluation of Carcinogenic Risks to Humans. Volume 100: A Review of Human Carcinogens Part F: Chemical Agents and Related Occupations. Lyon, France, International Agency for Research on Cancer; World Health Organization; 2012. [Google Scholar]
- 3. United States Environmental Protection Agency. Health Assessment Document for Ethylene Oxide. Final Report. EPA/600/8-84/009F Research Triangle Park, NC: Environmental Criteria and Assessment Office, Office of Health and Environmental Assessment, Office of Research and Development, U.S. Environmental Protection Agency; 1985. [Google Scholar]
- 4. Texas Commission on Environmental Quality. Proposed Ethylene Oxide Carcinogenic Dose-Response Assessment; 2019. Development Support Document. CAS Registry Number: 75–21-8. [Google Scholar]
- 5. United States Environmental Protection Agency. Draft Risk Evaluation for 1,4-Dioxane. Systematic Review Supplemental File: Updates to the Data Quality Criteria for Epidemiological Studies. Washington, DC: Office of Chemical Safety and Pollution Prevention, U.S. Environmental Protection Agency; 2019. [Google Scholar]
- 6. Kirman CR, Hays SM. Derivation of endogenous equivalent values to support risk assessment and risk management decisions for an endogenous carcinogen: ethylene oxide. Regul Toxicol Pharmacol. 2017;91:165–172. [DOI] [PubMed] [Google Scholar]
- 7. Agency for Toxic Substances and Disease Registry. Community Cancer Risks: Letter Health Consultation. “Evaluation of the Potential Impacts from Ethylene Oxide Emissions.”. 2018. Sterigenics International Inc. Willowbrook, Illinois: https://www.atsdr.cdc.gov/HAC/pha/sterigenic/Sterigenics_International_Inc-508.pdf. Accessed November 12, 2019. [Google Scholar]
- 8. Illinois Environmental Protection Agency. Environmental Protection Agency of the State of Illinois. Seal Order. 2019. https://www2.illinois.gov/epa/topics/community-relations/sites/sterigenics/Documents/Sterigenics_02152019164622.pdf. Accessed November 12, 2019.
- 9. United States Environmental Protection Agency. Guidelines for Carcinogen Risk Assessment. EPA/630/P-03/001F Washington, DC: Risk Assessment Forum, U.S. Environmental Protection Agency; 2005. [Google Scholar]
- 10. United States Environmental Protection Agency. Application of Systematic Review in TSCA Risk Evaluations. Office of Chemical Safety and Pollution Prevention. EPA Document #740-P1-8001 Washington, DC: Office of Chemical Safety and Pollution Prevention, U.S. Environmental Protection Agency; 2018. [Google Scholar]
- 11. United States Environmental Protection Agency. EPA in Illinois. Questions and Answers: About the Current Monitoring Data. 2019. https://www.epa.gov/il/questions-and-answers-about-current-monitoring-data#detection. Accessed November 12, 2019.
- 12. United States Environmental Protection Agency. Benchmark Dose Technical Guidance. EPA/100/R-12/001 Washington, DC: Risk Assessment Forum, U.S. Environmental Protection Agency; 2012. [Google Scholar]
- 13. Kiran S, Cocco P, Mannetje A, et al. Occupational exposure to ethylene oxide and risk of lymphoma. Epidemiology. 2010;21(6):905–910. [DOI] [PubMed] [Google Scholar]
- 14. Hogstedt LC. Epidemiological studies on ethylene oxide and cancer: an updating. IARC Sci Publ. 1988;(89):265–270. [PubMed] [Google Scholar]
- 15. Hogstedt C, Malmqvist N, Wadman B. Leukemia in workers exposed to ethylene oxide. JAMA. 1979;241(11):1132–1133. [PubMed] [Google Scholar]
- 16. Hogstedt C, Rohlen O, Berndtsson BS, Axelson O, Ehrenberg L. A cohort study of mortality and cancer incidence in ethylene oxide production workers. Br J Ind Med. 1979;36(4):276–280. [DOI] [PMC free article] [PubMed] [Google Scholar]
- 17. Hogstedt C, Aringer L, Gustavsson A. Epidemiologic support for ethylene oxide as a cancer-causing agent. JAMA. 1986;255(12):1575–1578. [PubMed] [Google Scholar]
- 18. Kiesselbach N, Ulm K, Lange HJ, Korallus U. A multicenter mortality study of workers exposed to ethylene oxide. Br J Ind Med. 1990;47(3):182–188. [DOI] [PMC free article] [PubMed] [Google Scholar]
- 19. Bisanti L, Maggini M, Raschetti R, et al. Cancer mortality in ethylene oxide workers. Br J Ind Med. 1993;50(4):317–324. [DOI] [PMC free article] [PubMed] [Google Scholar]
- 20. Norman SA, Berlin JA, Soper KA, Middendorf BF, Stolley PD. Cancer incidence in a group of workers potentially exposed to ethylene oxide. Int J Epidemiol. 1995;24(2):276–284. [DOI] [PubMed] [Google Scholar]
- 21. Olsen GW, Lacy SE, Bodner KM, et al. Mortality from pancreatic and lymphopoietic cancer among workers in ethylene and propylene chlorohydrin production. Occup Environ Med. 1997;54(8):592–598. [DOI] [PMC free article] [PubMed] [Google Scholar]
- 22. Coggon D, Harris EC, Poole J, Palmer KT. Mortality of workers exposed to ethylene oxide: extended follow up of a British cohort. Occup Environ Med. 2004;61(4):358–362. [DOI] [PMC free article] [PubMed] [Google Scholar]
- 23. Gardner MJ, Coggon D, Pannett B, Harris EC. Workers exposed to ethylene oxide: a follow up study. Br J Ind Med. 1989;46(12):860–865. [DOI] [PMC free article] [PubMed] [Google Scholar]
- 24. Steenland K, Whelan E, Deddens J, Stayner L, Ward E. Ethylene oxide and breast cancer incidence in a cohort study of 7576 women (United States). Cancer Causes Control. 2003;14(6):531–539. [DOI] [PubMed] [Google Scholar]
- 25. Steenland K, Stayner L, Deddens J. Mortality analyses in a cohort of 18,235 ethylene oxide exposed workers: follow up extended from 1987 to 1998. Occup Environ Med. 2004;61(1):2–7. [PMC free article] [PubMed] [Google Scholar]
- 26. Steenland K, Stayner L, Greife A, et al. Mortality among workers exposed to ethylene oxide. N Engl J Med. 1991;324(20):1402–1407. [DOI] [PubMed] [Google Scholar]
- 27. Stayner L, Steenland K, Greife A, et al. Exposure-response analysis of cancer mortality in a cohort of workers exposed to ethylene oxide. Am J Epidemiol. 1993;138(10):787–798. [DOI] [PubMed] [Google Scholar]
- 28. Wong O, Trent LS. An epidemiological study of workers potentially exposed to ethylene oxide. Occup Environ Med. 1993;50:308–316. doi:10.2307/27727609. [DOI] [PMC free article] [PubMed] [Google Scholar]
- 29. Swaen GM, Burns C, Teta JM, Bodner K, Keenan D, Bodnar CM. Mortality study update of ethylene oxide workers in chemical manufacturing: a 15 year update. J Occup Environ Med. 2009;51(6):714–723. [DOI] [PubMed] [Google Scholar]
- 30. Teta MJ, Sielken RL, Jr, Valdez-Flores C. Ethylene oxide cancer risk assessment based on epidemiological data: application of revised regulatory guidelines. Risk Anal. 1999;19(6):1135–1155. [DOI] [PubMed] [Google Scholar]
- 31. Benson LO, Teta MJ. Mortality due to pancreatic and lymphopoietic cancers in chlorohydrin production workers. Br J Ind Med. 1993;50(8):710–716. [DOI] [PMC free article] [PubMed] [Google Scholar]
- 32. Teta MJ, Benson LO, Vitale JN. Mortality study of ethylene oxide workers in chemical manufacturing: a 10 year update. Br J Ind Med. 1993;50(8):704–709. [DOI] [PMC free article] [PubMed] [Google Scholar]
- 33. Greenberg HL, Ott MG, Shore RE. Men assigned to ethylene oxide production or other ethylene oxide related chemical manufacturing: a mortality study. Br J Ind Med. 1990;47(4):221–230. [DOI] [PMC free article] [PubMed] [Google Scholar]
- 34. Valdez-Flores C, Sielken RL, Jr, Teta MJ. Quantitative cancer risk assessment based on NIOSH and UCC epidemiological data for workers exposed to ethylene oxide. Regul Toxicol Pharmacol. 2010;56:312–320. doi:10.1016/j.yrtph .2009.10.001. [DOI] [PubMed] [Google Scholar]
- 35. Mikoczy Z, Tinnerberg H, Bjork J, Albin M. Cancer incidence and mortality in Swedish sterilant workers exposed to ethylene oxide: updated cohort study findings 1972-2006. Int J Environ Res Public Health. 2011;8(6):2009–2019. [DOI] [PMC free article] [PubMed] [Google Scholar]
- 36. Hagmar L, Welinder H, Linden K, Attewell R, Osterman-Golkar S, Tornqvist M. An epidemiological study of cancer risk among workers exposed to ethylene oxide using hemoglobin adducts to validate environmental exposure assessments. Int Arch Occup Environ Health. 1991;63(4):271–277. [DOI] [PubMed] [Google Scholar]
- 37. Hagmar L, Mikoczy Z, Welinder H. Cancer incidence in Swedish sterilant workers exposed to ethylene oxide. Occup Environ Med. 1995;52(3):154–156. [DOI] [PMC free article] [PubMed] [Google Scholar]
- 38. Steenland K, Seals R, Klein M, Jinot J, Kahn HD. Risk estimation with epidemiologic data when response attenuates at high-exposure levels. Environ Health Perspect. 2011;119:831–837. doi:10.1289/ehp.1002521. [DOI] [PMC free article] [PubMed] [Google Scholar]
- 39. Swaen GM, Slangen JM, Ott MG, et al. Investigation of a cluster of ten cases of Hodgkin’s disease in an occupational setting. Int Arch Occup Environ Health. 1996;68:224–228. [DOI] [PubMed] [Google Scholar]
- 40. National Toxicology Program. Toxicology and carcinogenesis studies of ethylene oxide (CAS no 75-21-8) in B6C3F1 mice (inhalation studies). Natl Toxicol Program Tech Rep Ser. 1987;326:1–114. [PubMed] [Google Scholar]
- 41. Lynch DW, Lewis TR, Moorman WJ, et al. Carcinogenic and toxicologic effects of inhaled ethylene oxide and propylene oxide in F344 rats. Toxicol Appl Pharmacol. 1984;76(1):69–84. [DOI] [PubMed] [Google Scholar]
- 42. Snellings WM, Weil CS, Maronpot RR. A two-year inhalation study of the carcinogenic potential of ethylene oxide in Fischer 344 rats. Toxicol Appl Pharmacol. 1984;75(1):105–117. [DOI] [PubMed] [Google Scholar]
- 43. Lynch DW, Lewis TR, Moorman WJ, et al. Sister-chromatid exchanges and chromosome aberrations in lymphocytes from monkeys exposed to ethylene oxide and propylene oxide by inhalation. Toxicol Appl Pharmacol. 1984;76(1):85–95. [DOI] [PubMed] [Google Scholar]
- 44. Garman RH, Snellings WM, Maronpot RR. Brain tumors in F344 rats associated with chronic inhalation exposure to ethylene oxide. Neurotoxicology. 1985;6:117–137. [PubMed] [Google Scholar]
- 45. King-Herbert A, Thayer K. NTP workshop: animal models for the NTP rodent cancer bioassay: stocks and strains—should we switch? Toxicol Pathol.2006;34(6):802–805. [DOI] [PMC free article] [PubMed] [Google Scholar]
- 46. King-Herbert AP, Sills RC, Bucher JR. Commentary: update on animal models for NTP studies. Toxicol Pathol. 2010;38(1):180–181. [DOI] [PubMed] [Google Scholar]
- 47. United States Environmental Protection Agency. 2007. Framework for determining a mutagenic mode of action for carcinogenicity. EPA 120/R-07/002-A. External Peer Review Draft. Washington, DC: Risk Assessment Forum, U.S. Environmental Protection Agency; 2007. [Google Scholar]
- 48. Clewell RA, Thompson CM, Clewell HJ., III Dose-dependence of chemical carcinogenicity: biological mechanisms for thresholds and implications for risk assessment. Chem Biol Interact. 2019;301:112–127. [DOI] [PubMed] [Google Scholar]
- 49. Becker RA, Dellarco V, Seed J, et al. Quantitative weight of evidence to assess confidence in potential modes of action. Regul Toxicol Pharmacol. 2017;86:205–220. [DOI] [PubMed] [Google Scholar]
- 50. Organization for Economic Co-Operation and Development. OECD Environment, Health and Safety Publications, Series on Testing and Assessment, No. 233. Users’ Handbook Supplement to the Guidance Document for Developing and Assessing AOPs. Paris: Inter-Organization Programme for the Sound Management of Chemicals; 2016. [Google Scholar]
- 51. Yong LC, Schulte PA, Kao CY, et al. DNA adducts in granulocytes of hospital workers exposed to ethylene oxide. Am J Ind Med. 2007;50:293–302. [DOI] [PubMed] [Google Scholar]
- 52. United States Environmental Protection Agency. A Review of the Reference Dose (RfD) and Reference Concentration (RfC) Processes. EPA/630/P-02/002F Washington, DC: Risk Assessment Forum, U.S. Environmental Protection Agency; 2002. [Google Scholar]
- 53. Tates AD, Boogaard PJ, Darroudi F, et al. Biological effect monitoring in industrial workers following incidental exposure to high concentrations of ethylene oxide. Mutat Res. 1995;329(1):63–77. [DOI] [PubMed] [Google Scholar]
- 54. Popp W, Vahrenholz C, Przygoda H, et al. DNA-protein cross-links and sister chromatid exchange frequencies in lymphocytes and hydroxyethyl mercapturic acid in urine of ethylene oxide-exposed hospital workers. Int Arch Occup Environ Health. 1994;66:325–332. doi:10.1007/BF00378365. [DOI] [PubMed] [Google Scholar]
- 55. Yager JW, Benz RD. Sister chromatid exchanges induced in rabbit lymphocytes by ethylene oxide after inhalation exposure. Environ Mutagen. 1982;4(2):121–134. [DOI] [PubMed] [Google Scholar]
- 56. Shen J, Kessler W, Denk B, Filser JG. Metabolism and endogenous production of ethylene in rat and man. Arch Toxicol Suppl. 1989;13:237–239. [DOI] [PubMed] [Google Scholar]
- 57. Föst U, Marczynski B, Kasemann R, Peter H. Determination of 7-(2-hydroxyethyl)guanine with gas chromatography/mass spectrometry as a parameter for genotoxicity of ethylene oxide. Arch Toxicol Suppl. 1989;13:250–253. [DOI] [PubMed] [Google Scholar]
- 58. Fennell TR, Brown CD. A physiologically based pharmacokinetic model for ethylene oxide in mouse, rat, and human. Toxicol Appl Pharmacol. 2001;173(3):161–175. [DOI] [PubMed] [Google Scholar]
- 59. Krishnan K, Gargas ML, Fennell TR, Andersen ME. A physiologically based description of ethylene oxide dosimetry in the rat. Toxicol Ind Health. 1992;8(3):121–140. [DOI] [PubMed] [Google Scholar]
- 60. Csanády GA, Denk B, Pütz C, et al. A physiological toxicokinetic model for exogenous and endogenous ethylene and ethylene oxide in rat, mouse, and human: formation of 2-hydroxyethyl adducts with hemoglobin and DNA. Toxicol Appl Pharmacol. 2000;165(1):1–26. [DOI] [PubMed] [Google Scholar]
- 61. Filser JG, Denk B, Törnqvist M, Kessler W, Ehrenberg L. Pharmacokinetics of ethylene in man; body burden with ethylene oxide and hydroxyethylation of hemoglobin due to endogenous and environmental ethylene. Arch Toxicol. 1992;66(3):157–163. [DOI] [PubMed] [Google Scholar]
- 62. Brown CD, Asgharian B, Turner MJ, Fennell TR. Ethylene oxide dosimetry in the mouse. Toxicol Appl Pharmacol. 1998;148(2):215–221. [DOI] [PubMed] [Google Scholar]
- 63. Brown CD, Wong BA, Fennell TR. In vivo and in vitro kinetics of ethylene oxide metabolism in rats and mice. Toxicol Appl Pharmacol. 1996;136(1):8–19. [DOI] [PubMed] [Google Scholar]
- 64. International Agency for Research on Cancer. IARC Monographs on the Evaluation of Carcinogenic Risks to Humans: 1,3-Butadiene, Ethylene Oxide and Vinyl Halides (Vinyl Fluoride, Vinyl Chloride and Vinyl Bromide). Lyon, France: International Agency for Research on Cancer; 2008. [PMC free article] [PubMed] [Google Scholar]
- 65. Klaassen C. ed. Casarett & Doull’s Toxicology: The Basic Science of Poisons. 8th ed; 2013. [Google Scholar]
- 66. Marsh GM, Youk AO, Buchanich JM, et al. Mortality patterns among industrial workers exposed to chloroprene and other substances. I. general mortality patterns. Chem Biol Interact. 2007;166(1-3):301–316. [DOI] [PubMed] [Google Scholar]
- 67. Marsh GM, Youk AO, Buchanich JM, et al. Mortality patterns among industrial workers exposed to chloroprene and other substances. II. Mortality in relation to exposure. Chem Biol Interact. 2017;166(1-3):301–316. [DOI] [PubMed] [Google Scholar]
- 68. Sax S, Gentry R, Van Landingham C, et al. Extended analysis and evidence integration of chloroprene as a human carcinogen. Risk Anal. Epub ahead of print 16 September 2019. doi:10.1111/risa.13397. [DOI] [PMC free article] [PubMed] [Google Scholar]
Associated Data
This section collects any data citations, data availability statements, or supplementary materials included in this article.
Supplementary Materials
Supplemental_Material_-_MOA_-_updated for Ethylene Oxide: Cancer Evidence Integration and Dose–Response Implications by Melissa J. Vincent, Jordan S. Kozal, William J. Thompson, Andrew Maier, G. Scott Dotson, Elizabeth A. Best and Kenneth A. Mundt in Dose-Response
Supplemental_Tables_S1-S6 for Ethylene Oxide: Cancer Evidence Integration and Dose–Response Implications by Melissa J. Vincent, Jordan S. Kozal, William J. Thompson, Andrew Maier, G. Scott Dotson, Elizabeth A. Best and Kenneth A. Mundt in Dose-Response


