

Abstract
Interleukin (IL)-18 is an interferon γ-inducing inflammatory cytokine associated with function of the immune system and other physiological functions. IL-18-deficient (Il18-/-) mice exhibit obesity, dyslipidemia, non-alcoholic steatohepatitis and depressive-like behavioral changes. Therefore, IL-18 has a number of important roles associated with immunity, energy homeostasis and psychiatric conditions. In the present study, gene expression in the brains of Il18-/- mice was analyzed to identify genes associated with the depressive-like behaviors and other impairments displayed by Il18-/- mice. Using whole genome microarray analysis, gene expression patterns in the brains of Il18+/+ and Il18-/- mice at 6 and 12 weeks of age were examined and compared. Subsequently, genes were categorized using Ingenuity® Pathway Analysis (IPA). At 12 weeks of age, 2,805 genes were identified using microarray analysis. Genes related to ‘Major depression’ and ‘Depressive disorders’ were identified by IPA core analysis, and 13 genes associated with depression were isolated. Among these genes, fibroblast growth factor receptor 1 (Fgfr1); protein tyrosine phosphatase, non-receptor type 1 (Ptpn1); and urocortin 3 (Ucn3) were classed as depression-inducing and the other genes were considered depression-suppressing genes. Subsequently, the interactions between the microarray results at 6 weeks of age and the above three depression-inducing genes were analyzed to search for effector genes of depression at 12 weeks of age. This analysis identified cyclin D1 (Ccnd1) and NADPH oxidase 4 (Nox4). The microarray analysis results were correlated with the results of reverse transcription-quantitative PCR (RT-qPCR). Overall, the results suggest that Fgfr1, Ptpn1 and Ucn3 may be involved in depression-like changes and Ccnd1 and Nox4 regulate these three genes in IL-18-deficient mice.
Keywords: interleukin-18, depression, learning and memory, brain, major depressive disorder
Introduction
Major depressive disorder (MDD) has a high worldwide prevalence. Several hypotheses regarding the mechanism of development of MDD have been proposed, including an immunological mechanism involving cytokines (1,2). Increased levels of proinflammatory cytokines, such as interleukin (IL)-6 and tumor necrosis factor-α (TNF-α), have been identified in patients with MDD by meta-analyses (3). Clinical trials of a cyclooxygenase-2 inhibitor to suppress inflammation in patients with MDD produced symptomatic improvements; however, the immunological mechanisms underlying MDD are not understood in detail.
IL-18 was initially identified as an interferon-γ inducing factor (4). An inactive 24-kDa precursor form of IL-18 is cleaved by activated caspase-1 to a mature 18-kDa active form (4-7). In addition to its role as an inflammatory cytokine, IL-18 also serves a role in energy metabolism, and in the central nervous system it is involved in psychiatric disorders such as depression (8-12). Regarding energy homeostasis, IL-18 deficiency induces bulimia, corpulency and insulin resistance which resembles type 2 diabetes mellitus (8). IL-18-deficient mice also exhibit dyslipidemia leading to nonalcoholic fatty liver disease and steatohepatitis (9), and hippocampal impairments that may cause depression-like behavioral changes (12). Therefore, IL-18 is closely related to energy homeostasis, central nervous system function, and the occurrence of psychiatric disorders such as depression. However, the biological mechanism by which Il-18 contributes to these processes remains unclear.
In our previous study (12), it was demonstrated that the aforementioned behavioral changes were the result of hippocampal impairments; however, other parts of the brain, including the prefrontal cortex and amygdala, are also responsible for depression (13,14). Therefore, to determine the biological and molecular mechanisms responsible for depression caused by IL-18 deficiency, additional analyses of other brain regions are required.
In the present study, candidate genes which may be involved in the induction of depressive-like behavioral changes were identified by comparing gene expression in the brains of Il18+/+ and Il18-/- mice. At 12 weeks of age, a time at which Il18-/- mice start to exhibit depression-like behavioral changes, the genes with a |>1.5|-fold change were identified and analyzed using Ingenuity® Pathway Analysis (IPA) as described previously (10,11). Subsequently, to explore candidate genes associated with depression at 12 weeks of age, microarray analysis was performed to compare expression at 6 and 12 weeks of age to screen for effector genes that induce depression. Finally, to confirm the microarray results, reverse transcription-quantitative PCR (RT-qPCR) was performed.
Materials and methods
Details regarding RNA purification, microarray analysis, RT-qPCR, and IPA (Ingenuity® Systems; ingenuity.com) have been described in our previous studies (15-17).
Animals
Il18-/- C57BL/6 male mice were used in the present study (18). Littermate Il18+/+ male mice were used as the controls. Mice were housed in groups of 3-5 in polycarbonate cages in a controlled environment (temperature, 22±1˚C; humidity, 50-60%; and a 12-h light/dark cycle) with free access to water and food (MF; Oriental Yeast Co., Ltd.). A total of three Il18+/+ and three Il18-/- mice were used for microarray and RT-qPCR analysis.
Animal experiments performed in the present study were performed in accordance with the Guide for the Care and Use of Laboratory Animals published by the National Institutes of Health and approved by the Animal Care Committee of Hyogo College of Medicine (Hyogo, Japan; approval nos. #28041, #13-062, #14-020 and #16-013) prior to performing the animal experiments.
Sample collection
Mice were euthanized by deep anesthesia using 5% isoflurane inhalation at 10:00 a.m., and lack of ventilation was used to confirm euthanasia. The brains were removed and immediately placed in liquid nitrogen and subsequently kept at -80˚C until required.
RNA purification
Total RNA was extracted and purified from mice brains using a Sepasol-RNA I Super kit (Nacalai Tesque, Inc.) according to the manufacturer's protocol. Genomic DNA contamination was removed using 5 units RNase free DNase I at 37˚C for 30 min. After phenol/chloroform extraction and ethanol precipitation, total RNA was dissolved in de-ionized water. RNA concentrations were measured using NanoDrop 1000 spectrophotometry (NanoDrop Technologies; Thermo Fisher Scientific, Inc.).
Microarray analysis
Expression profiling was performed as described previously (9). Raw data were imported into Subio platform version 1.18 (Subio, Inc.) and normalized. Differentially expressed genes between Il18+/+ and Il18-/- mouse brains were defined by signal ratios of |>1.5|-fold. Data can be accessed in Gene Expression Omnibus (accession no. GSE64307).
Heatmap design
Heatmaps were created using the regHeatmap function of the Heatplus package (heatmaps with row and/or column covariates and colored clusters; github.com/alexploner/Heatplus) in R version 2.30.0.
IPA
IPA (version spring 2019) was used to determine the functionality of microarray results and for the interpreting the gene profiling data. To investigate molecular mechanisms affected by IL-18 expression, core analysis was performed with the following settings: Tissue, Brain; all other settings, default. The network explorer of IPA was used to detect relevant interactions among genes extracted at 6 and 12 weeks of age and to reveal the shortest direct pathways between genes without protein-protein interactions.
RT-qPCR
Brain samples from mice at 6 or 12 weeks of age were used for analysis of expression. A total of 5 ng/reaction total RNA was used, extracted as described above and was analyzed using RNA-direct SYBR-Green Real-Time PCR Master mix and a One-step qPCR kit (Toyobo Life Science). Samples were run in duplicate reactions in 384-well plates. Median threshold cycle values were used to calculate the fold changes between group samples. The fold change values were normalized to Gapdh levels using the relative standard curve method. qPCR was performed using QuantiStudio™ 12K Flex (Thermo Fisher Scientific, Inc.). The reverse transcription and thermocycling conditions were: 90˚C for 30 sec and 20 min at 61˚C for reverse transcription; followed by 45 cycles of 98˚C for 1 sec, 67˚C for 15 sec and 74˚C for 35 sec. The primer sequences for RT-qPCR are shown in Table I.
Table I.
Primer sequences.
| Gene (GenBank Accession no.) | Sequence, 5'-3' |
|---|---|
| Aqp4 (NM_009700) | |
| Forward | CTTCCGCCCATCGAATGCTC |
| Reverse | CGACATTTGCAGCACATTGTCT |
| Bdnf (NM_007540) | |
| Forward | CGCCCATGAAAGAAGTAAACGTCCA |
| Reverse | GGCCCATTCACGCTCTCC |
| Btg1 (NM_007569) | |
| Forward | GGCTTTGTCCGCATTTCCATAGCAG |
| Reverse | CTTTGCCCATGAGGTACACGTT |
| Btg2 (NM_007570) | |
| Forward | CTGCCTCCTGGTCTCATGCTT |
| Reverse | ACAGTCCAGCTCTAGGGTTT |
| Cd46 (NM_010778) | |
| Forward | GCCTACTCATCCTACCAAGCCT |
| Reverse | TTGGCTAAATATTCCTTCACGGGGAC |
| Chga (NM_007693) | |
| Forward | CCAATACCCAATCACCAACCAGC |
| Reverse | TCTCACTGTCTCCCGTGGC |
| Cplx1 (NM_007756) | |
| Forward | TCTGCAAGGTTTGGCTTAAGAATTCCA |
| Reverse | ACCCGCTCCAAATCTATTGCT |
| Crh (NM_205769) | |
| Forward | AGAGAGCCTATATACCCCTTAATTAGCAT |
| Reverse | AGCATGGGCAATACAAATAACGC |
| Drp2 (NM_010078) | |
| Forward | CCACAACAAGCAGCTCGAGT |
| Reverse | GAGCCATTGCCATCTGATTCACT |
| Eif6 (NM_010579) | |
| Forward | CACCCTAAAACTTCTATCGAGGACCA |
| Reverse | CCTCGGTTCACAGTGCCT |
| Fgfr1 (NM_010206) | |
| Forward | ATCATAATGGATTCTGTGGTGCCT |
| Reverse | CTCATTCTCCACGATGCAGGT |
| Gapdh (NM_008084) | |
| Forward | CCTTCCGTGTTCCTACCCCCAAT |
| Reverse | TTGATGTCATCATACTTGGCAGGTTTCTC |
| Hgs (NM_001159328) | |
| Forward | GACTCTCAGCCCATAACTCCCT |
| Reverse | CTCATGGCTCTCCTCCGACT |
| Htr2c (NM_008312) | |
| Forward | GCATACCAATGAACGTGTAGTTAGGAA |
| Reverse | GGCAGCTCTAAATTCTCTACCTGCATC |
| Kif5b (NM_008448) | |
| Forward | CTCACGGTTATGCAAGACAGACGA |
| Reverse | CACGGTCTCCTCCAAACCC |
| Ptpn1 (NM_011201) | |
| Forward | ACACTGGAGCCTCACAACGG |
| Reverse | CCAGGCTGTCTTCATCCCC |
| Ucn3 (NM_031250) | |
| Forward | GGGCACCAAGTTCACCCTT |
| Reverse | CGCAAATTCTTGGCCTTGTCG |
Aqp4, aquaporin 4; Bdnf, brain derived neurotrophic factor; Btg, BTG anti-proliferation factor; Chga, chromogranin A; Cplx1, complexin 1; Crh, corticotropin releasing hormone; Drp2, Dystrophin Related Protein 2; Eif6, eukaryotic translation 6; Hgs, hepatocyte growth factor-regulated tyrosine kinase substrate; Ucn3, urocortin 3; Fgfr1, fibroblast growth factor receptor 1; Ptpn1, protein tyrosine phosphatase, non-receptor type 1; Kif5b, kinesin family member 5B; Htr2c, 5-hydroxytryptamine receptor 2C.
Statistical analysis
All results are expressed as the mean ± standard deviation. Sigmaplot™ (version 11.0; Systat Software, Inc.) was used for all statistical analyses. The microarray results were analyzed using a Student's t-test and correlations between the microarray and RT-qPCR results were analyzed using Spearman's rank correlation tests. All analyses were performed >2 times to confirm the results. P<0.05 was considered to indicate a statistically significant difference.
Results
Identification and categorization of differentially expressed genes in Il18-/- mice
The heatmaps of the microarray results at 6 and 12 weeks of age are shown in Fig. 1A and B, respectively. A total of 699 and 2,805 genes showed a |>1.5|-fold-change (Il18-/-/Il18+/+) in expression at 6 and 12 weeks of age, respectively, and were extracted for further analysis. The results of IPA core analysis are shown in Table II. Based on the results of IPA, 13 genes associated with ‘Major depression’ and ‘Depressive disorder’ were identified: Aquaporin 4 (Aqp4), BTG anti-proliferation factor (Btg)1, Btg2, CD46, chromogranin A, complexin 1, corticotropin releasing hormone, eukaryotic translation initiation factor 6, fibroblast growth factor receptor 1 (Fgfr1), hepatocyte growth factor-regulated tyrosine kinase substrate (Hgs), kinesin family member 5B (Kif5b), protein tyrosine phosphatase, non-receptor type 1 (Ptpn1) and urocortin 3 (Ucn3). The heatmap of extracted genes is shown in Fig. 1C.
Figure 1.
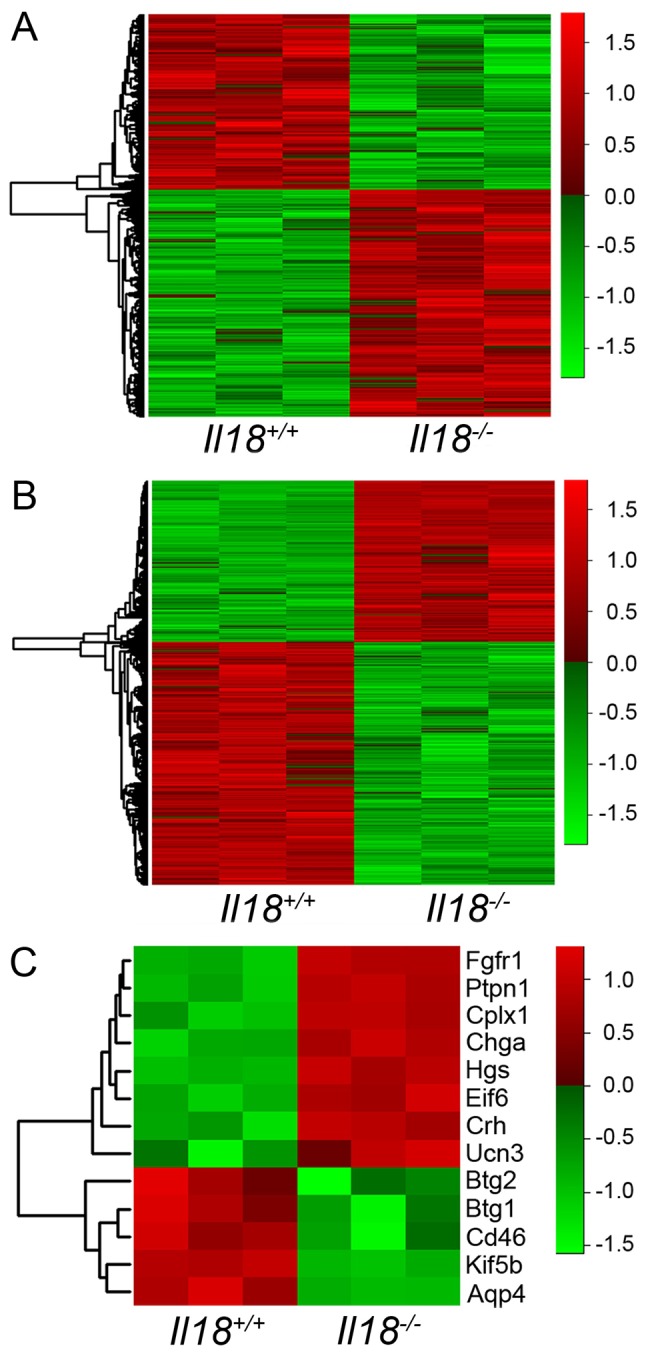
Heatmap analyses of gene expression profiles between Il18+/+ and Il18-/- mice. Heatmap of microarray results at (A) 6 and (B) 12 weeks of age. (C) Heatmap of 13 extracted genes associated with depression at 12 weeks of age. The levels of gene expression are shown in different colors, which transistion from green to red with increasing expressions. IL, interleukin; Aqp4, aquaporin 4; Btg, BTG anti-proliferation factor; Chga, chromogranin A; Cplx1, complexin 1; Crh, corticotropin releasing hormone; Eif6, eukaryotic translation 6; Hgs, hepatocyte growth factor-regulated tyrosine kinase substrate; Ucn3, urocortin 3; Fgfr1, fibroblast growth factor receptor 1; Ptpn1, protein tyrosine phosphatase, non-receptor type 1; Kif5b, kinesin family member 5B.
Table II.
Disease association or functional annotation of differentially expressed genes at 12 weeks of age based on Ingenuity Pathway Analysis.
| Diseases or function annotation | P-value | No. of genes |
|---|---|---|
| Demyelination | 0.00817 | 5 |
| Neuropathy of brain | 0.0130 | 3 |
| Despair behavior | 0.0135 | 2 |
| Fear memory acquisition | 0.0135 | 2 |
| Apoptosis of anterior pituitary cells | 0.0135 | 2 |
| Childhood adrenoleukodystrophy | 0.0135 | 2 |
| Feeding | 0.0219 | 8 |
| Astrocytoma | 0.0221 | 41 |
| Anorexia | 0.0238 | 3 |
| Grade 1-4 astrocytoma | 0.0255 | 40 |
| Abnormal morphology of molecular layer of cerebellum | 0.0304 | 5 |
| Major depression | 0.0357 | 12 |
| Brain astrocytoma | 0.0367 | 39 |
| Depressive disorder | 0.0375 | 13 |
| Apoptosis of neural precursor cells | 0.0381 | 3 |
| Injury of cortical neurons | 0.0381 | 3 |
| Movement disorders | 0.0388 | 44 |
| Emotional behavior | 0.0433 | 8 |
| Central nervous system neuroepithelial tumor | 0.0434 | 48 |
| High grade astrocytoma | 0.0444 | 38 |
| Glioma | 0.0454 | 48 |
| Abnormality of cerebral cortex | 0.0467 | 38 |
| Glioma cancer | 0.0472 | 44 |
| Low grade astrocytoma | 0.0491 | 5 |
Interactions between depression-associated genes and Il18-/--specific genes at 6 weeks of age
Interaction pathway analysis was used to identify genes responsible for regulating depression-associated genes. As shown in Fig. 2, the interactions deemed to be significant in the pathway analysis are shown for 10 genes: Adenosine A2a receptor (Adora2a), cyclin D1 (Ccnd1), CCAAT enhancer binding protein delta, D-box binding PAR bZIP transcription factor, endothelin 1, Fos proto-oncogene, AP-1 transcription factor subunit, FosB proto-oncogene, AP-1 transcription factor subunit, HRas proto-oncogene, GTPase, Notch1 and NADPH oxidase 4 (Nox4).
Figure 2.
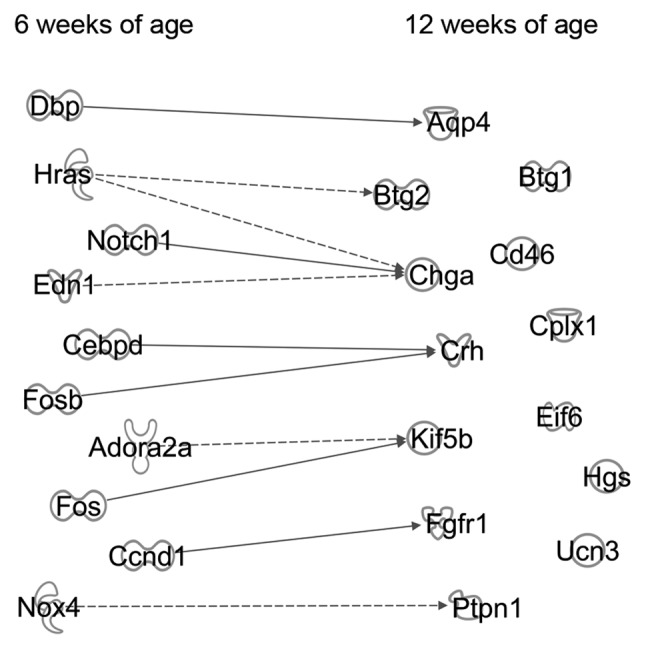
Pathway analysis amongst the depression-associated molecules at 12 weeks of age and their effector genes at 6 weeks of age. Interactions between 13 depression-inducing genes at 12 weeks of age and Il18-/--specific genes at 6 weeks of age were analyzed. The figure indicates the associations between genes. Solid and dotted lines represent direct and indirect associations, respectively.
Depression-inducing genes in Il18-/- mice at 12 weeks of age
The 13 genes extracted in mice 12 weeks of age were separated into depression-inducing and depression-suppressing genes based on previous studies (19-21). Among these 13 genes, Fgfr1, Ptpn1 and Ucn3 may be associated with the development of MDD (depression-inducing), whereas the other 10 genes may be depression-suppressing genes in MDD.
Interactions between depression-inducing and -suppressing genes at 12 weeks of age with the 10 extracted genes at 6 weeks of age
The interactions between the three depression-inducing genes at 12 weeks of age, Fgfr1, Ptpn1 and Ucn3, and 10 genes at 6 weeks of age were examined and it was found that Ccnd1 and Nox4 may affect development of depression. Ccnd1 inhibition increases the expression of Fgfr1 (22), and Nox4 decreases Ptpn1 expression (23).
Correlation between microarray and RT-qPCR results
To confirm the microarray analysis results, RT-qPCR was performed, and a correlation test was performed between the results of the microarray analysis and RT-qPCR (Table III). To determine the correlation between microarray and RT-qPCR analysis, Spearman's rank correlation coefficient analysis was performed for each group (6-week-old group: P=0.014, ρ=0.60; 12-week-old group: P=0.007, ρ=0.64; Fig. 3).
Table III.
Comparison of microarray and RT-qPCR gene expression data at 6 and 12 weeks of age.
| A, 6 weeks of age | ||
|---|---|---|
| Gene symbol | FC (RT-qPCR) | FC (Microarray) |
| Aqp4 | 0.875 | 0.808 |
| Bdnf | 1.074 | 1.190 |
| Btg1 | 0.702 | 0.651 |
| Btg2 | 1.255 | 1.470 |
| Cd46 | 1.249 | 1.312 |
| Chga | 0.631 | 0.980 |
| Cplx1 | 0.714 | 1.029 |
| Crh | 0.817 | 1.290 |
| Drp2 | 0.931 | 1.311 |
| Eif6 | 0.834 | 1.143 |
| Fgfr1 | 0.743 | 0.963 |
| Hgs | 1.019 | 1.145 |
| Htr2c | 0.768 | 0.684 |
| Kif5b | 0.875 | 0.636 |
| Ptpn1 | 1.059 | 1.237 |
| Ucn3 | 0.758 | 1.280 |
| B, 12 weeks of age | ||
| Gene symbol | FC (RT-qPCR) | FC (Microarray) |
| Aqp4 | 0.665 | 0.481 |
| Bdnf | 1.247 | 1.014 |
| Btg1 | 0.558 | 0.813 |
| Btg2 | 0.625 | 0.552 |
| Cd46 | 0.611 | 0.563 |
| Chga | 1.085 | 1.594 |
| Cplx1 | 1.148 | 1.604 |
| Crh | 1.165 | 1.742 |
| Drp2 | 1.431 | 1.202 |
| Eif6 | 0.890 | 0.965 |
| Fgfr1 | 0.922 | 1.610 |
| Hgs | 1.036 | 1.618 |
| Htr2c | 0.645 | 0.872 |
| Kif5b | 0.808 | 0.524 |
| Ptpn1 | 1.542 | 1.336 |
| Ucn3 | 1.328 | 1.609 |
Aqp4, aquaporin 4; Bdnf, brain derived neurotrophic factor; Btg1, BTG anti-proliferation factor; Chga, chromogranin A; Cplx1, complexin 1; Crh, corticotropin releasing hormone; Drp2, Dystrophin Related Protein 2; Eif6, eukaryotic translation initiation factor 6; Fgfr1, fibroblast growth factor receptor 1; Hgs, hepatocyte growth factor-regulated tyrosine kinase substrate; Htr2c, 5-hydroxytryptamine receptor 2C; Kif5b, kinesin family member 5B; Ptpn1, protein tyrosine phosphatase, non-receptor type 1; Ucn3, urocortin 3; RT-qPCR, reverse transcription quantitative polymerase chain reaction; FC (RT-qPCR), fold change based on the results obtained from RT-qPCR; FC (microarray), fold change based on the results obtained from microarray analysis.
Figure 3.

Correlation plots between the results of microarray analysis and RT-qPCR at (A) 6 (P=0.014, ρ=0.60) and (B) 12 weeks of age (P=0.007, ρ=0.64). RT-qPCR, reverse transcription-quantitative PCR.
Discussion
The present study identified potentially novel IL-18 pathways in the brain based on the core analysis, 13 genes were identified to be associated with depression at 12 weeks of age; in particular, Fgfr1, Ptpn1 and Ucn3 which may be responsible for causing depression in Il18-/- mice. Ccnd1 and Nox4 at 6 weeks of age interacted with Fgfr1 and Ptpn1, indicating that Ccnd1 and Nox4 may be causative genes and the microarray and RT-qPCR results were significantly correlated.
In our previous study, impaired learning and memory, and depressive-like behavioral changes in Il18-/- mice at 12 weeks of age were observed (12). To identify the genes responsible for IL18 associated depression, microarray analysis of gene expression in brains from Il18+/+ and Il18-/- mice and IPA core analysis were performed using previously described procedures (17). In the core analysis results, the function and annotation of ‘Major depression’ and ‘Depressive disorder’ were generated automatically. From the microarray results, 13 genes at 12 weeks of age were associated with ‘depression’. Among these 13 genes, three, Fgfr1, Ptpn1 and Ucn3, have previously been causally associated with ‘Major depression’ and ‘Depressive disorder’ (19,21). Fgfr1 has been implicated in the development of the brain and self-renewal of neural precursor cells (24,25). In Il18-/- mice, neurogenesis is decreased (12); therefore, the increased expression of Fgfr1 may be a compensatory response to the decrease in neurons during a depressive state. Ptpn1 serves a role in negatively regulating insulin signaling. Ptpn1 deficiency increases insulin sensitivity and obesity resistance (26). In the present study, in the Il18-/- mice, the expression of Ptpn1 was increased, and it has previously been shown that IL18-/- mice exhibit insulin resistance and obesity (8). Ucn3 is associated with stress-induced anxiety and depression, and with energy homeostasis. Expression of Ucn3 in the rostral perifornical area of the brain regulates not only anxiety-like behaviors but also glucose metabolism of the body (27,28). The expression of Ucn3 in Il18-/- mice at 12 weeks of age was increased; thus, a deficiency in IL-18 might increase the expression of Ptpn1 and Ucn3, resulting in not only depressive-like behavioral changes but also in an energy imbalance. Additionally, in clinical studies on patients with MDD, the mRNA expression levels of Fgfr1, Ptpn1 and Ucn3 were increased in the prefrontal cortex compared with healthy controls (19,21). The expression of Fgfr1, Ptpn1 and Ucn3 in Il18-/- mice at 12 weeks of age was higher compared with the Il18+/+ mice based on the microarray results. The localization of expression of these genes were determined using the BrainStars database (brainstars.org) (29). Fgfr1 expression is upregulated in the pontine nucleus and hippocampus, Ptpn1 is expressed in the anterior olfactory bulb and hippocampus, and Ucn3 is expressed in the paraventricular hypothalamic nucleus and amygdala. Together, these results suggest that these three genes are expressed in the brain and are involved in depression.
In contrast to these three genes, the other 10 genes identified may have the opposite effect on depression, according to previous findings (19,20,30). For example, upregulated Aqp4 expression in the prefrontal cortex was associated with MDD in patients. However, the expression of Aqp4 in Il18-/- mice was decreased, and the other nine genes also exhibited similar changes. Therefore, these results suggest the existence of a negative feedback process in MDD.
To analyze the molecular regulation of the three genes at 12 weeks of age (Fgfr1, Ptpn1, and Ucn3), interaction pathway analysis was performed, and based on the results, Ccnd1 and Nox4 were extracted. Inhibition of Ccnd1 expression increases Fgfr1 mRNA levels in humans (31) and reduced expression of Nox4-activated PTPN1 protein expression in humans (23). These findings suggest that Ccnd1 and Nox4 may regulate expression of Fgfr1 and Ptpn1, and thus may be responsible for inducing a depressive state in IL-18 deficiency.
In our previous study, it was shown that decreased expression of Ccnd1 in the liver of Il18-/- mice at 6 and 12 weeks of age may be causally associated with energy imbalance through the Wnt signaling pathway (9). In the present study, a similar change was observed in Il18-/- mice at 6 weeks of age. Wnt signaling is indispensable for hippocampal memory function (32) and is also associated with depressive symptoms in an animal model of depression (33). Accordingly, Ccnd1 may regulate energy levels and depression in Il18-/- mice.
Another gene extracted at 6 weeks of age, Adora2a, also affected Kif5b expression at 12 weeks of age. The expression of Adora2a was increased and Kif5b was decreased, and Adora2a inhibition may have decreased Kif5b expression in the present study, which differs from the results of a previous study (34). Neuroinflammation is significantly associated with MDD. In particular, inflammatory cytokines, such as TNF-α, have been identified as mediators of MDD by impairing the function of the blood brain barrier (35-37). Increased Adora2a expression in cerebral endothelial cells may induce blood-brain barrier leakage resulting in the impairment of hippocampal memory function (38). Therefore, these findings indicate that increased expression of Adora2a at 6 weeks of age may be responsible for inducing the behavioral phenotypes of Il18-/- mice through neuroinflammation.
To assess the correlation between the microarray and RT-qPCR results, Spearman's rank correlation coefficient analysis was performed, and a significant correlation was detected between the results.
A limitation of the present study was that the molecular analysis was performed using whole brains; therefore, genes affected by IL-18 only in select areas may not have been detected, and further molecular studies using specific parts of the brain are thus warranted. In addition, a more notable limitation is that the present study did not analyze protein expression levels encoded for by the identified genes. The identified genes may be associated with depression; however the protein expression and protein localization in the brain are required to determine interactions between IL-18 and the proteins encoded for by the extracted genes. Additionally, further studies using in vitro and in vivo models are also required.
In conclusion, the gene expression profile of Il18-/- mice brain was examined and an association between the expression of certain genes and a depressive phenotype in mice was identified. Fgfr1, Ptpn1 and Ucn3 may be associated with depression, and may be regulated by Ccnd1 and Nox4. Furthermore, Adora2a and Ccnd1 may contribute to depression when expression of IL-18 is downregulated.
In our previous study, it was hypothesized that IL-18 may serve as a novel option for treatment of metabolic disorders, such as diabetes mellitus and dyslipidemia, and for neuropsychiatric disorders, such as MDD (9,11,12). The results of the present study support the notion that IL-18 may serve as a novel treatment strategy of metabolic and neuropsychiatric disorders, including MDD.
Acknowledgements
The authors would like to thank Mr. Nobutaka Okamura and Mrs. Naomi Gamachi for their technical support, Mr. Nobutaka Okamura for his assistance with animal care and the collection of samples, and Mrs. Naomi Gamachi for assistance with the experiments.
Funding
The present study was supported by JSPS KAKENHI (grant no. JP17K16404) and by the Takeda Science Foundation (2019).
Availability of data and materials
The datasets shown and/or analyzed in the present study are available from the corresponding author on reasonable request.
Authors' contributions
KY and HM designed the study. TH, MM, KM, KI, NU, TI, and DO performed experiments. YW, HO, and HY analyzed the data. KY and HM wrote the manuscript. All authors read and approved the final manuscript.
Ethics approval and consent to participate
Animal experiments were approved by the Animal Care Committee of Hyogo College of Medicine (Hyogo, Japan; approval nos. #28041, #13-062, #14-020, and #16-013) prior to beginning animal experiments.
Patient consent for publication
Not applicable.
Competing interests
The authors declare that they have no competing interests.
References
- 1.Maes M. Major depression and activation of the inflammatory response system. Adv Exp Med Biol. 1999;461:25–46. doi: 10.1007/978-0-585-37970-8_2. [DOI] [PubMed] [Google Scholar]
- 2.Yirmiya R, Weidenfeld J, Pollak Y, Morag M, Morag A, Avitsur R, Barak O, Reichenberg A, Cohen E, Shavit Y, Ovadia H. Cytokines, ‘depression due to a general medical condition’ and antidepressant drugs. Adv Exp Med Biol. 1999;461:283–316. doi: 10.1007/978-0-585-37970-8_16. [DOI] [PubMed] [Google Scholar]
- 3.Dowlati Y, Herrmann N, Swardfager W, Liu H, Sham L, Reim EK, Lanctôt KL. A meta-analysis of cytokines in major depression. Biol Psychiatry. 2010;67:446–457. doi: 10.1016/j.biopsych.2009.09.033. [DOI] [PubMed] [Google Scholar]
- 4.Okamura H, Tsutsi H, Komatsu T, Yutsudo M, Hakura A, Tanimoto T, Torigoe K, Okura T, Nukada Y, Hattori K, et al. Cloning of a new cytokine that induces IFN-gamma production by T cells. Nature. 1995;378:88–91. doi: 10.1038/378088a0. [DOI] [PubMed] [Google Scholar]
- 5.Okamura H, Tsutsui H, Kashiwamura S, Yoshimoto T, Nakanishi K. Interleukin-18: A novel cytokine that augments both innate and acquired immunity. Adv Immunol. 1998;70:281–312. doi: 10.1016/s0065-2776(08)60389-2. [DOI] [PubMed] [Google Scholar]
- 6.Tsutsui H, Kayagaki N, Kuida K, Nakano H, Hayashi N, Takeda K, Matsui K, Kashiwamura S, Hada T, Akira S, et al. Caspase-1-independent, Fas/Fas ligand-mediated IL-18 secretion from macrophages causes acute liver injury in mice. Immunity. 1999;11:359–367. doi: 10.1016/s1074-7613(00)80111-9. [DOI] [PubMed] [Google Scholar]
- 7.Ghayur T, Banerjee S, Hugunin M, Butler D, Herzog L, Carter A, Quintal L, Sekut L, Talanian R, Paskind M, et al. Caspase-1 processes IFN-gamma-inducing factor and regulates LPS-induced IFN-gamma production. Nature. 1997;386:619–623. doi: 10.1038/386619a0. [DOI] [PubMed] [Google Scholar]
- 8.Netea MG, Joosten LA, Lewis E, Jensen DR, Voshol PJ, Kullberg BJ, Tack CJ, van Krieken H, Kim SH, Stalenhoef AF, et al. Deficiency of interleukin-18 in mice leads to hyperphagia, obesity and insulin resistance. Nat Med. 2006;12:650–656. doi: 10.1038/nm1415. [DOI] [PubMed] [Google Scholar]
- 9.Yamanishi K, Maeda S, Kuwahara-Otani S, Watanabe Y, Yoshida M, Ikubo K, Okuzaki D, El-Darawish Y, Li W, Nakasho K, et al. Interleukin-18-deficient mice develop dyslipidemia resulting in nonalcoholic fatty liver disease and steatohepatitis. Transl Res. 2016;173:101–114.e7. doi: 10.1016/j.trsl.2016.03.010. [DOI] [PubMed] [Google Scholar]
- 10.Yamanishi K, Mukai K, Hashimoto T, Ikubo K, Nakasho K, El-Darawish Y, Li W, Okuzaki D, Watanabe Y, Hayakawa T, et al. Physiological and molecular effects of interleukin-18 administration on the mouse kidney. J Transl Med. 2018;16(51) doi: 10.1186/s12967-018-1426-6. [DOI] [PMC free article] [PubMed] [Google Scholar]
- 11.Yamanishi K, Maeda S, Kuwahara-Otani S, Hashimoto T, Ikubo K, Mukai K, Nakasho K, Gamachi N, El-Darawish Y, Li W, et al. Deficiency in interleukin-18 promotes differentiation of brown adipose tissue resulting in fat accumulation despite dyslipidemia. J Transl Med. 2018;16(314) doi: 10.1186/s12967-018-1684-3. [DOI] [PMC free article] [PubMed] [Google Scholar]
- 12.Yamanishi K, Doe N, Mukai K, Ikubo K, Hashimoto T, Uwa N, Sumida M, El-Darawish Y, Gamachi N, Li W, et al. Interleukin-18-deficient mice develop hippocampal abnormalities related to possible depressive-like behaviors. Neuroscience. 2019;408:147–160. doi: 10.1016/j.neuroscience.2019.04.003. [DOI] [PubMed] [Google Scholar]
- 13.Amat J, Baratta MV, Paul E, Bland ST, Watkins LR, Maier SF. Medial prefrontal cortex determines how stressor controllability affects behavior and dorsal raphe nucleus. Nat Neurosci. 2005;8:365–371. doi: 10.1038/nn1399. [DOI] [PubMed] [Google Scholar]
- 14.Hamilton JP, Siemer M, Gotlib IH. Amygdala volume in major depressive disorder: A meta-analysis of magnetic resonance imaging studies. Mol Psychiatry. 2008;13:993–1000. doi: 10.1038/mp.2008.57. [DOI] [PMC free article] [PubMed] [Google Scholar]
- 15.Yamanishi K, Doe N, Sumida M, Watanabe Y, Yoshida M, Yamamoto H, Xu Y, Li W, Yamanishi H, Okamura H, Matsunaga H. Hepatocyte nuclear factor 4 alpha is a key factor related to depression and physiological homeostasis in the mouse brain. PLoS One. 2015;10(e0119021) doi: 10.1371/journal.pone.0119021. [DOI] [PMC free article] [PubMed] [Google Scholar]
- 16.Ikubo K, Yamanishi K, Doe N, Hashimoto T, Sumida M, Watanabe Y, El-Darawish Y, Li W, Okamura H, Yamanishi H, Matsunaga H. Molecular analysis of the mouse brain exposed to chronic mild stress: The influence of hepatocyte nuclear factor 4α on physiological homeostasis. Mol Med Rep. 2017;16:301–309. doi: 10.3892/mmr.2017.6577. [DOI] [PubMed] [Google Scholar]
- 17.Yoshida M, Watanabe Y, Yamanishi K, Yamashita A, Yamamoto H, Okuzaki D, Shimada K, Nojima H, Yasunaga T, Okamura H, et al. Analysis of genes causing hypertension and stroke in spontaneously hypertensive rats: Gene expression profiles in the brain. Int J Mol Med. 2014;33:887–896. doi: 10.3892/ijmm.2014.1631. [DOI] [PubMed] [Google Scholar]
- 18.Takeda K, Tsutsui H, Yoshimoto T, Adachi O, Yoshida N, Kishimoto T, Okamura H, Nakanishi K, Akira S. Defective NK cell activity and Th1 response in IL-18-deficient mice. Immunity. 1998;8:383–390. doi: 10.1016/s1074-7613(00)80543-9. [DOI] [PubMed] [Google Scholar]
- 19.Tochigi M, Iwamoto K, Bundo M, Sasaki T, Kato N, Kato T. Gene expression profiling of major depression and suicide in the prefrontal cortex of postmortem brains. Neurosci Res. 2008;60:184–191. doi: 10.1016/j.neures.2007.10.010. [DOI] [PubMed] [Google Scholar]
- 20.Tezval H, Jahn O, Todorovic C, Sasse A, Eckart K, Spiess J. Cortagine, a specific agonist of corticotropin-releasing factor receptor subtype 1, is anxiogenic and antidepressive in the mouse model. Proc Natl Acad Sci USA. 2004;101:9468–9473. doi: 10.1073/pnas.0403159101. [DOI] [PMC free article] [PubMed] [Google Scholar]
- 21.Kang HJ, Adams DH, Simen A, Simen BB, Rajkowska G, Stockmeier CA, Overholser JC, Meltzer HY, Jurjus GJ, Konick LC, et al. Gene expression profiling in postmortem prefrontal cortex of major depressive disorder. J Neurosci. 2007;27:13329–13340. doi: 10.1523/JNEUROSCI.4083-07.2007. [DOI] [PMC free article] [PubMed] [Google Scholar]
- 22.Tashiro E, Maruki H, Minato Y, Doki Y, Weinstein IB, Imoto M. Overexpression of cyclin D1 contributes to malignancy by up-regulation of fibroblast growth factor receptor 1 via the pRB/E2F pathway. Cancer Res. 2003;63:424–431. [PubMed] [Google Scholar]
- 23.Mahadev K, Motoshima H, Wu X, Ruddy JM, Arnold RS, Cheng G, Lambeth JD, Goldstein BJ. The NAD(P)H oxidase homolog Nox4 modulates insulin-stimulated generation of H2O2 and plays an integral role in insulin signal transduction. Mol Cell Biol. 2004;24:1844–1854. doi: 10.1128/mcb.24.5.1844-1854.2004. [DOI] [PMC free article] [PubMed] [Google Scholar]
- 24.Trokovic R, Trokovic N, Hernesniemi S, Pirvola U, Vogt Weisenhorn DM, Rossant J, McMahon AP, Wurst W, Partanen J. FGFR1 is independently required in both developing mid- and hindbrain for sustained response to isthmic signals. EMBO J. 2003;22:1811–1823. doi: 10.1093/emboj/cdg169. [DOI] [PMC free article] [PubMed] [Google Scholar]
- 25.Stevens HE, Smith KM, Maragnoli ME, Fagel D, Borok E, Shanabrough M, Horvath TL, Vaccarino FM. Fgfr2 is required for the development of the medial prefrontal cortex and its connections with limbic circuits. J Neurosci. 2010;30:5590–5602. doi: 10.1523/JNEUROSCI.5837-09.2010. [DOI] [PMC free article] [PubMed] [Google Scholar]
- 26.Elchebly M, Payette P, Michaliszyn E, Cromlish W, Collins S, Loy AL, Normandin D, Cheng A, Himms-Hagen J, Chan CC, et al. Increased insulin sensitivity and obesity resistance in mice lacking the protein tyrosine phosphatase-1B gene. Science. 1999;283:1544–1548. doi: 10.1126/science.283.5407.1544. [DOI] [PubMed] [Google Scholar]
- 27.Kuperman Y, Issler O, Regev L, Musseri I, Navon I, Neufeld-Cohen A, Gil S, Chen A. Perifornical Urocortin-3 mediates the link between stress-induced anxiety and energy homeostasis. Proc Natl Acad Sci USA. 2010;107:8393–8398. doi: 10.1073/pnas.1003969107. [DOI] [PMC free article] [PubMed] [Google Scholar]
- 28.Li C, Chen P, Vaughan J, Lee KF, Vale W. Urocortin 3 regulates glucose-stimulated insulin secretion and energy homeostasis. Proc Natl Acad Sci USA. 2007;104:4206–4211. doi: 10.1073/pnas.0611641104. [DOI] [PMC free article] [PubMed] [Google Scholar]
- 29.Kasukawa T, Masumoto KH, Nikaido I, Nagano M, Uno KD, Tsujino K, Hanashima C, Shigeyoshi Y, Ueda H. Quantitative expression profile of distinct functional regions in the adult mouse brain. PLoS One. 2011;6(e23228) doi: 10.1371/journal.pone.0023228. [DOI] [PMC free article] [PubMed] [Google Scholar]
- 30.Sawada K, Young CE, Barr AM, Longworth K, Takahashi S, Arango V, Mann JJ, Dwork AJ, Falkai P, Phillips AG, Honer WG. Altered immunoreactivity of complexin protein in prefrontal cortex in severe mental illness. Mol Psychiatry. 2002;7:484–492. doi: 10.1038/sj.mp.4000978. [DOI] [PubMed] [Google Scholar]
- 31.Chen G, Wang J, Liu Z, Kornmann M. Exon III splicing of fibroblast growth factor receptor 1 is modulated by growth factors and cyclin D1. Pancreas. 2008;37:159–164. doi: 10.1097/MPA.0b013e31816618a4. [DOI] [PubMed] [Google Scholar]
- 32.Fortress AM, Schram SL, Tuscher JJ, Frick KM. Canonical Wnt signaling is necessary for object recognition memory consolidation. J Neurosci. 2013;33:12619–12626. doi: 10.1523/JNEUROSCI.0659-13.2013. [DOI] [PMC free article] [PubMed] [Google Scholar]
- 33.Hui J, Zhang J, Pu M, Zhou X, Dong L, Mao X, Shi G, Zou J, Wu J, Jiang D, Xi G. Modulation of GSK-3β/β-catenin signaling contributes to learning and memory impairment in a rat model of depression. Int J Neuropsychopharmacol. 2018;21:858–870. doi: 10.1093/ijnp/pyy040. [DOI] [PMC free article] [PubMed] [Google Scholar]
- 34.Yu L, Haverty PM, Mariani J, Wang Y, Shen HY, Schwarzschild MA, Weng Z, Chen JF. Genetic and pharmacological inactivation of adenosine A2A receptor reveals an Egr-2-mediated transcriptional regulatory network in the mouse striatum. Physiol Genomics. 2005;23:89–102. doi: 10.1152/physiolgenomics.00068.2005. [DOI] [PubMed] [Google Scholar]
- 35.Krishnadas R, Cavanagh J. Depression: An inflammatory illness? J Neurol Neurosurg Psychiatry. 2012;83:495–502. doi: 10.1136/jnnp-2011-301779. [DOI] [PubMed] [Google Scholar]
- 36.Khairova RA, Machado-Vieira R, Du J, Manji HK. A potential role for pro-inflammatory cytokines in regulating synaptic plasticity in major depressive disorder. Int J Neuropsychopharmacol. 2009;12:561–578. doi: 10.1017/S1461145709009924. [DOI] [PMC free article] [PubMed] [Google Scholar]
- 37.Liu H, Luiten PG, Eisel UL, Dejongste MJ, Schoemaker RG. Depression after myocardial infarction: TNF-α-induced alterations of the blood-brain barrier and its putative therapeutic implications. Neurosci Biobehav Rev. 2013;37:561–572. doi: 10.1016/j.neubiorev.2013.02.004. [DOI] [PubMed] [Google Scholar]
- 38.Yamamoto M, Guo DH, Hernandez CM, Stranahan AM. Endothelial Adora2a activation promotes blood-brain barrier breakdown and cognitive impairment in mice with diet-induced insulin resistance. J Neurosci. 2019;39:4179–4192. doi: 10.1523/JNEUROSCI.2506-18.2019. [DOI] [PMC free article] [PubMed] [Google Scholar]
Associated Data
This section collects any data citations, data availability statements, or supplementary materials included in this article.
Data Availability Statement
The datasets shown and/or analyzed in the present study are available from the corresponding author on reasonable request.