Abstract
In moderately polar and viscous solvents, the emission spectra of fluorophores often shift to longer wavelengths as the excitation wavelength is increased toward the long-wavelength (red) side of the absorption. Red shifts occur because long-wavelength excitation results in photoselection of those fluorophores which are interacting most strongly with the polar solvent molecules. The observation of excitation red shifts requires that these enhanced dipole–dipole interactions are maintained in the photoselected population during the lifetime of the excited state. Consequently, the magnitude of the excitation red shifts depends upon the dynamic properties of the environment surrounding the fluorophore, as well as upon the solvent polarity and the sensitivity of the fluorophore to the polarity of the solvent. We used this phenomenon to investigate the dynamic properties of reference solvents, model membranes, and the protein apomyoglobin labeled with 6-(p-toluidinyl)-2-naphthalenesulfonic acid (TNS). The spectral shifts and lifetime data indicate that red-edge excitation results in the selective excitation of “solvent-relaxed” fluorophores. By comparison of the data obtained for TNS in solvents and bound to the macromolecules, one may estimate the relaxation rate of the environment. This comparison indicates rapid spectral relaxation of TNS bound to lipid vesicles and a somewhat slower relaxation around TNS bound to the heme site of apomyoglobin.
Registry No. TNS, 7724-15-4; DMPC, 18194-24-6; DOPC, 4235-95-4
During the past 10 years, fluorescence spectroscopic methods have been widely utilized to investigate the dynamic properties of proteins and membranes. A variety of fluorescence methods have been employed, such as steady-state, time-resolved, and phase-shift methods. Underlying these diverse approaches has been the use of basically two phenomena. These are the permeability of the macromolecule to quenchers [see Calhoun (1983a,b) and references cited therein; Lakowicz & Weber, 1973a,b] and the rotational diffusion of proteins or membrane-bound fluorescent probes [see Lakowicz (1980, 1983) and references cited therein]. Collisional quenching of fluorescence can reveal the dynamics of biopolymers because contact between the fluorophore and quencher is required for quenching. The quenching of a fluorophore buried in a macromolecule requires diffusion of the quencher through the closely packed macromolecule. Similarly, the rotational motion of a fluorophore located internally in a macromolecule is determined by the structural fluctuations of the residues which surround the fluorophore. The phenomenon of time-dependent spectral relaxation has also been utilized, but to a somewhat more limited extent, to quantify the dynamics of macromolecules (Brand & Gholke, 1971; Easter et al., 1978; Lakowicz & Hogen, 1981).
In this paper, we describe a less widely used and understood fluorescence phenomenon and its application to estimating the dynamic properties of proteins and membranes. This phenomenon is the dependence of the fluorescence emission spectra and lifetimes upon the excitation wavelength. This dependence upon excitation wavelength is maximal at low temperatures in polar viscous solvents. The dependence of the emission Spectrum on the excitation wavelength disappears in nonviscous fluid solvents. By comparative studies using the same fluorophore [6-(p-toluidinyl)-2-naphthalenesulfonic acid (TNS)1] in solvents, and bound to lipid vesicles and a protein, we estimated the relative rigidity of the macromolecules in the region surrounding the fluorophore. The dynamic properties of the macromolecule are inferred from the rate at which the macromolecule responds to (relaxes around) the newly created excited state. This is one of the initial reports using red-edge excitation shifts to estimate the dynamics of macromolecules. However, we emphasize the pioneering report by Demchencko (1982) on this same topic. A novel aspect of our investigation is the use of fluorescence lifetime data (phase shift and demodulation) to identify the nature of the excited state formed upon red-edge excitation.
Theory
Phenomenon of Edge Excitation Red Shifts.
The occurrence of red shifts upon edge excitation (EES) is sufficiently unfamiliar to merit a detailed description. Generally, the emission spectrum of a fluorophore is thought to be independent of the excitation wavelength, and indeed, such independence is frequently and correctly regarded as evidence of its purity and/or homogeneity. For most fluorophores in fluid solvents, the emission spectra are independent of excitation wavelength. Furthermore, for nonpolar fluorophores, the emission spectra are often independent of excitation wavelength irrespective of the solvent viscosity. Even for polar fluorophores in viscous polar solvents, the emission spectra vary only little with excitation wavelength when the excitation is well within the major absorption bands. Consequently, red shifts upon long-wavelength excitation are generally not noticed.
Nonetheless, excitation-dependent shifts can be easily observed for polar fluorophores in polar viscous solvents, and many publications have reported such shifts (Rubinov & Tomin, 1970; Rudik & Pikulik, 1971; Azumi et al., 1976; Klingenberg & Rapp, 1973; Koyava et al., 1970; Macgregor & Weber, 1981). Edge excitation shifts have been observed for phosphorescence spectra as well as for fluorescence spectra (Itoh & Azumi, 1973; Milton et al., 1978). The EES are largest at temperatures low enough to inhibit motion of the solvent molecules during the duration of the excited state.
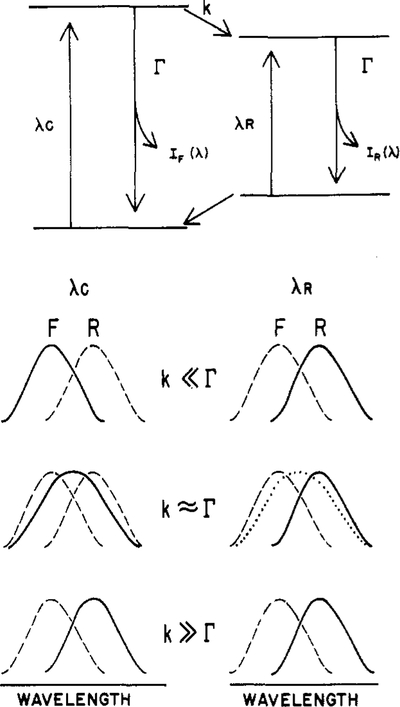
The explanation of the excitation wavelength dependent emission spectra is illustrated schematically in Figure 1. To illustrate the spectral properties of such systems, we use a two-state model. Excitation at a wavelength central to the absorption band (λc) is assumed to yield an initially excited state (F) around which solvent reorientation has not occurred. It is assumed that the F state can decay to a lower energy state (R, red or relaxed) with a rate constant k. The rate of relaxation is determined by the specific and general interactions between the fluorophore and the surrounding solvent molecules and the rate at which these interactions are modified in response to the newly created excited-state dipole moment (Lakowicz, 1983). Of course, solvent relaxation is a more complex process than the two-state process illustrated in Figure 1 (Bakhshiev et al., 1966). Nonetheless, the spectral properties predicted from this simple model are in agreement with the observed data, and this model provides a simple conceptual framework to discuss the effects of red-edge excitation. The emission from the F state [IF(λ)] is centered at shorter wavelengths (λ) relative to that of the R state [IR(λ)]. For simplicity, we assume that the decay rates (Γ) of the F and R states (independent of solvent relaxation) are equal, Γ = τ0−1·τ0. τ0 is the lifetime which would be observed for the F state for k = 0 and for the R state when this state is excited directly (see below). The assumption of equivalent decay rates for each state is equivalent to assuming that solvent relaxation does not alter the emissive rates (γ) or the nonradiative decay rates (ki) of the fluorophore. Of course, the decay rate is given by Γ = γ + Σki.
Figure 1:
Schematic description of the effects of red-edge excitation on emission spectra. The term λc indicates excitation which is central in the last absorption band of the fluorophore. The term λR indicates excitation on the red edge of the absorption band. The solid lines represent the observed spectra, and the dashed lines represent the emission spectra of either the F or the R state. The dotted line represents a possible consequence of reverse relaxation (see the text).
First we will consider the effects of excitation wavelength upon the steady-state emission spectra. Let λc be an excitation wavelength which is centrally located in the long-wavelength absorption band of the fluorophore and λR be a wavelength on the red edge of this absorption band (Figure 1). At low temperature, the rate of fluorescence decay (Γ) is faster than the rate of solvent relaxation (k), k << Γ. Hence, with central excitation, the blue-shifted emission of the F state is observed. However, a different result is obtained for excitation on the red edge of the absorption (λR). The lower energy excitation selects a subclass of the total fluorophore population around which the solvent dipoles are oriented so as to decrease the energy difference between the ground and excited states (top of Figure 1). In particular, the photoselected ground state is higher in energy and the photoselected excited state is at a lower energy level because of alignment of solvent dipoles in the “solvent-relaxed” orientation. Therefore, red-edge excitation selects those molecules which have the solvent-relaxed environment or, equivalently, those molecules which have red-shifted absorption and emission spectra. This prediction is precisely the result found by ourselves and by others (Azumi et al., 1976; Demchenko, 1982). For a variety of fluorophores, the emission spectrum observed upon red-edge excitation resembles that of the high-temperature relaxed state (R).
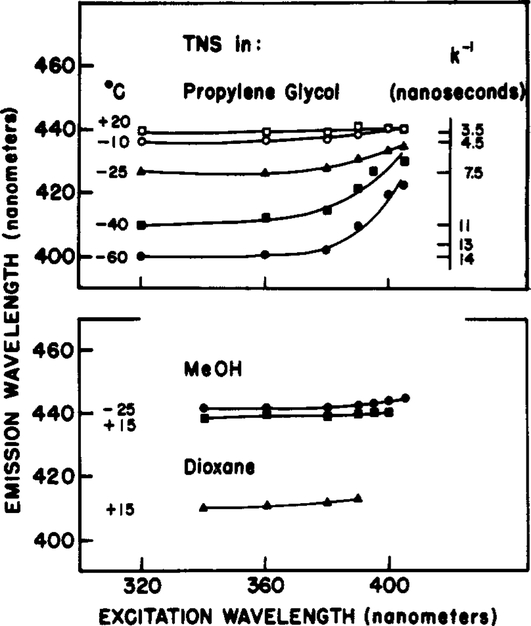
The model described in Figure 1 allows several additional predictions. First, excitation red shifts are only expected for polar fluorophores in polar solvents. Only in such solvents does significant solvent relaxation occur. This prediction is generally found to be correct. Polar fluorophores in nonpolar solvents generally do not display excitation red shifts (see below, Figure 4) nor do fluorophores lacking polar substituents to interact with a polar solvent. A second interesting prediction of this model (Figure 1) is that the excitation red shifts will be dependent upon temperature and/or viscosity, that is, the rate of solvent reorientation around the excited state. This temperature dependence may be understood by realizing that observation of an excitation red shift depends upon observation of the photoselected subclass of solvent-relaxed fluorophores. To observe this subclass, the special orientation of the fluorophore–solvent cluster must be maintained during the duration of the excited state. If the solvent is fluid, these clusters are randomized prior to emission, and the emission spectrum is independent of excitation wavelength.
Figure 4:
Dependence of the emission maximum of TNS on excitation wavelength. (Top) Propylene glycol. The temperatures are −60 (●), −40 (■), −25 (▲), −10 (○), and 20 (□) °C. (Bottom) The solvents are methanol at −25 (●) and 15 °C (■) and dioxane at 15 °C (▲).
It is instructive to consider the temperature dependence in somewhat greater detail. First, consider high temperature where the relaxation rate is much faster than the decay rate (k >> Γ). Then, irrespective of excitation wavelength (λc. or λR), the relaxed emission is observed. For central excitation (λc), the F state relaxes prior to emission, and hence IR(λ) is observed (lowest panel of Figure 1). For excitation at λR, the fluorophore once again reaches equilibrium with its environment prior to emission, and the observed spectrum is again that of the relaxed state [IR(λ)]. For excitation using λR (and k » Γ), the initially excited state is probably similar to the R state. Hence, further equilibration of this initially excited but relaxed state with its environment is not evident. Nonetheless, additional equilibration can occur, and this process can have important consequences for the spectral data.
The effect of intermediate temperature and viscosity (k ≃ Γ) is also illustrated in Figure 1. For excitation with the central wavelength (λc), a spectrum (—) intermediate between IF(λ) and IR(λ) is observed. The F state alone is initially excited, but since emission and relaxation occur at comparable rates, emission from both the F and R states is observed. This combined emission is also more widely distributed on the wavelength scale than that from the individual states (Weber & Farris, 1979; Lakowicz, 1983). Distinct results are expected for red-edge excitation. Upon red-edge excitation (λR), the “relaxed” state is selectively excited, and an emission spectrum similar to IR(λ) is observed (—). One expects this spectrum to be narrower than the one observed by using central excitation (λc) because the emission is due to mostly one state (R), not both states (F and R). Decreases in the half-width of emission spectra have been observed with red-edge excitation (Macgregor & Weber, 1981; Demchenko, 1983).
For the intermediate case (k ≃ Γ), an unusual result is also possible. This is not the observation of a relaxed spectrum upon red-edge excitation but rather the observation of a spectrum (⋯) comparable to the same spectrum (—) found by using the central excitation wavelength. Since red-edge excitation results in excitation of the relaxed state, observation of the intermediate spectrum (⋯) requires that the fluorophore reaches equilibrium with its surroundings. In this instance, the relaxation would be to higher energies rather than to lower energies. Reverse relaxation has been demonstrated by Nemkovich et al. (1979). Using time-resolved methods, these workers showed that a fluorophore could relax to higher energies (shorter wavelengths) under select conditions of solvent and temperature. Similar conclusions were reached by Koyava et al. (1980) using measurements of fluorescence anisotropy. In our experiments, reverse relaxation may be have been present but was not revealed as a dominant feature of the spectral data. We mention this possibility because future experiments are likely to detect this process and its origin with time-dependent equilibration should be understood.
Effects of Edge Excitation Shifts on Apparent Phase and Modulation Fluorescence Lifetimes.
The occurrence of time-dependent solvent relaxation has dramatic effects upon the apparent fluorescence lifetimes, as observed by the phase-shift and the demodulation methods (Lakowicz et al., 1980; Lakowicz & Balter, 1982a,b). To describe the effects of red-edge excitation upon the apparent lifetimes, it is first necessary to understand these same parameters for central excitation. In phase-modulation fluorometry, the sample is excited with light whose intensity is sinusoidally modulated. The circular modulation frequency (ω) is chosen to be comparable to the reciprocal decay time of the sample (τ−1 = Γ). The experimentally observed quantities are the phase delay of the emission relative to the incident light (ϕ) and the extent to which the emission is demodulated (m), again relative to the incident light. These experimental observables are used to calculate the apparent phase (τp) and modulation (τm) lifetimes by using
| (1) |
and
| (2) |
For a single exponential decay, the calculated values of τp and τm are equal to each other, and to the actual lifetime of the sample. For a mixture of fluorophores, or for a sample which displays time-dependent spectral shifts, τp and τm are not equal to each other. Furthermore, these calculated values are only apparent lifetimes, which are the result of complex weighted averaging of the decay times and reaction rates of the emitting species (Lakowicz & Balter, 1982a; Lakowicz, 1983). Caution is needed in the interpretation of these apparent quantities.
In spite of this complexity, the apparent phase and modulation lifetimes are informative with regard to solvent relaxation and ground-state heterogeneity. The main features of these data result from two simple relationships (Lakowicz & Balter, 1982a). The phase angle of the relaxed state, measured relative to the excitation, is the sum of the phase angles of the F state (ϕF) and that of the R state, if the latter could be excited directly (ϕo):
| (3) |
Additionally, the demodulation factor of the R state (mR) is given by the product of demodulation factors of the F state (mF) and that of the directly excited R state (mo):
| (4) |
These relationships result in the characteristic features of the phase and modulation lifetimes in the presence of time-dependent spectral shifts. The apparent phase and modulation lifetimes of the R state, which may be observed by using central excitation and a emission wavelength selected to exclude emission from the F state (long emission wavelengths), are given by
| (5) |
and
| (6) |
In these expressions τo = Γ−1 and τF = (Γ + k)−1. Equations 5 and 6 predict that both τRp and τRm increase with modulation frequency and that τRp > τRm (Figure 2, middle panel). This latter inequality is characteristic of the emission from the product of an excited-state reaction and is not possible for a mixture of directly excited fluorophores. This property of an excited-state process is also revealed by the ratio of the directly measured values ϕ and m. For the R state, the ratio
| (7) |
exceeds unity if spectral relaxation and the decay of fluorescence occur at comparable rates.
Figure 2:
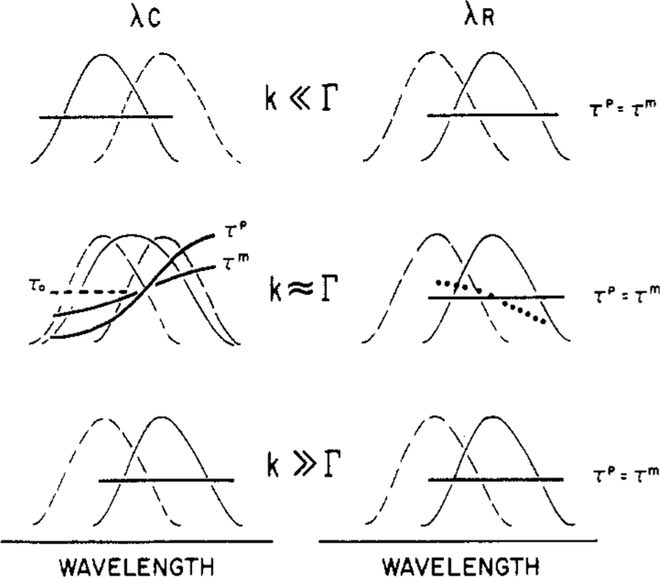
Schematic description of the effects of red-edge excitation on phase and modulation lifetimes. The term λc indicates excitation which is central in the last absorption band of the fluorophore. The term λR indicates excitation on the red edge of the absorption band. The solid lines represent the observed emission spectra, and the dashed lines represent the emission spectra from the alternative F or R state. The bold solid lines represent the expected wavelength-dependent phase (τp) and modulation (τm) lifetimes. The dotted line indicates a possible result in the presence of red-edge excitation and reverse relaxation.
In the above paragraphs, we considered the phase and modulation lifetimes expected for the relaxed state, observed on the long-wavelength side of the emission spectrum. It is also important to understand the effect of excitation wavelength on these values (Figure 2). First consider the case in which solvent relaxation and emission occur at comparable rates (k ≈ Γ). At short wavelengths, the emission is predominately from the F state (Figure 2). At shorter emission wavelengths, the lifetime is shorter than τo (Γ−1, ---) because spectral relaxation is an additional rate process depopulating the excited state. The expected lifetime in the presence of solvent relaxation is τf = (Γ + k)−1. For the specific case of solvent relaxation, the F- and R-state emissions often overlap at all usable wavelengths, resulting in heterogeneous emission (τFp < τFm) on the short-wavelength side of the emission. In the central region of the emission spectrum, there is also overlap of the emission from both states and hence the appearance of a heterogeneous emission. The apparent phase and modulation lifetimes both increase with emission wavelength. As the observation wavelength is increased toward the red side of the emission spectrum, the intensity of the R state becomes dominant and τp exceeds τm. Of course, if k << Γ, then relaxation does not occur, and the lifetimes are independent of emission wavelength (top of Figure 2). Also, since the emission is due to only the F state, the decay is expected to be nearly exponential, and τp ≈ τm. Similar results are expected for k >> Γ. However, since relaxation occurs prior to emission, the emission is from the R state.
Now consider the effect of red-edge excitation on the apparent lifetimes. At high temperatures (k >> Γ), the R state is the dominant emitting species, irrespective of the excitation wavelength. As a result, the lifetimes are also independent of excitation wavelength (Figure 2). The same independence from wavelength is expected at low temperature (k << Γ) but for a different reason. Upon red-edge excitation (λR), emission from the relaxed state dominates emission. However, since there are no time-dependent spectral shifts at either excitation wavelength, the apparent lifetimes are expected to be independent of the emission wavelength. Recall that we assumed that the average solvent orientation around the fluorophore does not alter the decay rate (Γ) of the fluorophore.
Contrasting and interesting results are expected at intermediate temperatures where relaxation and decay occur at comparable rates (k ≃ Γ). Recall that for central excitation solvent relaxation results in apparent phase and modulation lifetimes which are strongly dependent upon emission wavelength. Since red-edge excitation selects for the relaxed fluorophores, then time-dependent spectral shifts are not expected, and the lifetimes will be independent of emission wavelength (Figure 2). Therefore, the apparent lifetimes observed with red-edge excitation, when compared to those measured by using central excitation, should reveal the nature of the molecules selectively excited with red-edge excitation. If the photoselected population of fluorophores is comparable to the relaxed fluorophore population, then the apparent lifetimes will no longer be dependent upon emission wavelength.
For completeness, we note that the dependence of τp and τm upon emission wavelength cannot only be eliminated upon red-edge excitation but in fact may be reversed. Specifically, if the F state forms subsequent to red-edge excitation (Figure 1, k ≃ Γ, ⋯), then the lifetimes may be longer on the blue side of the emission. In fact, reverse relaxation has been observed in solvents (Nemkovich et al., 1979) but not yet for biological macromolecules.
Materials and Methods
Fluorescence emission spectra were recorded by using a band-pass of 4 nm for excitation and 8 nm for emission. In all cases, control samples without TNS were used to determine whether background fluorescence and/or stray light contributed to the observed spectra. This is especially important for red-edge excitation because the amount of absorption is low, as are the fluorescence intensities. All spectra were corrected by subtraction of spectra from control samples which did not contain TNS. Typically, the blank samples displayed about 7% of the total fluorescence at the longest excitation wavelengths. In no case did this percentage exceed 15%.
Fluorescence phase-shift and modulation lifetimes were measured as described previously (Spencer & Weber, 1969) with a modulation frequency of 30 MHz. Phase and modulation data were measured relative to the reference fluorophore 1,4-bis[2-(5-phenyloxazolyl)]benzene by using a reference lifetime of 1.35 ns (Lakowicz et al., 1981). Once again, control samples without TNS were examined, and in no case did the blank signal exceed 13% in lipids and 3% in propylene glycol.
Spectral relaxation rates (k) at various temperatures were estimated by using phase-sensitive detection of fluorescence (Lakowicz & Balter, 1982c; Lakowicz, 1983). The rate constants were obtained from
| (8) |
In this expression, Γ = τo−1 is the lifetime measured when the entire emission is observed through a band-pass filter (Corning 4–96). mF and mR are the modulation values measured on the blue (400 nm) and red (500 nm) sides of the emission, respectively. IF and IR are the phase-sensitive fluorescence intensities for the apparent unrelaxed and relaxed states, respectively. These intensities are measured upon suppression of the red (500 nm) or blue (400 nm) side of the emission, respectively. All relaxation rates were measured by using an excitation wavelength of 360 nm and an excitation filter (Corning 0–51).
Apomyoglobin was prepared as described previously (Lakowicz & Cherek, 1981). The TNS to Apo ratio was near 1.0, as estimated from the extinction coefficients for apomyoglobin of 1.58 × 10⁴ M−1 cm−1 at 280 nm (Stryer, 1965) and that for TNS of 4.08 × 10³ M−1 cm−1 at 366 nm (McClure & Edelman, 1966). For our experiments, the total TNS concentration was (4.5–5.0) × 10−5 M.
TNS-labeled lipid vesicles of DOPC and DMPC were prepared as described previously (Lakowicz & Hogen, 1981), except that the lipid concentration was 5 mg/mL and the probe to lipid molar ratio was 1:100. The total TNS concentration in our samples was (4–5) × 10−5 M.
Results
Model Studies of TNS in Viscous and Nonviscous Solvents.
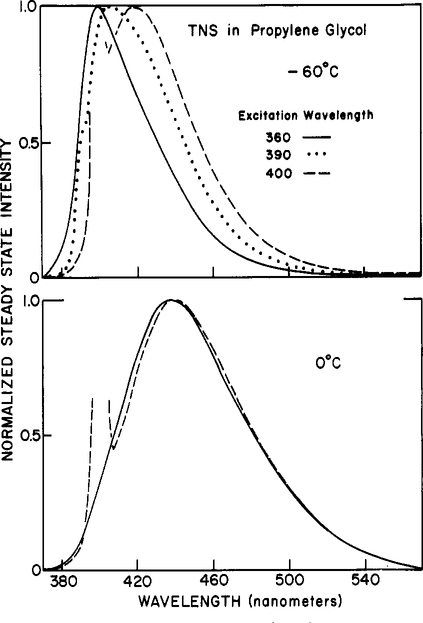
Our objective is to examine the potential usefulness of the excitation wavelength dependent emission spectra and lifetimes to determine the dynamic properties of proteins and membranes. For this analysis, we chose two systems which were characterized in earlier investigations. These are TNS-labeled lipid vesicles (Lakowicz & Hogen, 1981; Easter et al., 1978) and TNS-labeled apomyoglobin (Lakowicz & Cherek, 1981; Gafni et al., 1977). However, since we had little data on the effects of red-edge excitation of TNS, we first investigated the temperature-dependent spectral properties of TNS in propylene glycol. By temperature variation, the viscosity of propylene glycol, and hence spectral relaxation rates, can be varied over a wide range (Lakowicz et al., 1983). At low temperature (≤−60 °C), little relaxation occurs during the excited-state lifetime of TNS, resulting in a blue-shifted emission spectrum (Figure 3). At high temperature (≥0 °C), spectral relaxation is essentially complete prior to emission, and the emission maximum occurs at longer wavelengths. At intermediate temperatures near −20 °C, fluorescence decay and solvent relaxation occur at comparable rates, and an intermediate spectrum is observed (Lakowicz et al., 1983).
Figure 3:
Fluorescence emission spectra of TNS in propylene glycol. Emission spectra are shown for excitation wavelengths of 360 (—), 390 (⋯), and 400 (---) nm. Top, −60 °C; bottom, 0 °C.
Emission spectra of TNS observed at various excitation wavelengths are shown in Figure 3. At −60 °C, the emission spectra shift substantially, from 400 to 423 nm, as the excitation wavelength is increased from 320 to 405 nm. These spectral shifts are not due to the excitation of impurities in the solvent, as was demonstrated by careful examination of the solvent in the absence of TNS. Also, it is unlikely that these spectral shifts are due to excitation of impurities in the TNS since, as we shall see below, these shifts are strongly temperature dependent.
At higher temperatures (0 °C and higher), the emission spectra of TNS in propylene glycol are significantly less dependent upon the excitation wavelength (Figure 3). This is expected since higher temperatures also result in increased emission from the relaxed state, which is also the state formed upon red-edge excitation. The temperature dependence of the excitation red shifts for TNS in propylene glycol is summarized in Figure 4. Clearly, these shifts are maximal at the lowest temperature. At low temperature, the F-state emission is dominant for central excitation. For red-edge excitation, the selectively excited fluorophore–solvent clusters persist throughout the excited-state lifetime, and a red-shifted emission is observed. Although not shown, similar temperature-dependent red shifts were observed for TNS in glycerol. To approximately show the quantitative relationship between excitation red shifts and solvent dynamics, we included on Figure 4 the spectral relaxation times estimated by the technique of phase-sensitive detection of fluorescence (see Materials and Methods). When k−l is small in comparison with the lifetime of approximately 10 ns, the dependence on excitation wavelengths is minimal. When k−l is comparable to or larger than the lifetime, then the emission spectra are strongly dependent upon the excitation wavelength.
We also examined the half-widths of the TNS emission of TNS in propylene glycol (data not shown). At intermediate temperatures (−40 and −25 °C), these half-widths decreased upon red-edge excitation. This decrease occurs because, on central excitation at intermediate temperatures, the emission results from both the F and R states. On red-edge excitation, the emission is dominantly from a single state, the photoselected R state, and hence narrower. Furthermore, at low temperatures where k << Γ (−50 and −60 °C), the half-width of the emission increases on red-edge excitation to values comparable to those observed at intermediate temperatures. The increase in half-width is a result of the increased photoselection of R over F as the excitation wavelength is increased.
As control experiments, we examined TNS in dioxane at 15 °C and in methanol at −25 and 15 °C. Methanol is very fluid at both temperatures. Hence, the fluorophore is expected to reach equilibrium with the solvent prior to emission, and no dependence on excitation wavelength is expected. This is precisely the result we observed (Figure 4). Dioxane is also fluid, but it is also nonpolar. In this solvent, there are no TNS molecules present in a solvent-relaxed environment, and once again the emission spectra are independent of excitation wavelength.
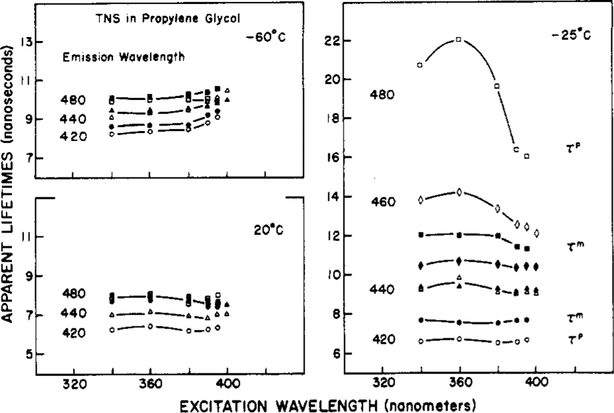
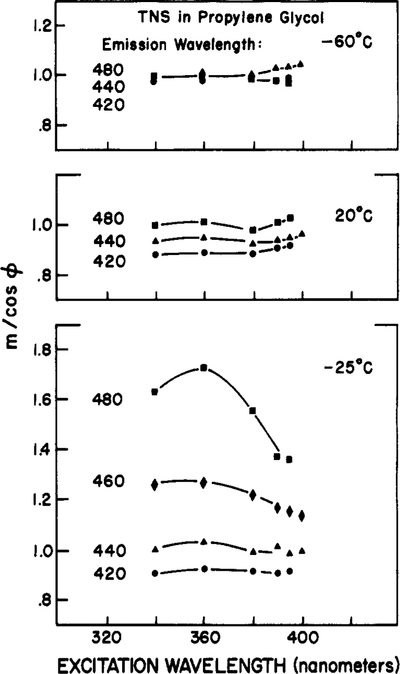
To further clarify the phenomenon of red shifts upon red-edge excitation, we measured the dependence of the apparent phase and modulation lifetimes upon both the excitation and the emission wavelengths. Representative data for TNS in propylene glycol are shown in Figure 5. First consider the data obtained by using the central excitation wavelengths of 340 and 360 nm. At −25 °C, the values of both τp and τm increase across the emission spectrum. On the red side of the emission (480 nm), we observed τp > τm, which is characteristic of the emission from a relaxed state. These data are presented as the values of m/cos ϕ in Figure 6. With an excitation wavelength of 340 nm, the values of m/cos ϕ increase from 0.9 to 1.6 as the observation wavelength is increased from 420 to 480 nm.
Figure 5:
Apparent phase and modulation lifetimes of TNS in propylene glycol. Closed symbols are τm and open symbols are τp at emission wavelengths of 420 (●, O), 440 (▲, Δ), 460 (♦, ♢), and 480 nm (■, □).
Figure 6:
Effect of excitation wavelength on the values of m/cos ϕ for TNS in propylene glycol. The emission wavelengths are 420 (●), 440 (▲), 460 (♦), and 480 nm (■).
As the excitation wavelength is increased, the lifetime data no longer reflect the characteristic features of an excited-state process. This is most evident at −25 °C. The apparent lifetimes on the red side of the emission decrease as the excitation wavelength is increased. The long apparent lifetimes for excitation at 340 nm observed by using central excitation are a result of solvent relaxation and a result of the additivity of the individual phase angles. The decrease in τp and τm upon red-edge excitation is a result of observing the directly excited R-state fluorophores. Hence, the apparent lifetimes converge toward a constant value characteristic of the decay rate of TNS in this solvent. It is also important to notice that the relationships τp > τm (Figure 5) and m/cos ϕ > 1 (Figure 6) become less dramatic as the excitation wavelength is increased. Of course, this is a result of the decreased contribution of solvent relaxation as the source of relaxed TNS molecules, relative to those directly excited by the red-edge illumination.
The dependence of the apparent lifetimes upon the excitation wavelength is only apparent in the intermediate temperature range where k ≃ Γ. At lower or higher temperatures (−60 and 20 °C), both τp and τm are essentially independent of excitation wavelength. The biphasic dependence of τp and τm upon temperature is to be contrasted with the monotonie dependence seen for the shifts in the emission spectra. These distinct dependencies upon temperature can be useful in determining the dynamic properties of an unknown environment.
TNS-Labeled Lipid Vesicles and TNS-Labeled Apomyoglobin.
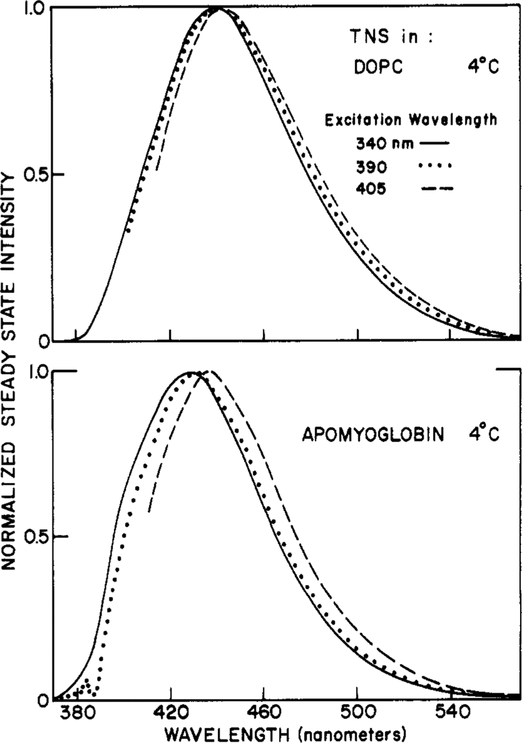
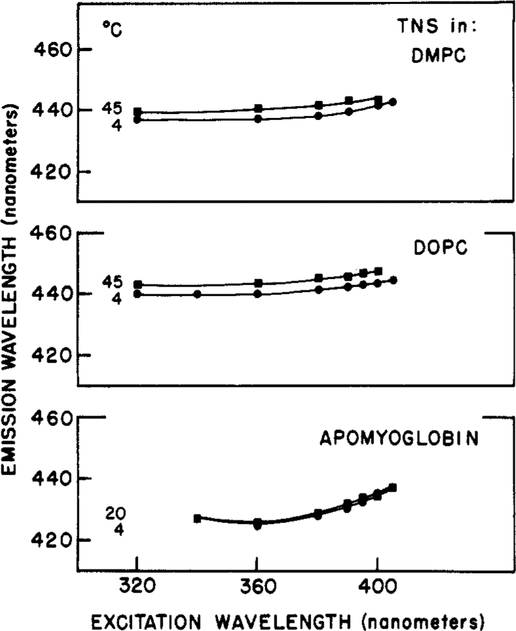
We also examined the effects of long-wavelength excitation on the emission spectra of TNS bound to lipid vesicles and for TNS-labeled apomyoglobin (TNS-Apo). Larger red shifts were found for TNS-Apo than for the labeled vesicles (Figure 7). As summarized in Figure 8, the emission maxima of the vesicles were rather independent of excitation wavelength, temperature, and composition of the fatty acid side chains. The excitation red shifts were small for both DOPC and DMPC vesicles, at both 5 and 45 °C (4 and 5.5 nm, respectively). A somewhat greater red shift (11.5 nm) was observed for TNS-Apo (Figures 7 and 8), possibly indicating a slower rate of spectral relaxation for the protein-bound fluorophores.
Figure 7:
Emission spectra of TNS-labeled DOPC vesicles (top) and apomyoglobin (bottom) with various excitation wavelengths. Emission spectra are shown for excitation wavelengths of 340 (—), 390 (⋯), and 405 (---) nm.
Figure 8:
Excitation red shifts for TNS-labeled lipid vesicles and apomyoglobin. The temperatures for the lipids are 4 (●) and 45 °C (■); for apomyoglobin, 4 (●) and 20 °C (■).
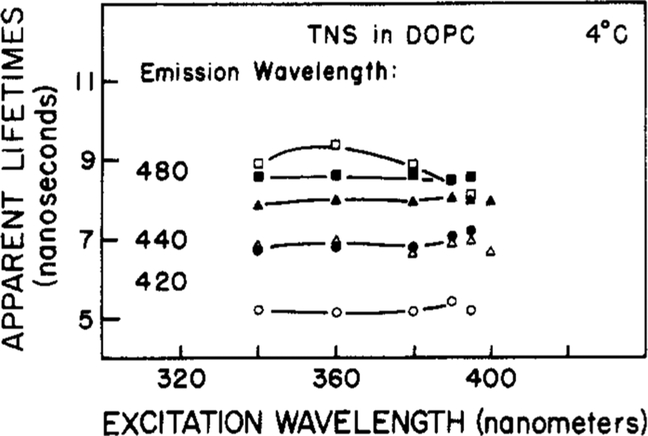
We also examined the dependence of the apparent phase and modulation lifetimes of TNS-labeled lipids upon excitation wavelength (Figure 9). The apparent lifetimes increase with emission wavelength but are rather independent of the excitation wavelength. These results are less dramatic than those observed for TNS in propylene glycol at −25 °C (Figure 5). Since the emission maxima are only slightly dependent upon the excitation wavelength (Figure 8), these two results imply rapid spectral relaxation of TNS-labeled vesicles.
Figure 9:
Apparent phase and modulation lifetimes of TNS-labeled lipids at various excitation wavelengths. Details as in Figure 6.
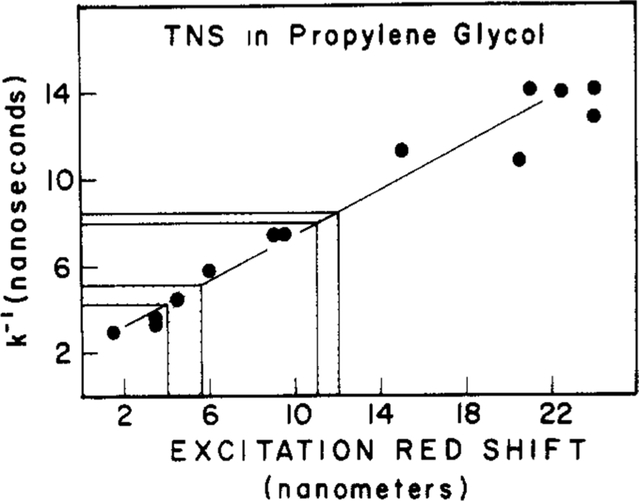
The spectral properties summarized in Figures 7–9 are consistent with rapid spectral relaxation around TNS bound to the model membranes and a somewhat slower relaxation for TNS-labeled apomyoglobin. In fact, one may crudely estimate the spectral relaxation times by comparison of the magnitude of the excitation red shifts found for the labeled macromolecule (Figure 8) with those observed for TNS in propylene glycol (Figure 4). Of course, in such a comparison one assumes that the propylene glycol solvent is a good model for spectral relaxation of the probe–macromolecule complex, and this assumption can certainly be questioned. We attempted a quantitative interpretation of the excitation red shifts by examining the correlation between these shifts to the rates of spectral relaxation. These rates (Figure 4) were estimated from the phase and modulation data, as described under Materials and Methods. The excitation red shifts at each temperature were taken as the difference between the emission maxima using excitation wavelengths of 405 and 340 nm. A plot of the spectral relaxation time (k−l) vs. the excitation red shift is shown in Figure 10. From this comparison, we estimate spectral relaxation times near 5 ns in the membranes and near 8 ns for TNS bound to apomyoglobin. The range of excitation red shifts for the labeled lipids includes the values found for TNS-labeled vesicles of DOPC and DMPC, each at 4 and 45 °C. As expected, the shorter relaxation times were found at higher temperatures. These individual values were not shown explicitly because the values are closely spaced, and we are not certain that such closely spaced relaxation times can be resolved on the basis of the excitation red shifts.
Figure 10:
Correlation between the excitation red shift and the rate of spectral relaxation. Spectral relaxation times were measured by using the phase-sensitive fluorescence intensities, as described previously (Lakowicz & Balter, 1982c; Lakowicz et al., 1983). The excitation red shifts at a given temperature are the difference in the emission maxima for excitation wavelengths of 405 and 340 nm.
Discussion
It is of interest to compare the spectral relaxation times estimated by using red-edge excitation with those found by using other more direct methods. Nanosecond spectral relaxation of TNS-labeled lipid bilayers was studied extensively by Brand and co-workers using time-resolved emission spectra (Easter et al., 1976, 1978). Spectral relaxation times for TNS-labeled lipids were also estimated from lifetime-resolved emission spectra (Lakowicz & Hogen, 1981), in which lifetimes were varied by oxygen quenching. There is general agreement that the spectral relaxation times of TNS-labeled bilayers range from 2 to 8 ns, with the smaller values being found at the higher temperatures. Also, the relaxation times were found to be rather independent of the phase state of the bilayers and the composition of the fatty acid side chains. These are the same conclusions and relaxation times obtained from the red-edge excitation shifts for the labeled membranes.
The spectral relaxation time of TNS-labeled apomyoglobin was also determined previously. Brand and co-workers estimated the relaxation time by using time-resolved emission spectra (Gafni et al., 1976). Our estimate was obtained from the wavelength-dependent phase-shift and demodulation data (Lakowicz & Cherek, 1981). The results indicate a spectral relaxation time near 20 ns, with an initial more rapid spectral decay. This result is in reasonable agreement with the estimate obtained from the red-edge excitation shift, which is 8.0 ns. Apparently, spectral relaxation of TNS-labeled apomyoglobin is highly nonexponential (J. R. Lakowicz et al., unpublished results; Gafni et al., 1976). The red-edge excitation shifts seem to be sensitive to the initial rapid spectral decay, whereas the time-resolved measurements reveal most readily the slower portion of the spectral decay. Hence, for both labeled membranes and proteins, the spectral shifts upon red-edge excitation provided reasonable estimates of the spectral relaxation times. Precise agreement is not expected because of the widely differing phenomena used in these diverse techniques.
Given the possibility of measuring spectral relaxation rates by other means, what is the advantage of using the dependence of the emission spectra upon the excitation wavelength? One obvious advantage is the fact that such measurements can be performed with a steady-state spectrofluorometer. These measurements are available independently of access to time-resolved, lifetime-resolved, or phase-modulation instrumentation. Furthermore, since only steady-state measurements are required, the lifetime of the excited state determines the time resolution of the experiment. Hence, one may potentially estimate relaxation rates which are fast relative to the time resolution of the various methods described above. This dependence upon the duration of the excited state is nicely illustrated by the work of Milton et al. (1978). Using the red shifts of phosphorescence, and the marked dependence of phosphorescence lifetimes upon temperature, these workers estimated solvent relaxation times ranging from nanoseconds to seconds. Red-edge excitation shifts may be particularly useful for analysis of the faster relaxation states, shorter than 1 ns, where the time-resolved methods are less accurate. For instance, the rate of spectral relaxation around excited tryptophan residues in proteins is uncertain (Lakowicz & Balter, 1982c), and red-edge excitation may be useful for estimation of these rates.
These advantages are partially offset by the more ambiguous nature of the excitation red shifts. For instance, if the fluorophore is bound in a completely nonpolar region of a macromolecule, then excitation red shifts are not expected to be significant. Hence, one must use additional information, such as the position of the emission maximum, to determine that the fluorophore is at least partially in a polar environment. Additionally, one must be careful to exclude spectral shifts due to the selective excitation of a subclass of fluorophores due to binding site heterogeneity. Such heterogeneity, in addition to the natural heterogeneity due to the dipolar fluorophore–environment interactions, would greatly complicate interpretation of the excitation red shifts. In conclusion, the spectral shifts upon red-edge excitation can provide additional information concerning the dynamic properties of proteins and membranes on the nanosecond time scale. However, caution is required in the interpretation of such data because excitation red shifts can also be due to binding site heterogeneity, or such shifts can be absent due to a nonpolar environment surrounding the fluorophore.
Acknowledgments
This work was performed during the tenure of an Established Investigatorship (to J.R.L.) of the American Heart Association. These studies were supported by Grants PCM 80-41320 and PCM 81-06910 from the National Science Foundation.
Footnotes
Abbreviations: TNS, 6-(p-toluidinyl)-2-naphthalenesulfonic acid; Apo, apomyoglobin; TNS-Apo, TNS-labeled apomyoglobin; DMPC and DOPC, dimyristoyl- and dioleoyl-L-α-phosphatidylcholine, respectively; red shift or blue shift, shift of a spectrum to longer or shorter wavelengths, respectively; EES, edge excitation shifts.
References
- Azumi T, Itoh KI, & Shiraiski H (1976) J. Chem. Phys 65, 2550–2555. [Google Scholar]
- Bakhshiev NG, Mazurenko Yu. T., & Piterskaya IV (1966) Opt. Spectrosc. (Engl. Transi.) 21, 307–309. [Google Scholar]
- Brand L, & Gohlke JR (1971) J. Biol. Chem 246, 2317–2319. [PubMed] [Google Scholar]
- Calhoun DB, Vanderkooi JM, Woodrow GV, & Englander SW (1983a) Biochemistry 22, 1526–1532. [DOI] [PubMed] [Google Scholar]
- Calhoun DB, Vanderkooi JM, & Englander SW (1983b) Biochemistry 22, 1533–1539. [DOI] [PubMed] [Google Scholar]
- Demchenko AP (1982) Biophys. Chem 15, 101–109. [DOI] [PubMed] [Google Scholar]
- Easter JH, DeToma RP, & Brand L (1976) Biophys. J 16, 571–583. [DOI] [PMC free article] [PubMed] [Google Scholar]
- Easter JH, DeToma RP, & Brand L (1978) Biochim. Biophys. Acta 508, 27–38. [DOI] [PubMed] [Google Scholar]
- Gafni A, DeToma RP, Manrow RE, & Brand L (1977) Biophys. J 17, 155–168. [DOI] [PMC free article] [PubMed] [Google Scholar]
- Itoh K, & Azumi T (1973) Chem. Phys. Lett 22, 395–399. [Google Scholar]
- Klingenberg HH, & Rapp W (1973) Z. Phys. Chem. (Wiesbaden) 84, 92–99. [Google Scholar]
- Koyava VT, Popechits VI, & Sarzhevskie AM (1980) Opt. Spektrosk 48, 493–497. [Google Scholar]
- Lakowicz JR (1980) Biochem. Biophys. Methods 2, 91–119. [DOI] [PubMed] [Google Scholar]
- Lakowicz JR (1983) Principles of Fluorescence Spectroscopy, Plenum Press, New York. [Google Scholar]
- Lakowicz JR, & Weber G (1973a) Biochemistry 12, 4161–4170. [DOI] [PMC free article] [PubMed] [Google Scholar]
- Lakowicz JR, & Weber G (1973b) Biochemistry 12, 4171–4179. [DOI] [PMC free article] [PubMed] [Google Scholar]
- Lakowicz JR, & Cherek H (1981) Biochem. Biophys. Res. Commun 99, 1173–1178. [DOI] [PubMed] [Google Scholar]
- Lakowicz JR, & Hogen D (1981) Biochemistry 20, 1366–1373. [DOI] [PMC free article] [PubMed] [Google Scholar]
- Lakowicz JR, & Balter A (1982a) Biophys. Chem 16, 99–115. [DOI] [PMC free article] [PubMed] [Google Scholar]
- Lakowicz JR, & Balter A (1982b) Biophys. Chem 16, 117–132. [DOI] [PMC free article] [PubMed] [Google Scholar]
- Lakowicz JR, & Balter A (1982c) Photochem. Photobiol 36, 125–132. [DOI] [PubMed] [Google Scholar]
- Lakowicz JR, Bevan DR, & Cherek HC (1980) J. Biol. Chem 255, 4403–4406. [PubMed] [Google Scholar]
- Lakowicz JR, Cherek H, & Balter A (1981) J. Biochem. Biophys. Methods 5, 131–146. [DOI] [PubMed] [Google Scholar]
- Lakowicz JR, Thompson RB, & Cherek H (1983) Biochim. Biophys. Acta 734, 295–308. [Google Scholar]
- Macgregor RB, & Weber G (1981) Ann. N.Y. Acad. Sei 366, 140–154. [Google Scholar]
- McClure WO, & Edelman GM (1966) Biochemistry 5, 1908–1919. [DOI] [PubMed] [Google Scholar]
- Milton JG, Purkey RM, & Galley WC (1978) J. Chem. Phys 68, 5396–5404. [Google Scholar]
- Nemkovich NA, Matseiko VI, Rubinov AN, & Tomin VI (1979) JETP Lett. (Engl. Transi.) 29, 717–720. [Google Scholar]
- Rubinov AN, & Tomin VI (1970) Opt. Spectrosc. (Engl. Transi.) 29, 578–580. [Google Scholar]
- Rudik KI, & Pikulik LG (1971) Opt. Spectrosc. (Engl. Transi.) 30, 147–148. [Google Scholar]
- Spencer RD, & Weber G (1969) Ann. N.Y. Acad. Sei 158, 361–376. [Google Scholar]
- Stryer L (1965) J. Mol. Biol 13, 482–489. [DOI] [PubMed] [Google Scholar]
- Weber G, & Farris FJ (1979) Biochemistry 18, 3075–3078. [DOI] [PubMed] [Google Scholar]


