Abstract
We synthesized phospholipid analogues of phosphatidyl ethanolamine which contains a ruthenium metal-ligand complex (MLC) covalently bound to the amino group. Two analogues were synthesized, containing either one (Ru-PE) or two (Ru-PE2) lipid molecules covalently linked to the MLC by the amino group of the lipid. These MLC-lipid probes display intensity decay times from 682 to 357 ns, depending on temperature. Importantly, the luminescence MLC groups display polarized emission, enabling their use for studies of membrane dynamics. The long intensity decay times allowed measurement of the overall rotation correlation time of lipid vesicles to several microseconds. The spectral properties of the model membranes containing Ru-PE or Ru-PE2 were independent of the probe-to-lipid molar ratio from 1:20 to 1:100, suggesting minimal tendency for probe-probe interactions. These MLC-lipid probes can be expected to have numerous applications in studies of membrane dynamics on the microsecond timescale.
Fluorescence spectroscopy has been widely utilized to study the structure and dynamics of cell membranes (1–3). Many of these studies have their origin with the pioneering report of Shinitzky and Weber (4) and subsequent reports (5, 6) which showed that the fluorescence anisotropy could be used to estimate the microviscosity of the acyl side chain region of membranes. Subsequently, the membrane probe 1,6-diphenyl-3,4,5-hexatriene (DPH)2 was introduced as displaying a large change in anisotropy at the phase transition temperature of membranes (7). The extension of the anisotropy measurements to include time-resolved anisotropies resulted in increased understanding of the order and dynamics of cell and model membranes (8–13).
To date, the majority of lipid probes display lifetimes from 1 to 10 ns. The few exceptions include pyrene (14), which is not particularly useful as anisotropy probe, and coronene, which displays a lifetime near 200 ns and complex anisotropy decays in membranes (15, 16). However, the need for additional long-lifetime membrane probes is obvious from the absence of measurements of the overall hydrodynamics of phospholipid vesicles and macromolecules complexes. Also, when combined with measurement of fluorescence resonance energy transfer (FRET), one can expect long-lifetime membrane probes to be useful for measurements of lipid diffusion across the surfaces of lipid bilayers.
In the present report we describe the first of a class of lipid probes which contain a luminescent metal–ligand complex. In previous reports we have shown that such complexes display decay times from 300 ns to 2.3 μs in aqueous solution and when bound to proteins (17–19). These complexes are molecules of the Ru tris(2,2′-bipyridyl) class [] where the metal can be Ru, Os, or Rh, and the ligand can be a variety of diimine molecules. Importantly, when substituted with appropriate ligands the MLCs display polarized emission, the extent of which is dependent on the rate of rotational motion (17). Consequently, these complexes can be used to study protein hydrodynamics on the micro second timescale.
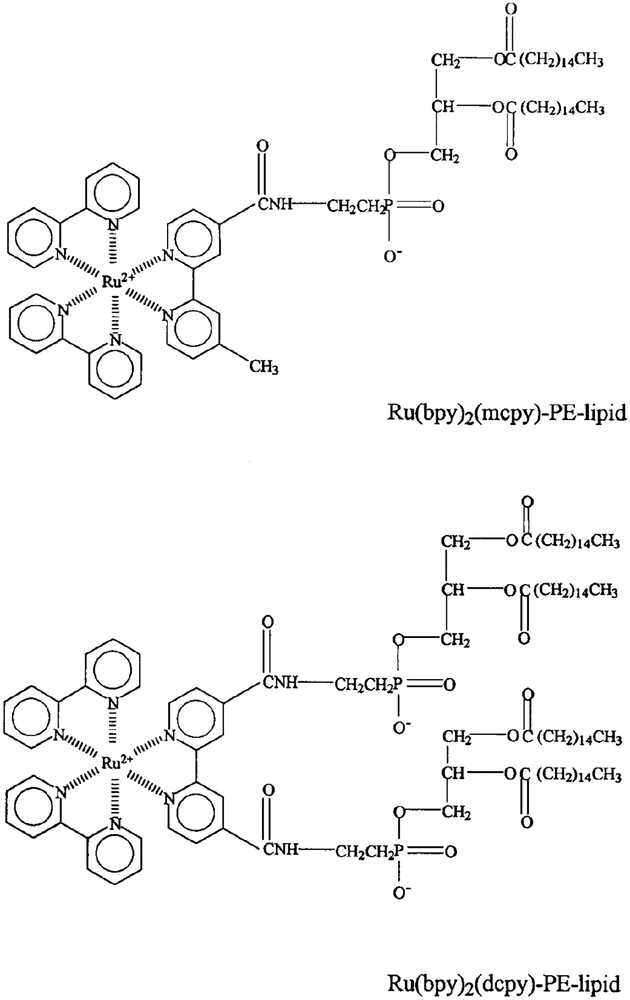
To extend the application of these complexes to membranes, we synthesized two derivatives of phosphatidylethanolamine containing a covalently bound MLC. The first lipid probe contains the mono-carboxy derivative Ru(bpy)2(mcbpy) which is linked to a single molecule of phosphatidylethanolamine (PE) (Scheme I). The spectral properties of the initial probe were described briefly in a preliminary communication (20). In the second lipid probe the dicarboxy MLC Ru(bpy)2(dcbpy) is coupled to two PE molecules. We reasoned that the first lipid probe was the simplest structure containing a covalently bound MLC, but that a single covalent bond may allow free rotation of the MLC on the membrane surface. In the second probe, the MLC is linked to two lipid molecules which may prevent free rotation of the MLC and thus improved resolution of longer rotational correlation times.
SCHEME I.
Structures of the two MLC–lipid probes: Ru(bpy)2(mcbpy)-PE (Ru–PE) and Ru(bpy)2(dcpby)-PE2(Ru–PE2).
MATERIALS AND METHODS
Synthesis of Ru-PE and Ru-PE2
Ru(bpy)2(mcbpy) (360 mg) [described previously (18)] and 51 mg of N-hydroxysuccinimide (NHS) were dissolved in 1.2 ml of acetonitrile at room temperature. N,N′-Dicyclohexylcarbodiimide (DCC, 120 mg) was then added. The mixture was sealed and stirred for a few hours. The formed precipitate was removed by filtration through a syringe filter (Nylon Acrodish, 0.45-μm pore size). The filtrate was added to a stirring solution of 2-propanol. The mixture was kept at −4°C for 1 h. The precipitate, Ru(bpy)2(mcbpy)-NHS, was collected by filtration and washed with dry ether (3 × 5.5 ml) with an approximate 70% yield. The same procedure was used for the preparation of NHS-ester of Ru(bpy)2(dcbpy). Ru(bpy)2(mcbpy)-NHS (120 mg) was dissolved in 4.5 ml of dry DMF and slowly added to a stirring solution of PE (80 mg in 10 ml of CHCl3) and triethylamine (6.0 ml) under an argon atmosphere. The mixture was stirred for 20 h in the dark. The solvents were removed under vacuum and the product was re-dissolved in 2.5 ml of CHCl3/MeOH (2/1, v/v). The pure Ru–PE was obtained by TLC on K6F silica gel plates using CHCl3/MeOH/H2O (65/25/4, v/v/v) as the developing solvent with a 15% yield. The Rf value of the product is near 0.6, relative to that of PE (0.78). Ru–PE2 was prepared in analogy to Ru–PE. The same developing solvent, CHCl3/MeOH/H2O (65/25/4), was used to purify Ru–PE2, whose Rf value is near 0.70. The purification by TLC was repeated twice to obtain pure Ru–PE2, with a final yield of about 2.3%.
Instrumentation
Emission spectra were recorded on a SLM AB2 spectrofluorometer. The frequency-domain instrumentation (ISS) was used for measurements of the fluorescence intensity and anisotropy decays. The excitation source was a CW air-cooled argon ion laser (543-AP, Omnichrome). The laser was amplitude modulated by the electrooptical low-frequency modulator (K2.LF from ISS) and was tuned at 488 nm as the excitation wavelength. In those measurements a 610-nm cutoff filter (Corning 2–61) was also used to isolate the emission of Ru complexes.
The frequency-domain intensity and anisotropy data were fit to single and double-exponential decay laws. The intensity decays were described by
| (1) |
where αi are the amplitudes of the intensity decay times τi, with Σαi = 1.0. The anisotropy decays were fit to
| (2) |
where gir0 is the amplitude of the anisotropy decaying with the correlation time θi, and r0 is the anisotropy in the absence of rotational diffusion. The amplitudes of the anisotropy decay components (r0gi) are restricted so that Σgi = 1.0. The parameter values were recovered as described previously (21–23).
Preparation of Lipid Vesicles
For vesicle preparation, lipids with a Ru–lipid/DPPG mole ratio ranging from 1:20 to 1:100 were dissolved in CHCl3/MeOH (95/5, v/v). The lipid-containing solution was kept in a water bath at a constant temperature (55°C), and the solvent was removed by a stream of argon. Vesicles were prepared by sonication in 10 mM Tris and 50 mM KCl, pH 7.5, at a final lipid concentration of 2 mg/ml. The DPPG vesicles in the absence of Ru–lipid did not display significant signals (<1.5%) under the present experimental conditions. Unless indicated otherwise, all measurements were performed in the presence of dissolved oxygen from equilibrium with the air.
RESULTS
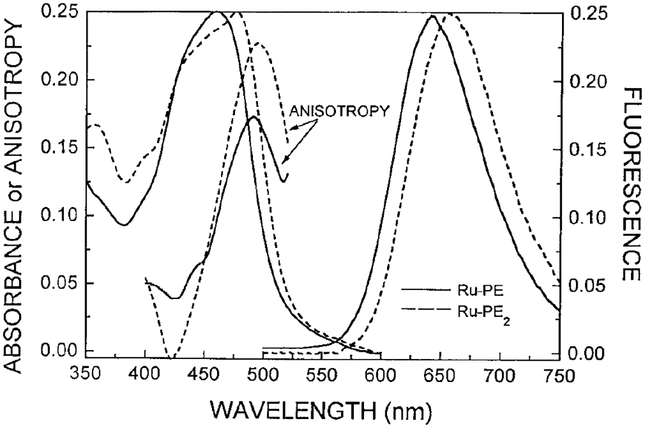
Absorption and emission spectra of DPPG vesicles labeled with Ru–PE and Ru–PE2 are shown in Fig. 1. These spectra are similar except for a slightly longer absorption and emission spectra for Ru–PE2, which contains 4,4′-dicarboxy-2,2′-bipyridine as one of the ligands. These results are in agreement with previous studies of the mono- and dicarboxy derivative of (18). Similar emission spectra were observed independent of temperature from 2 to 53°C, except for a progressive decrease in intensity with increasing temperature. At 25°C the quantum yields of Ru–PE and Ru–PE2 in DPPG vesicles, in air equilibrium, appear to be about 0.044 and 0.034, respectively, as seen by comparison with a deoxygenated aqueous solution of with an assumed quantum yield of 0.042 (24).
FIG. 1.
Absorption and emission spectra of Ru-PE (—) and Ru-PE2 (- - -) in DPPG vesicles at 20°C. Also shown is the excitation anisotropy spectra of the parent compounds Ru(bpy)2(mcbpy)+1 (—) and Ru(bpy)2(dcbpy) (- - -) in glycerol/water at −55°C.
For the MLC lipid probe to be useful as hydrodynamic probes, the metal–ligand complexes need to dis play polarized emission. The excitation anisotropy spectra of the parent compounds Ru(bpy)(mcbpy)+1 and Ru(bpy)(dcbpy) are shown in Fig. 1. In the absence of rotational diffusion, in glycerol/water (6/4, v/v) at −55°C, these complexes display maximal anisotropies of 0.17 and 0.23, respectively. These values are adequate for measurement of steady state and time resolved anisotropies. The lower anisotropy of Ru(bpy)2(mcbpy)+1 is consistent with earlier reports of this complex coupled to proteins (18). In these earlier studies (17, 18) we found that the excitation anisotropy spectra were similar for the MLC probes as the free carboxylic acids or when covalently linked to the amino groups of proteins. Hence we expect the anisotropy spectra of the parent MLCs to reflect that of the lipid probes, which could not be measured directly due to low solubility in glycerol/water.
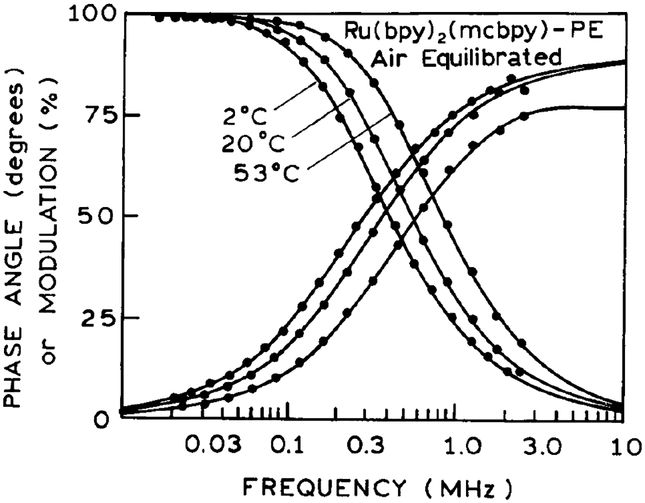
Frequency-domain intensity decays of the two lipid probes are shown in Fig. 2. These decays are closely approximated by a single exponential decay. The mean decay times of the two lipid probes are comparable and range from 682 ns at 2°C to 357 ns at 53°C (Table 1). These long decay times suggest that these probes can be used to measure rotational motions in membranes to nearly 2 μs, or about three times the mean decay time. Such long correlation times are typically measured from the phosphorescence anisotropy decay of eosin or erythrosin (25–28). However, the use of phosphorescence requires the rigorous exclusion of oxygen. In contrast, the MLC–lipid probes are only moderately sensitive to dissolved oxygen. For instance, at 4 and 45°C the decay times increased by about 8 and 25%, respectively, upon removal of dissolved oxygen. Hence, exclusion of oxygen is not needed when using these probes.
FIG. 2.
Frequency-domain intensity decays of MLC–PE and MLC–PE2 in DPPG vesicles at various temperatures.
TABLE 1.
Fluorescence Lifetimes (ns) of Ru(bpy)2(mcbpy)-PE and Ru(bpy)2(dcbpy)-PE2 in DPPG Vesicles at Various Temperaturesa
| Temperature (°C) | |||||||
|---|---|---|---|---|---|---|---|
| Ligand | 2 | 10 | 20 | 31 | 35 | 41 | 53 |
| mcbpy | 682 | 593 | 518 | — | 463 | — | 357 |
| dcbpy | 616 | 559 | 487 | 456 | — | 408 | 405 |
Solutions were in equilibrium with the air.
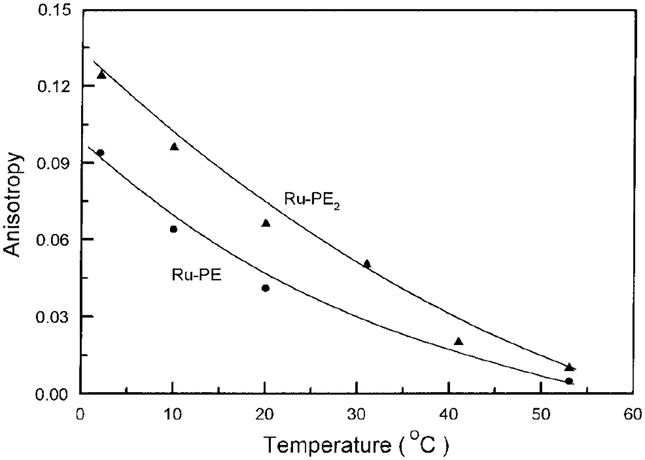
We examined the steady state anisotropies of DPPG vesicles labeled with Ru–PE or Ru–PE2 over a range of temperature spanning the transition temperature of 41°C. The anisotropies decrease progressively with increasing temperature as expected for thermally activated motions (Fig. 3). However, there is no sharp phase transition of the type seen with DPH-labeled membranes. This suggests that the MLC–lipid of the probe is localized at the lipid–water interface, as suggested from the chemical structure (Scheme I). The anisotropies of Ru–PE2 are consistently larger than those of Ru–PE, as expected from the higher fundamental anisotropy of Ru(bpy)2(dcbpy) and possibly due to less segmental motion of the MLC covalently bound to two PE molecules.
FIG. 3.
Temperature-dependent steady state anisotropies of DPPG vesicles labeled with Ru–PE or Ru–PE2.
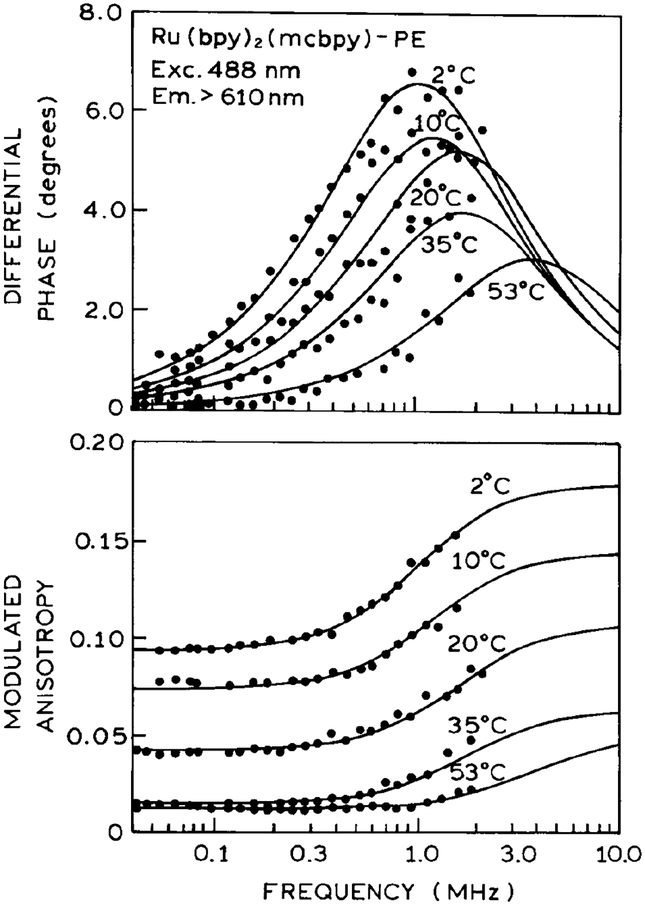
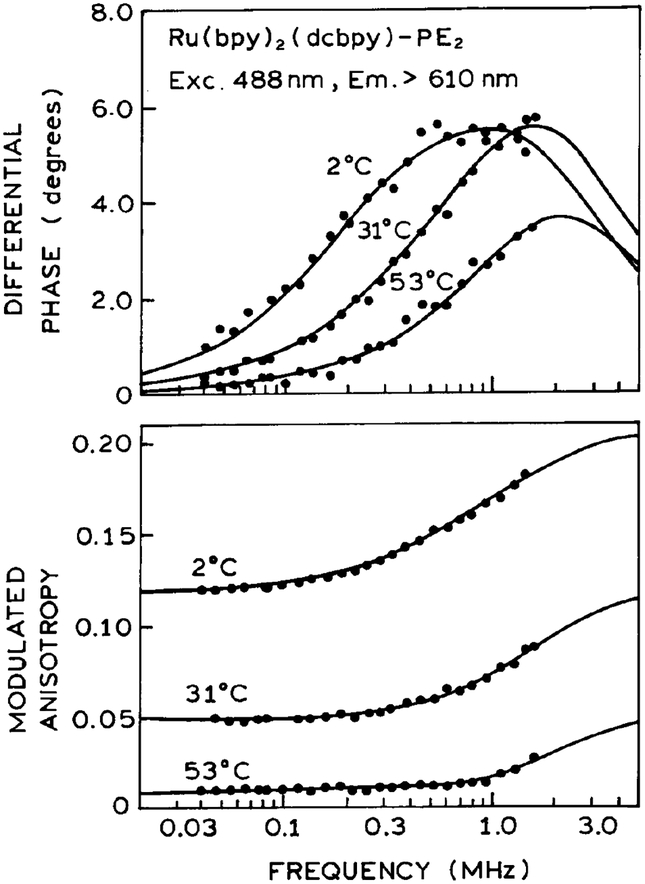
To determine the usefulness these probes for microsecond membrane hydrodynamics we examined the frequency-domain anisotropy decays of DPPG vesicles labeled with Ru–PE (Fig. 4) or Ru-PE2 (Fig. 5). Analysis of these data in terms of a double-exponential anisotropy decay are summarized in Table 2. For Ru–PE2, the anisotropy decays display both a short (≈100 ns) and long (≈1.5 ms) correlation time. These longer correlation times are consistent with those expected for over all rotational diffusion of phospholipid vesicles with diameter from 200 to 300 A. For instance, vesicles with a diameter of 250 A are expected to display a correlation time near 2020 ns (Table 3), which are similar to those obtained from the FD anisotropy data in Fig. 5 (Table 2). The amplitude of the longer correlation time decreases above the phase transition temperature, suggesting free motion of the probe. The fractional amplitude of the short correlation time remains relatively constant with temperature, suggesting that local probe motions contribute to the anisotropy decay at all temperatures.
FIG. 4.
Frequency-domain anisotropy decays of Ru–PE in DPPG vesicles.
FIG. 5.
Frequency-domain anisotropy decays of Ru–PE2 in DPPG vesicles.
TABLE 2.
Rotational Correlation Times and Amplitudes for Ru(bpy)2(mcbpy)-PE and Ru(bpy)2(dcbpy)-PE2 in DPPG Vesicles at Various Temperatures
| Ru(bpy)2(mcbpy)-PE | Ru(bpy)2(dcbpy)-PE2 | |||
|---|---|---|---|---|
| T (°C) | θR (ns) | r0gi | θR (ns) | r0gi |
| 2 | 163 | 0.10 | 133 | 0.062 |
| 5795 | 0.083 | 1761 | 0.145 | |
| 10 | 181 | 0.085 | 135 | 0.064 |
| >14410 | 0.063 | 1337 | 0.112 | |
| 20 | 107 | 0.081 | 99 | 0.087 |
| >15450 | 0.038 | 1393 | 0.071 | |
| 31 | — | 117 | 0.082 | |
| 1569 | 0.041 | |||
| 35 | 124 | 0.061 | — | |
| >10000 | 0.001 | |||
| 41 | — | 92 | 0.080 | |
| 53 | 100 | 0.033 | 84 | 0.055 |
TABLE 3.
Calculated Rotational Correlation Times for Membrane Vesicles of Various Diametersa
| Diameter (Å) | ||||||
|---|---|---|---|---|---|---|
| 200 | 250 | 300 | 400 | 500 | 600 | |
| θ (ns) | 1034 | 2020 | 3490 | 8272 | 16156 | 27918 |
Rotational correlation times (θ) were calculated from the Stokes Einstein equation θ = ηV/RT, where η = 1, cP is the viscosity, T = 297°K, and V is the volume.
Similar but less definitive results were obtained for DPPG vesicles labeled with Ru-PE (Fig. 4 and Table 2). The anisotropy decays again show a short component near 150 ns and a longer correlation time from 6 to 15 μs. There is considerable uncertainty in these longer correlation times because of the smaller funda mental anisotropy of Ru(bpy)2(mcbpy)+1 (Fig. 1), the smaller fractional amplitude of the long component to the anisotropy decay (Table 2), and the difficulty of measuring a 10-μs correlation time with a 400-ns decay time. Nonetheless, these long correlation times are consistent with those expected for phospholipid vesicles with diameters of 400–500 Å, which may be present in our sonicated lipid dispersions. The contribution of a long component in the anisotropy decay was observed for Ru–PE in an earlier communication (20) and described as a nonzero anisotropy at long times (r∞).
Another important characteristic of a lipid probe is the extent of labeling possible without spectral changes due to probe–probe interactions. We examined the emission spectra, anisotropies, intensity, and anisotropy decays of labeled DPPG vesicles where the probe-to-lipid molar ratio was varied from 1-to-20, 1-to-50, and 1-to-100. We found no significant changes in any of these spectral properties at these molar ratios. This suggests that the MLC lipid probes display the favorable property of minimal interactions. This absence of probe–probe interaction is consistent with the large Stokes’ shift of the emission seen in Fig. 1.
DISCUSSION
The MLC–lipid probes described in this report can be regarded as the first of many such probes with different spectral properties. For instance, it is known that the decay time of ruthenium MLCs can be increased to several microseconds by the use of diphenyl-phenanthroline ligands (19, 29), and that the absorption maxi mum can be shifted to 650 nm by the use of osmium in place of ruthenium (30–34). It is also possible to increase the quantum yield of such complexes to near0.5 by the use of osmium coupled to phosphine and arsine ligands (33, 36), and that such complexes display lifetimes of several microseconds. Additionally, life times as long as 14 ms have been reported for rhenium complexes with suitable ligands (37–39). We have recently found that the rhenium complexes also display polarized emission (40), and can thus be expected to be useful for measurement of microsecond anisotropy decays.
The long lifetime of the MLC–lipid probes may also allow measurement of lateral diffusion of lipids in membranes. Such measurements are not possible with ns probes due to the limited extent of diffusion during the excited state lifetime. While translational diffusion in membranes is often measured using fluorescence recovery after photobleaching, there has been controversy about the measured values (41, 42), and in dependent measurements of lipid diffusion would be valuable. Lateral diffusion in membranes should be measurable by the use of acceptor-labeled lipids. In such measurements the diffusion coefficient can be recovered from the intensity decay of the donor, as described previously for linked and unlinked donors-acceptor pairs (43, 44). The rates of lipid diffusion can thus be compared with theoretical predictions (45–47).
In summary, MLC–lipid probes can be designed with a range of emission wavelengths, lifetimes, and quantum yields, and can have wide ranging applications for studies of the dynamics of model and cell membranes.
ACKNOWLEDGMENT
The authors acknowledge the National Institutes of Health (GM-35154 and RR-08119) for support of this research.
Footnotes
Abbreviations used: bpy, 2,2′-bipyridine; mcbpy, 4-carboxy-4′-methyl-2,2′-bipyridine; dcbpy, 4,4′-dicarboxy-2,2′-bipyridine; PE, dipalmitoyl-l-α-phosphatidylethanolamine; DPPG, dipalmitoyl-L-α-phosphatidylglycerol; MLC, metal-ligand complex; Ru-PE, the conjugate of Ru(bpy)2(mcbpy) with one PE molecule; Ru-PE2, the conjugate of Ru(bpy)2(dcbpy) with two PE molecules; FD, frequency domain; DPH, 1,6-diphenyl-1,3,5-hexatriene; NHS, N-hydroxysuccinimide; DMF, dimethylformamide.
REFERENCES
- 1.Stubbs CD, and Williams BW (1992) in Topics in Fluores cence Spectroscopy, Vol. 3, Biochemical Applications (Lakowicz JR, Ed.), pp. 231–271, Plenum, New York. [Google Scholar]
- 2.Dewey TG (Ed.) (1991) in Biophysical and Biochemical Aspects of Fluorescence Spectroscopy, p. 294, Plenum, New York. [Google Scholar]
- 3.Davenport L, Knutson JR, and Brand L (1989) in Subcellu lar Biochemistry, (Harris JR, and Etemadi AH, Eds.), pp. 145–188, Plenum, New York. [Google Scholar]
- 4.Shinitzky M, Dianoux AC, Gitler C, and Weber G (1971) Biochemistry 10, 2106–2113. [DOI] [PubMed] [Google Scholar]
- 5.Cogen U, Shinitzky M, Weber G, and Nishida T (1973) Bio chemistry 12, 521–528. [DOI] [PubMed] [Google Scholar]
- 6.Lentz B, Barenholz Y, and Thompson TE Biochemistry 15, 4521–4528. [DOI] [PubMed] [Google Scholar]
- 7.Shinitzky M, and Barenholz Y (1974) J. Biol. Chem 249, 2652–2657. [PubMed] [Google Scholar]
- 8.Dale RE, Chen LA, and Brand L (1977) J. Biol. Chem 252, 7500–7510. [PubMed] [Google Scholar]
- 9.Kawato S, Kinosita K, and Ikegami A (1977) Biochemistry 16, 2319–2324. [DOI] [PubMed] [Google Scholar]
- 10.Lakowicz JR, Prendergast FG, and Hogen D (1979) Bio chemistry 18, 508–519. [DOI] [PMC free article] [PubMed] [Google Scholar]
- 11.Chen LA, Dale RE, Roth S, and Brand LJ Biol. Chem 252, 2163–2169. [PubMed] [Google Scholar]
- 12.Best L, John E, and Jahnig F (1987) Eur. Biophys. J 15, 87–102. [Google Scholar]
- 13.Van Blitterswijk WJ, Van Hoeven RP, and Van Der Meer BW (1981) Biochimica et Biophysica Acta 644, 323–332. [DOI] [PubMed] [Google Scholar]
- 14.Hresko RC, Sugar P, Barenholz Y, and Thompson TE (1986) Biochemistry 25(13), 3813–3823. [DOI] [PubMed] [Google Scholar]
- 15.Davenport L, Knutson JR, and Brand L (1988) SPIE Proc 909, 263–270. [Google Scholar]
- 16.Brand L, Knutson JR, Davenport L, Beechem JM, Dale RE, Walbridge DG, and Kowalczyk AA (1985) in Spectros copy and the Dynamics of Molecular Biological Systems (Baley PM, and Dale RE, Eds.), pp. 259–305, Academic Press, Lon don. [Google Scholar]
- 17.Terpetschnig E, Szmacinski H, Malak H, and Lakowicz JR (1995) Biophys. J 68, 342–350. [DOI] [PMC free article] [PubMed] [Google Scholar]
- 18.Szmacinski H, Terpetschnig E, and Lakowicz JR (1996) Bio phys. Chem, in press. [DOI] [PMC free article] [PubMed] [Google Scholar]
- 19.Lakowicz JR, Terpetschnig E, Murtaza Z, and Szmacinski H (1996) J. Flouresc, submitted. [Google Scholar]
- 20.Li L, and Lakowicz JR (1996) Biospectroscopy, in press. [Google Scholar]
- 21.Lakowicz JR, Gratton E, Laczko G, Cherek H, and Limke man M (1984) Biophys. J 46, 463–477. [DOI] [PMC free article] [PubMed] [Google Scholar]
- 22.Gratton E, Lakowicz JR, Maliwal B, Cherek H, Laczko G, and Limkeman M (1984) Biophys. J 46, 479–486. [DOI] [PMC free article] [PubMed] [Google Scholar]
- 23.Lakowicz JR, Cherek H, Kusba J, Gryczynski I, and John son ML (1993) J. Fluoresc 3, 103–116. [DOI] [PubMed] [Google Scholar]
- 24.Van Houten J, and Watts RJ (1975) J. Am. Chem. Soc 97(13), 3843–3844. [Google Scholar]
- 25.Burkli A, and Cherry RJ (1981) Biochemistry 20, 138–145. [DOI] [PubMed] [Google Scholar]
- 26.Mersol JV, Kutchai H, Mahaney JE, and Thomas DD (1995) Biophys. J 68, 208–215. [DOI] [PMC free article] [PubMed] [Google Scholar]
- 27.Gonzalez-Rodriguez J, Acun AU, Alvarez MV, and Jovin TM (1994) Biochemistry 33, 266–274. [DOI] [PubMed] [Google Scholar]
- 28.Voss JC, Mahaney JE, Jones LR, and Thomas DD (1995) Biophys. J 68, 1787–1795. [DOI] [PMC free article] [PubMed] [Google Scholar]
- 29.Demas JN, Harris EW, and McBride RP (1977) J. Am. Chem. Soc 99(11), 3547–3551. [Google Scholar]
- 30.Pankuch BJ, Lacky DE, and Crosby GA (1980) J. Phys. Chem 84, 2061–2067. [Google Scholar]
- 31.Lacky DE, Pankuch BJ, and Crosby GA (1980) J. Phys. Chem 84, 2068–2074. [Google Scholar]
- 32.Lin T-C, and Sutin N (1976) J. Phys. Chem 80, 97–104. [Google Scholar]
- 33.Kober EM, Marshall JL, Dressick WJ, Sullivan BP, Caspar JV, and Meyer TJ (1985) Inorg. Chem 24, 2755–1763. [Google Scholar]
- 34.Anderson PA, Strouse GF, Treadway JA, Keene FR, and Meyer TJ (1994) Inorg. Chem 33, 3863–3864. [Google Scholar]
- 35.Terpetschnig E, Szmacinski H, and Lakowicz JR (1996) Anal. Biochem, in press. [DOI] [PubMed] [Google Scholar]
- 36.Sacksteder L, Lee M, Demas JN, and DeGraff BA (1993) J. Am. Chem. Soc 115, 8230–8238. [Google Scholar]
- 37.Zipp AP, Sacksteder L, Streich J, Cook A, Demas JN, and DeGraff BA (1993) Inorg. Chem 32, 5629–5632. [Google Scholar]
- 38.Shaver RJ, Rillema DP, and Woods C (1990) J. Chem. Soc, 179–180. [Google Scholar]
- 39.Wallace L, and Rillema DP (1993) Inorg. Chem 32, 3836–3843. [Google Scholar]
- 40.Lakowicz JR, Terpetschnig E, and Szmacinski H (1996) J. Fluoresc, submitted. [DOI] [PubMed] [Google Scholar]
- 41.Gilmanshin R, Creutz CE, and Tamm LK (1994) Biochemistry 33, 8225–8232. [DOI] [PubMed] [Google Scholar]
- 42.Centonze VE, and Borisy GG (1990) in Optical Microscopy for Biology (Herman B, and Jacobson K, Eds.), p. 658, Wiley–Liss, New York. [Google Scholar]
- 43.Lakowicz JR, Szmacinski H, Gryczynski I, Wiczk W, and Johnson ML (1990) J. Phys. Chem 94, 8413–9416. [DOI] [PMC free article] [PubMed] [Google Scholar]
- 44.Lakowicz JR, Kuśba J, Wiczk W, and Gryczynski I (1990) Chem. Phys. Lett 173(4), 319–326. [Google Scholar]
- 45.Almeida PF, Vaz WL, and Thompson TE (1993) Biophys.J 64(2), 399–402. [DOI] [PMC free article] [PubMed] [Google Scholar]
- 46.Almeida PF, Vaz WL, and Thompson TE (1992) Biochemistry 31(31), 198–210. [DOI] [PubMed] [Google Scholar]
- 47.Almeida PF, Vaz WL, and Thompson TE (1992) Biochemistry 31(29), 6739–6747. [DOI] [PubMed] [Google Scholar]


