Abstract
During the past several years there has been debate about the origins of nonexponential intensity decays of intrinsic tryptophan (trp) fluorescence of proteins, especially for single tryptophan proteins (STP). In this review we summarize the data from diverse sources suggesting that time-dependent spectral relaxation is a ubiquitous feature of protein fluorescence. For most proteins, the observations from numerous laboratories have shown that for trp residues in proteins (1) the mean decay times increase with increasing observation wavelength; (2) decay associated spectra generally show longer decay times for the longer wavelength components; and (3) collisional quenching of proteins usually results in emission spectral shifts to shorter wavelengths. Additional evidence for spectral relaxation comes from the time-resolved emission spectra that usually shows time-dependent shifts to longer wavelengths. These overall observations are consistent with spectral relaxation in proteins occurring on a subnanosecond timescale. These results suggest that spectral relaxation is a significant if not dominant source of nonexponential decay in STP, and should be considered in any interpretation of nonexponential decay of intrinsic protein fluorescence.
INTRODUCTION
Numerous books, reviews and publications describe the intrinsic tryptophan (trp)‡ fluorescence of proteins (1–6). While many specific molecular interactions that affect protein fluorescence are known, these factors are often considered individually as related to a particular protein. In the following sections we examine the evidence for time-dependent spectral shifts as the origin for multiexponential or nonexponential decays of trp fluorescence in proteins, with an emphasis on proteins containing a single trp residue. An overview of these data suggests that time-dependent spectral relaxation occurs in most proteins. The timescale of spectral relaxation appears to be somewhat faster than the mean decay times, but is slow enough to result in the multiexponential intensity decays typically found for single and multi-trp proteins. Subnanosecond spectral relaxation is consistent with extensive data from physical chemistry showing that spectral relaxation proceeds faster than the rotational diffusion of solvent molecules. While exceptions undoubtedly exist for completely buried or exposed residues, the more common partially exposed trp residues in most proteins probably display time-dependent shifts. The presence of time-dependent spectral relaxation should be considered in the interpretation of protein intensity decays and in the resolution of multiple trp residues in proteins.
TRYPTOPHAN AND PROTEIN FLUORESCENCE
The multiexponential model
Prior to discussing the intensity decays of proteins it is valuable to review the multiexponential model. For this model the intensity decay following δ-function excitation is assumed to be a sum of exponentials
| (1) |
In this expression τi are the decay times associated with the time-zero intensities αi, with ∑ αi typically normalized to unity. While time-dependent decays are usually reported in terms of (Eq. 1), it is important to recall that the αi values do not directly represent the contribution of a decay component to the steady state intensity. This contribution fi is proportional to the area under the decay curve of this component, which is αiτi. The fractional contribution of each decay component to the total or steady state intensity is thus given by
| (2) |
This meaning of fi is important to remember, as one can be easily misled by apparently large αi values that are associated with short decay times which make a minor contribution to the steady state intensity.
Trp and the rotamer model
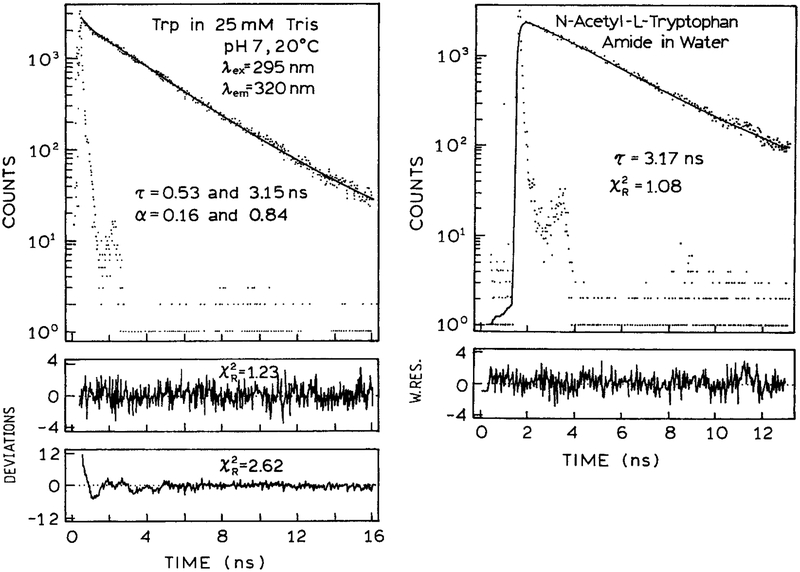
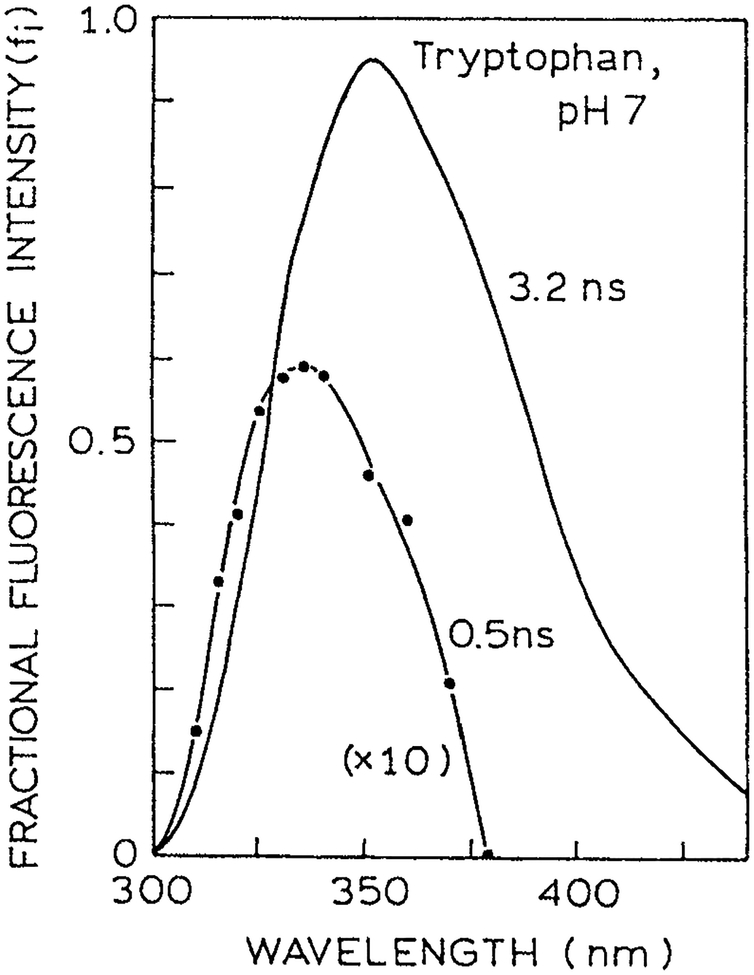
Interpretation of the intensity decays of proteins starts with an understanding of trp fluorescence. It is valuable to review what has been learned about the intensity decay of trp and its derivatives. It is well known that trp itself in neutral aqueous solution displays a double exponential intensity decay (7–12). A typical time-domain (TD) intensity decay is shown in Fig. 1 (13). Trp in aqueous solution is seen to be a weak double exponential, meaning a single decay time is a reasonable approximation of the data. It was difficult for the experimentalists to reach a consensus on the decay times and amplitudes because the short decay time component (τ2 = 0.53 ns) makes only a minor contribution to the steady state intensity, about 8% (Table 1). Also, this decay time is present mostly on the blue side of the trp emission spectrum (Fig. 2). Note that in Figure 2 the amplitude of this component is multiplied 10-fold. Some experiments with longer wavelength observation did not detect this component, resulting in disagreement between different reports.
Figure 1.
TD intensity decay of trp in 25 mM tris, pH 7.0 and NATA in water at neutral pH, 20°C (13). The precise values of αi are difficult to determine. Reprinted with permission from Kluwer Academic/Plenum Publishers.
Table 1.
Intensity decays of the aromatic amino acids at 20°C, pH 7
| Compound | τ1 (ns) | τ2 (ns) | α1 | α2 | f2 | λam (nm) |
|---|---|---|---|---|---|---|
| Indole | 4.4 | — | 1.0 | — | 0.0 | 350 |
| Tryptophan | 3.1 | 0.53 | 0.67 | 0.33 | 0.078 | 330 |
| NATA | 3.0 | — | 1.0 | — | 0.0 | 330 |
Figure 2.
Spectral resolution of the 0.5 and 3.2 ns decay time components of trp. Revised from Szabo and Rayner (8). Reprinted with permission from the American Chemical Society.
It is now generally accepted that the multiexponential decay of trp is due to the presence of rotational isomers called rotamers (Scheme 1). The presence of a double exponential decay is seen by the slightly elevated value of the goodness-of-fit parameter for the two-decay time fit as compared to the one-decay time fit. It appears that the positively charged amino group is positioned over the indole ring in one of the isomers, which quenches the indole by an electron transfer mechanism. Evidence for this mechanism includes the observation that the lifetime of trp increases several fold when the α-amino group is deprotonated (14), and the single exponential decay of the neutral trp derivative is N-acetyl-l-tryptophanamide (NATA) (Fig. 1). In NATA the amino and carboxyl groups are uncharged due to acetylation of the amine and amide formation of the carboxyl group. Without the quenching interaction due to the amino group NATA displays a single exponential decay, and the goodness-of-fit is not improved by including a second decay time in the analysis.
Scheme 1.
Rotational isomers of trp.
The continued analysis of the intensity decays of trp is a suitable discussion topic for the experts in trp fluorescence. However, it is time to put this issue to rest with more general discussions of protein fluorescence. The intensity decay of NATA is a single exponential (Fig. 1), an observation confirmed in many laboratories (8–10,15–17). The amino acid residue in proteins is NATA, not trp, and the double exponential decay of trp is not relevant in consideration of multiexponential decays in proteins. For a single trp residue in a protein, in a single conformation with no time-dependent spectral relaxation, one expects a single exponential decay. Any deviations from a single exponential decay must have its origins in multiple conformations, protein dynamics, spectral relaxation, the presence of nearby quenchers or some other molecular interaction. Static quenching or a single resonance energy transfer (RET) acceptor at a single distance will result in a single rate constant depopulating the excited state, and the trp residue will still display a single exponential decay. Multiexponential decays can result from multiple ground state conformations, by dynamic motions of quenchers, acceptors or other residues surrounding the trp residue, or from time-dependent spectral relaxation.
Early evidence for spectral relaxation in proteins
While definitive observations are limited, data available in the early 1980s already indicated the presence of spectral relaxation in proteins. It was well known from basic fluorescence spectroscopic studies that spectral shifts, on a timescale comparable to the mean lifetime, resulted in apparent lifetimes which increased with observation wavelength (18–20). Most of these early studies were performed using phase-modulation fluorometry, typically at a single light modulation frequency. A typical observation for polarity-sensitive fluorophores in moderately viscous solvents is that the apparent decay time, calculated from the phase and modulation values, increase at longer observation wavelengths. The longer apparent lifetimes on the red side of the emission of polarity-sensitive fluorophores was understood as the result of the time needed for the solvent molecules to reorient around the new excited state dipole moment, or equivalently the time for the emission spectrum to relax to longer wavelengths.
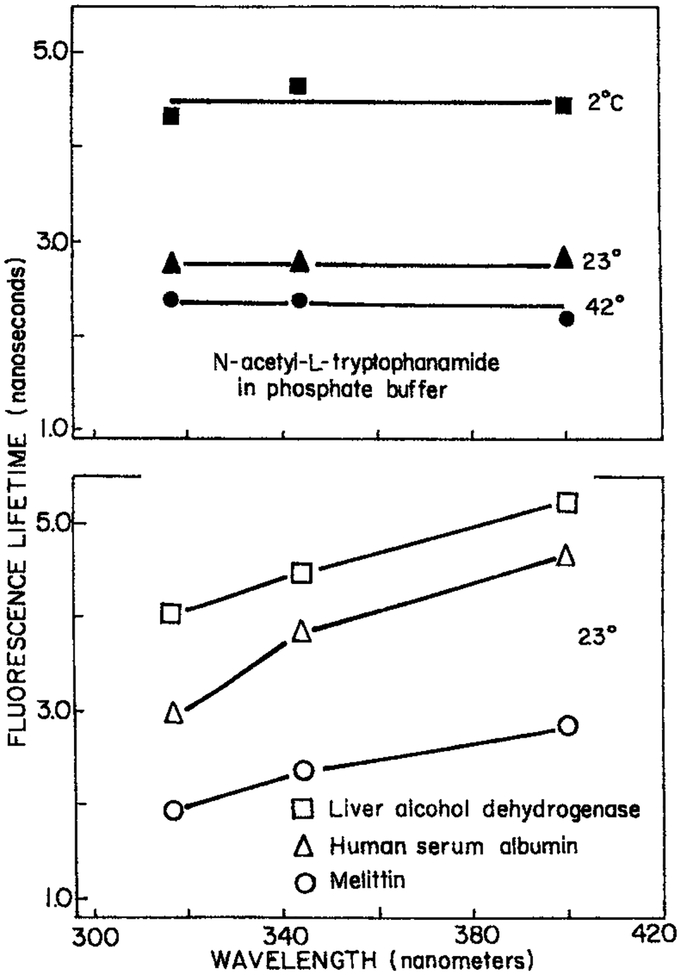
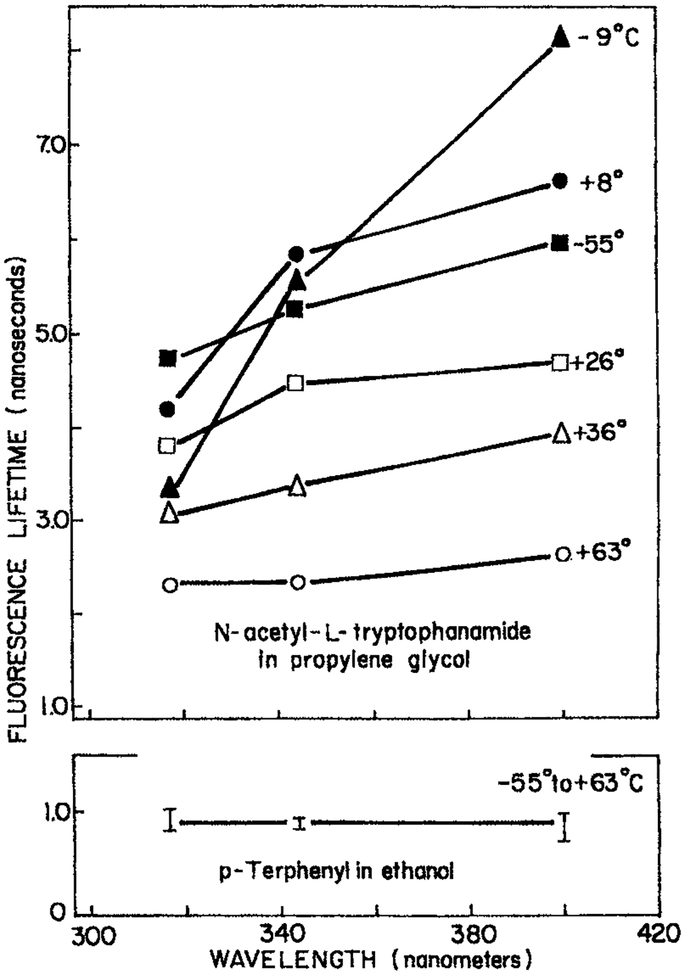
Given the known effects of spectral relaxation on the wavelength-dependent lifetime, it was of interest to examine proteins. Wavelength-dependent lifetimes for single trp proteins were reported in 1980 (21). These results were obtained from the fluorescence phase shifts measured at a single light modulation frequency. The apparent lifetimes of the single trp proteins human serum albumin and melittin were found to increase with increasing observation wavelength. For NATA in aqueous buffer the apparent lifetimes were independent of observation wavelength (Fig. 3). While the dependence on wavelength was only modest, the results were consistent with spectral relaxation. Since the emission spectra were already well red-shifted, these early data already indicated that spectral relaxation was mostly complete prior to the approximate 3 ns decay time. If spectral relaxation were slower than the emission rate then one expects blue-shifted emission spectra. The remaining dependence of apparent lifetime on wavelength indicated that relaxation was not complete, but was continuing on the nanosecond timescale. It is interesting to recall that one of the earliest definitive studies of time-resolved fluorescence of 17 proteins already noted that the decay times were generally longer on the long wavelength side of the emission (22).
Figure 3.
Wavelength-dependent apparent 30 MHz phase lifetime of NATA in propylene glycol. From Lakowicz and Cherek (21). Reprinted with permission from the Journal of Biological Chemistry, American Society for Biochemistry and Molecular Biology.
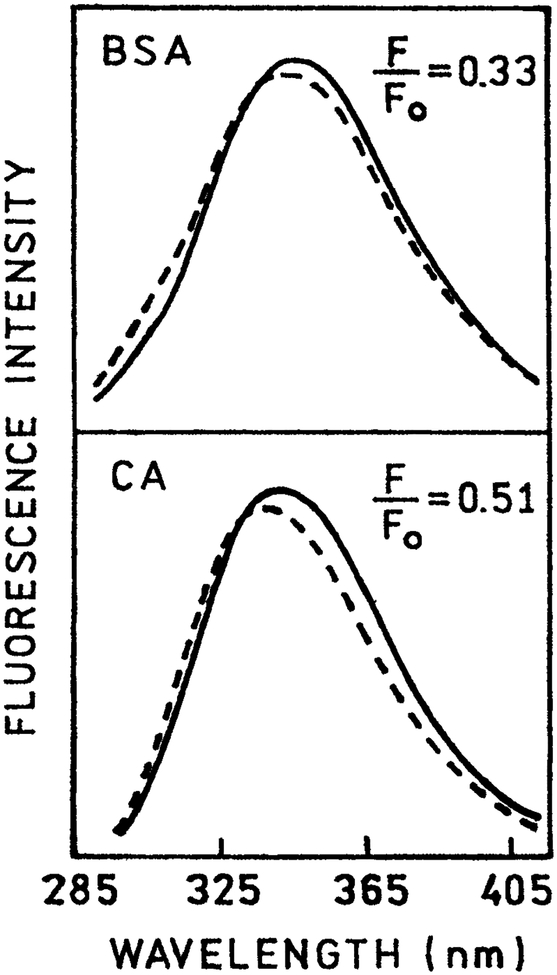
Another early observation suggesting the occurrence of spectral relaxation in proteins are the blueshifts observed upon quenching of protein fluorescence. Such shifts were reported for oxygen quenching of multi-trp proteins (23,24) and were often observed for proteins quenched by other collisional quenchers (25–28). Two early examples are shown in Fig. 4 for bovine serum albumin (BSA) (top) and carbonic anhydrase (bottom) when quenched by oxygen by 67 or 49%, respectively. In the case of BSA a tyrosine component is visible, but there also appears to be a blue spectral shift of the trp component. For oxygen quenching there is little difference in the quenching constant for exposed versus buried trp residues (29,30). Since the emission maxima of trp residues in proteins is highly variable, one expects to see both blue and redshifts for quenching of multi-trp proteins. However, collisional quenching almost always results in blueshifts of the emission maxima. As will be shown below, similar shifts have been observed with quenching STP.
Figure 4.
Emission spectra of BSA (top) and carbonic anhydrase in the absence (F0, —) and presence (F, - - -) of oxygen quenching, 280 nm excitation. Revised from Lakowicz and Weber (23).
The shifts shown in Fig. 4 can be explained by spectral relaxation and longer relative quenching of the longer lived emission on the long wavelength side of the emission spectra (31). Since the extent of collisional quenching is proportional to the mean lifetime, the longer lived emission on the red side of the spectrum is preferentially quenched. These quenching-dependent shifts can be described mathematically by assuming the emission center-of-gravity displays an exponential shift with a relaxation time τS (32–34)
| (3) |
In this expression and are the emission center-of-gravity at t = 0 and infinity, respectively. Collisional quenching typically decreases the lifetime according to the Stern–Volmer equation
| (4) |
where τ0 and τ are the lifetimes in the absence and presence of quencher at a concentration [Q], respectively, and K is the Stern–Volmer quenching constant. The measured center-of-gravity is the average of weighted by the intensity decay,
| (5) |
Introduction of (Eq. 3) and a single exponential intensity decay results in
| (6) |
This expression indicates that a reduction in lifetime τ due to collisional quenching or any other process is expected to result in a blueshift in the emission spectrum. The fact that such shifts are small are consistent with the above suggestion that spectral relaxation is typically faster than the intensity decay, the emission spectrum is mostly relaxed so that , and it is thus difficult to decrease the lifetime by collisional quenching to an extent which results in large blueshifts. As will be described below, there appears to be no correlation between the emission maximum and lifetime of the trp residues in single trp proteins. In this case one expects that collisional quenching will result in redshifts in about 50% of these proteins and blueshifts in the other 50%. To this author’s knowledge, quenching-induced redshifts are rarely observed and have not been reported.
Some of the references cited above are from the author’s laboratory. This selection is not intended to suggest that these are the definitive observations. Many laboratories have contributed to the understanding of protein fluorescence. The selection of references and figures are intended to illustrate those experimental observations over a period of 25 years which have resulted in the suggestion that spectral relaxation is a common occurrence in proteins.
Negative preexponential factors
From studies of excited state reactions it is known that the intensity decay of the product of an excited state reaction can display a negative preexponential factor (35). Observation of such a factor proves the existence of an excited state process. Hence there have been efforts to observe such components on the long wavelength side of protein emission spectra. One such observation has been reported, this being for chicken pepsinogen (36). On the red side of the emission the α value was −0.19 to −0.29, with the constraint ∑i |αi| = 1.0. Such definitive observations are rare. While there is no reason to doubt these results, this author is not aware of a confirmation of this observation, or other reports for negative preexponential factors for intrinsic trp fluorescence of proteins in fluid aqueous solution. A recent study reported negative preexponential factors for the single trp protein melittin in methanol or glycerol/water mixtures (37). Negative preexponential factors are more easily seen in polar viscous solvents.
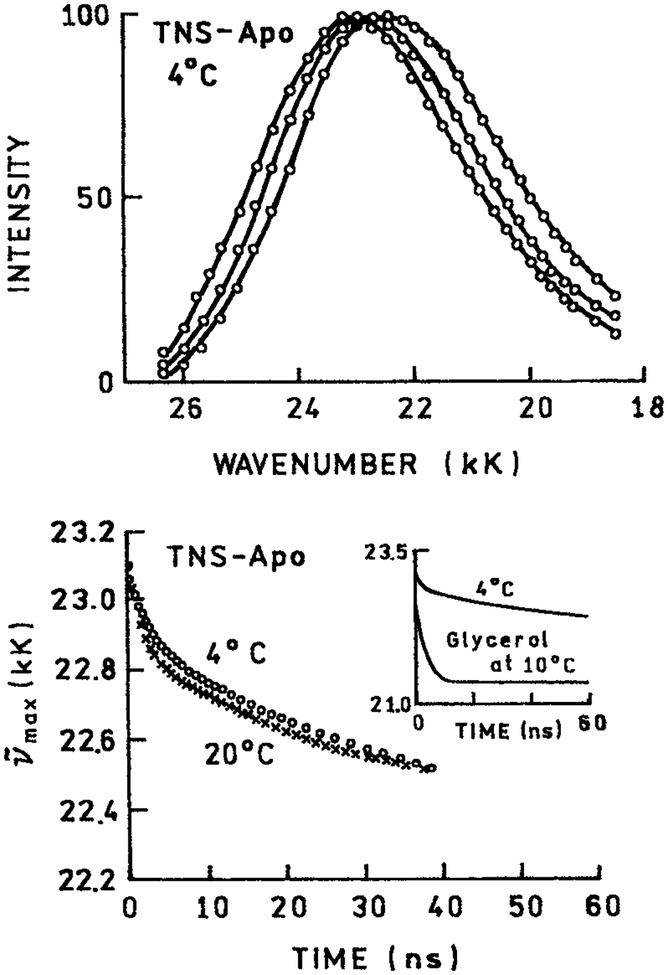
While negative preexponential factors are rarely observed for intrinsic protein fluorescence, such factors are readily seen with other fluorophores bound to proteins. Brand and Gohlke (38) constructed the time-resolved emission spectra (TRES) of 2-p-toluidinyl-6-sulfonic acid (TNS) bound to BSA and bound to apomyoglobin (39) (Fig. 5). In both cases the emission spectra shifted to longer wavelengths on a nanosecond timescale. In the case of apomyoglobin the TNS molecule binds to the hydrophobic binding site vacated by the heme group (40). The TNS probe, located in the center of a protein, displayed a negative preexponential factor on the red side of the emission spectrum. If one selectively observes only the product of an excited state reaction, it is known that the preexponential factor of the initially excited and relaxed species should be equal and opposite (35). In the case of TNS–apomyoglobin the factors were not equal and opposite, and the negative factor was small. Negative preexponential factors smaller than unity result from spectral overlap of the initially excited and the relaxed states. Nevertheless, observation of even a small negative preexponential factor proves the existence of an excited state process.
Figure 5.
TRES at 4°C (top) and emission center-of-gravity (bottom) for 2,6-TNS–labeled apomyoglobin. Revised from Brand and Gohlke (38).
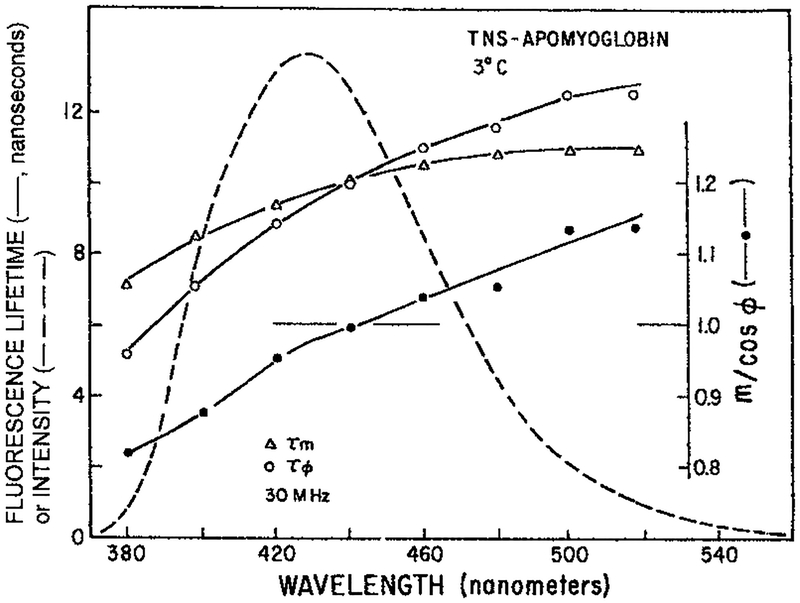
Phase-modulation fluorometry was also used to prove the existence of spectral relaxation in TNS–apomyoglobin. Figure 6 shows the apparent phase and modulation lifetimes across the emission spectrum of TNS–apomyoglobin (41). One notices that both apparent lifetimes increase across the emission spectrum, consistent with relaxation. In this case there is no reason to expect heterogeneity of the type found for a multi-trp protein. There is only one probe and one binding site. Hence this observation supports the presence of dipolar relaxation in proteins.
Figure 6.
Apparent phase and modulation lifetimes (—) at 30 MHz measured across the emission spectra of TNS–apomyoglobin (- - -). Also shown is the ratio m/cos θ Lakowicz and Cherek (41).
One could argue that the TNS was bound in multiple conformations, such as with the sulfonyl group on the naphthalene pointed toward the surface or toward the inside of the protein. In this event the longer wavelength emission is expected to result from the more polar binding orientation. It is well known that the intensity and lifetime of I-anilino-8-naphthalene sulfonic acid (ANS), TNS and similar probes decrease in more polar environments (42,43). Hence for conformational heterogeneity one expects shorter lifetimes at longer emission wavelengths, the opposite of that seen in Fig. 6.
The data in Fig. 6 support the hypothesis of nanosecond dipolar relaxation in proteins. However, an increase in the mean lifetime is consistent with but not conclusive for this hypothesis. There is a feature of the data which proves spectral relaxation, this being the observation of apparent phase lifetimes (τϕ) which are larger than the apparent modulation lifetimes (τm). As a reminder, the apparent lifetime are those calculated from the actual observed quantities, which are the phase angle (ϕ) and the modulation (m) of the emission at a given light modulation frequency in radians/s (ω),
| (7) |
| (8) |
Examination of Fig. 6 reveals that τϕ > τm on the long wavelength side of the emission. It is well known that for a multiexponential decay of the type expected for ground state heterogeneity, that is with positive preexponential factors, the apparent phase lifetime is always shorter than the apparent modulation lifetime, τϕ ≤ τm (44). A multiexponential decay with positive preexponential factors can only result in apparent phase lifetimes that are shorter than the apparent modulation lifetimes. Observation of τϕ > τm can only result if there is an excited state process. The observation of τϕ > τm with frequency-domain (FD) measurements is equivalent to observation of a negative preexponential factor in the TD. Hence, both the TD (Fig. 5) and the FD data (Fig. 6) prove the occurrence of an excited state process in TNS–apomyoglobin. It seems clear that this process is dipolar relaxation of the protein around the excited state dipole of TNS. If proteins relax around the extrinsic probe TNS it seems logical that proteins will also relax around the trp residues.
While this article is not intended to be a tutorial on time-resolved fluorescence, it is useful to summarize the spectral features that are proof of an excited state process. In the TD, observation of a negative preexponential factor is proof. In the FD, proof of an excited state process is obtained if one observes τϕ > τm. As was first pointed out by Vesolova et al. (45), this relationship is also stated by observing (21,46)
| (9) |
For a single exponential decay m = cos ϕ and for a heterogeneous decay m < cos ϕ. The phase and modulation lifetimes shown in Fig. 6 can also be presented as the m/cos ϕ ratio. The long wavelength values over 1.0 prove that relaxation is occurring on the timescale of the emission.
It is important to remember that failure to observe a negative αi value, or τϕ > τm, does not prove relaxation is not occurring. Negative αi values, or m/cos ϕ values greater than 1.0, are easily masked by spectral overlap of multiple fluorophores, or even by spectral overlap of the initially excited and the spectrally relaxed states (47,48). Failure to observe a negative preexponential factor does not prove spectral relaxation is not occurring.
RECENT STUDIES OF PROTEIN RELAXATION
TRES of labeled proteins
Since the 1980s there has been extensive development of instrumentation for time-resolved fluorescence, for both the TD (48–51) and the FD measurements (52–56). These instruments have been used to determine the TRES of proteins labeled with extrinsic fluorophores (57,58). Many of these studies have been performed using apomyoglobin labeled in the hydrophobic heme-binding site with ANS, TNS or 6-propionyl-2-(dimethylamino) naphthalene (Prodan) (59). Prodan is highly sensitive to solvent polarity because of the large charge separation in the excited state (Scheme 2). While it is possible to observe Prodan emission from the locally excited state prior to charge separation, this is rare and requires low temperature and a careful choice of solvent (60). To a good approximation Prodan responds to solvent polarity based on the Lippert–Mataga equation (61,62).
Scheme 2.
Charge separation in the excited state of Prodan.
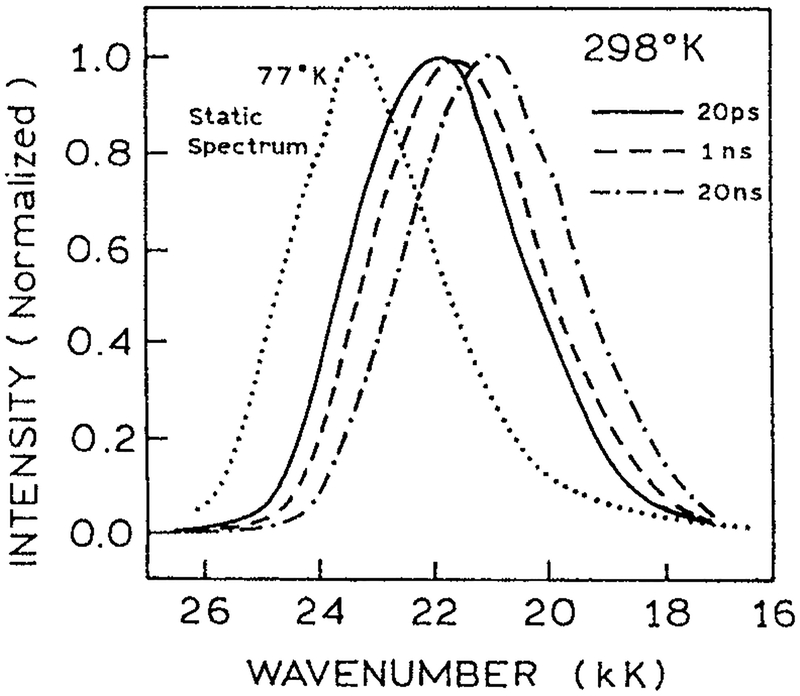
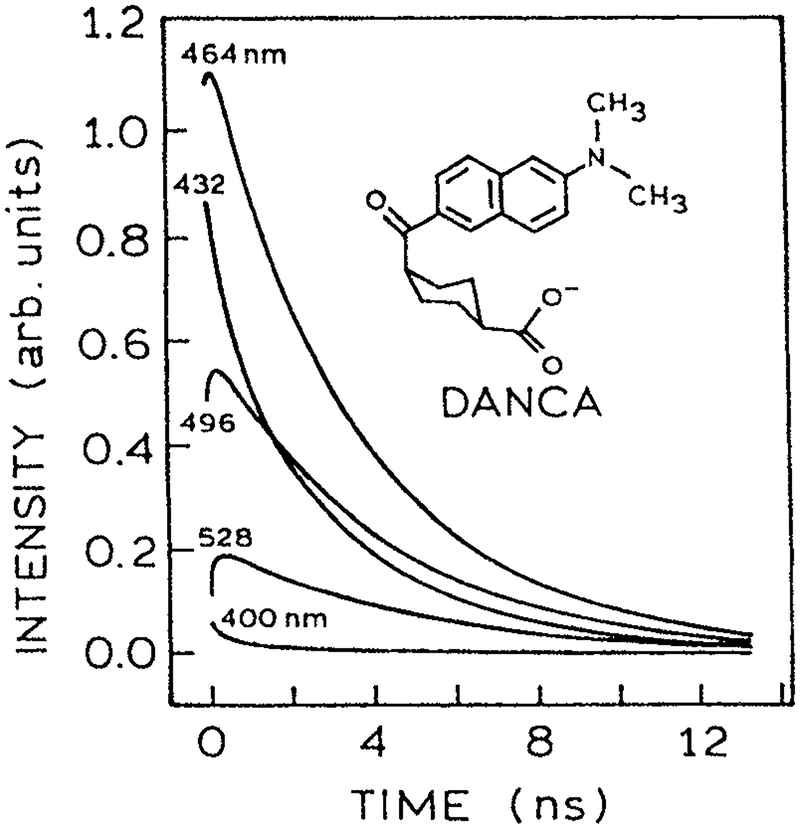
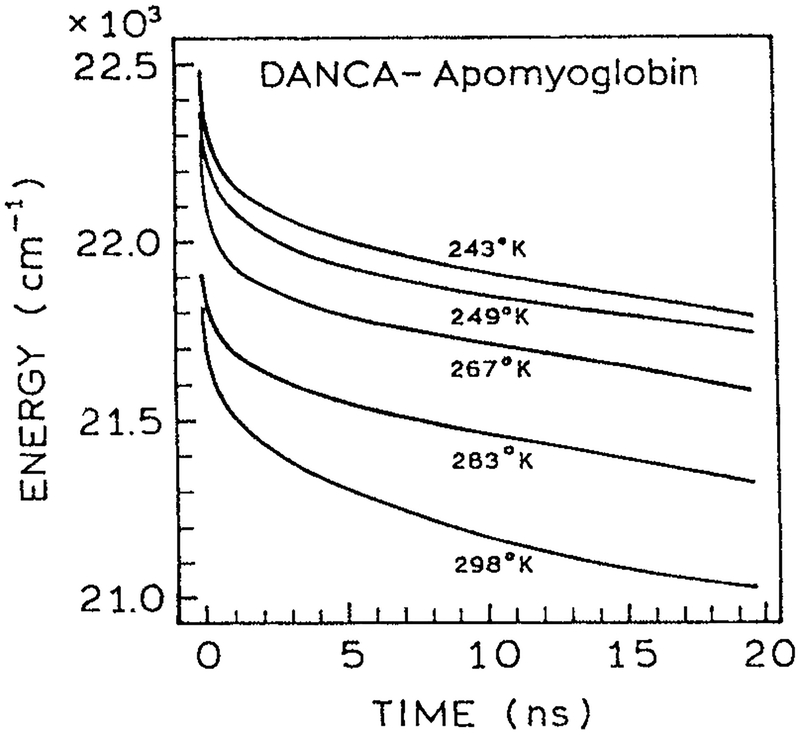
TRES of proteins labeled with TNS, Prodan or their derivatives have been reported in several laboratories. Typical results are shown in Fig. 7 for 2′-(N,N-dimethylamino)-6-naphthoyl-4-trans-cyclohexanoic acid (DANCA)-labeled apomyoglobin. DANCA is a derivative of Prodan, which contains a covalently linked sugar residue to insure binding to apomyoglobin in one orientation. The emission spectra shift to longer wavelengths at longer times. Importantly, the data prove spectral relaxation is occurring because of the observation of negative αi values at long wavelengths. The negative preexponential factors are seen from the rise in the intensity decays at longer observation wavelengths (Fig. 8). Negative αi values for labeled proteins have been observed by several laboratories. These data support the hypothesis that nanosecond dipolar relaxation is a common feature of proteins.
Figure 7.
TRES of apomyoglobin labeled with the Prodan derivative DANCA (57). Reprinted with permission from the American Chemical Society.
Figure 8.
Fluorescence decays of the DANCA–apomyoglobin complex from 400 to 528 nm at 298 K (57). The area under each trace has been scaled to the steady state intensity at that wavelength. Note the intensity decays show a rise time at longer wavelengths. Reprinted with permission from the American Chemical Society.
Timescale of spectral relaxation
Time-resolved intensity decays measured across the emission spectra can be used to calculate the TRES and the time-dependent center-of-gravity (63–65). The rate at which shifts to longer wavelengths reveals the timescale of protein relaxation around the excited state dipole moment. For protein-bound fluorophores the emission center-of-gravity typically shifts according to complex decay law with components ranging from 20 ps to 20 ns (Fig. 9). This type of relaxation is consistent with our understanding and intuition about protein dynamics, which is that smaller molecular motions occur more rapidly than larger molecular motions, and that protein motions occur on a wide range of timescales. This relationship of magnitude and timescale of molecular motions has been reported from a number of theoretical and experimental studies of protein dynamics (66–68). In particular, vibrational motions typically occur on subpicosecond to picosecond timescales, and larger motions such as rotation of aromatic rings occur on a picosecond to nanosecond timescale. One can imagine how the timescale of these different motions are reflected in the multiexponential decays of (Fig. 9). Since spectral relaxation around the extrinsic protein-bound fluorophores seems to be a common occurrence, there is no reason to believe such relaxation does not occur around trp residues in proteins.
Figure 9.
Time-dependent emission center-of-gravity for DANCA-labeled apomyoglobin (57). Reprinted with permission from the American Chemical Society.
Spectral relaxation of trp/NATA in polar solvents
In the previous sections we saw that negative preexponential factors (αi < 0) are easily seen for labeled proteins. Why are negative αi values rarely seen for intrinsic trp fluorescence of proteins? The answer lies in the easy making of negative αi values by spectral overlap. Consider NATA in the viscous polar solvent propylene glycol. The effects of spectral relaxation on the apparent lifetimes is most dramatic at −9°C when the rate of spectral relaxation is comparable to the mean decay time (Fig. 10). This dependence is less dramatic at higher or lower temperatures, where relaxation is faster or slower than the lifetime, respectively. At high temperature (63°C) relaxation in propylene is complete prior to emission and the apparent lifetime is independent of emission wavelength. At very low temperatures (−55°C) the apparent lifetime become less dependent on temperature because spectral relaxation is slower than emission. These results show that observation of a dramatic dependence of the mean decay time on temperature requires that the spectral relaxation time (τS) be comparable to the mean lifetime (τ)−. As seen for the labeled proteins (Figs. 5 and 7), a large fraction of the total relaxation was found to occur on the subnanosecond timescale. This rapid initial relaxation probably increases the extent of spectral overlap, increasing spectral overlap of the relaxed and partially relaxed state, and decreasing the dependence of the mean decay time on wavelength.
Figure 10.
Apparent phase lifetimes of NATA measured at 30 MHz in propylene glycol (21). Reprinted with permission from the Journal of Biological Chemistry.
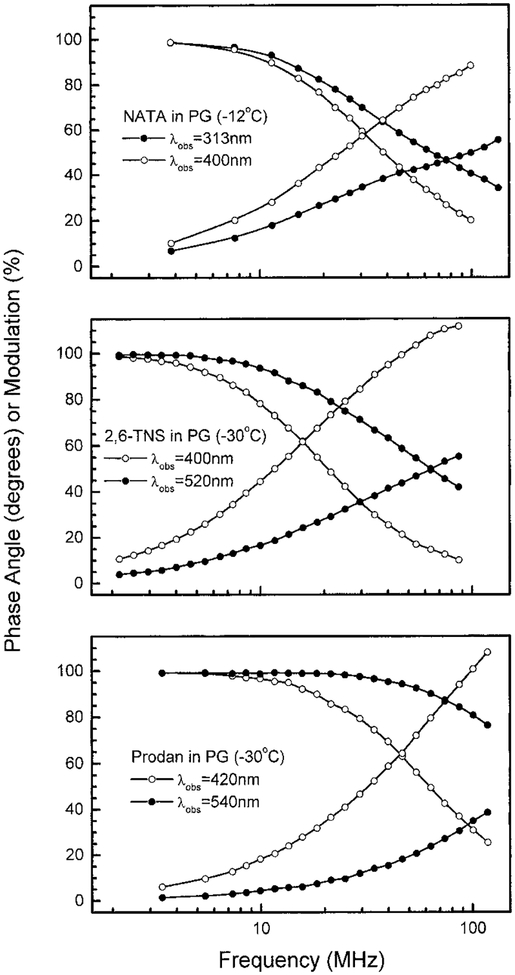
The difficulty in observing negative αi values for NATA is supported by more recent TRES obtained using TD (69,70) and FD measurements (I. Gryczynski et al., unpublished). Wavelength-dependent FD intensity decays for NATA in propylene glycol at −12°C are shown in Fig. 11 (top). One notices a dramatic dependence on the observation wavelength (λobs). It appears that the phase angles of NATA will exceed 90°, but such values have been difficult to observe. These data were analyzed in terms of the multiexponential model. Even at the most favorable temperature of −12°C the negative αi value is only −0.29 (Table 2). The negative αi value does not approach −0.5, as expected for the selective observation of only the spectrally relaxed state. Additionally, significantly negative αi values were only found at −12°C, and were not found at somewhat lower or higher temperatures (Table 2). Hence even under these favorable conditions the negative αi value disappeared when the rate of spectral relaxation was slightly faster or slower than the optimum rate.
Figure 11.
Wavelength-dependent FD intensity decays of NATA, 2,6-TNS and Prodan in propylene glycol.
Table 2.
Intensity decays of NATA in propylene glycol*
| λobs (nm) | α1† | τ1 (ns) | α2 | τ2 (ns) |
|---|---|---|---|---|
| 20°C | ||||
| 313 | 0.44 | 0.75 | 4.82 | 0.56 |
| 360 | 0.01 | 0.75 | 0.49 | 0.56 |
| 400 | −0.02 | 0.75 | 0.98 | 0.56 |
| −12°C | ||||
| 313 | 0.74 | 1.20 | 0.25 | 6.82 |
| 360 | 0.00 | — | 1.00 | 6.82 |
| 400 | −0.29 | 1.20 | 0.71 | 6.82 |
| −60°C | ||||
| 313 | 0.66 | 3.07 | 0.34 | 5.78 |
| 340 | 0.32 | 3.07 | 0.68 | 5.78 |
| 380 | −0.02 | 3.07 | 0.98 | 5.78 |
I. Gryczynzki and J. R. Lakowicz, unpublished observations.
∑ |αi| = 1.0.
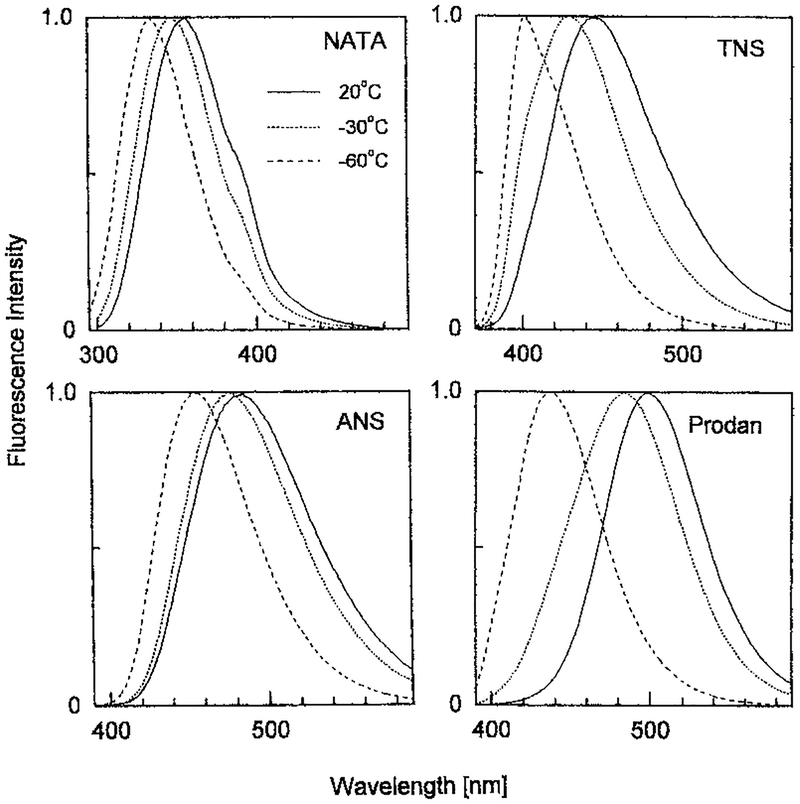
Why are negative αi values difficult to detect for NATA? The answer lies in spectral overlap of the initially excited and the relaxed states. One can show from simulations (47) that spectral overlap results in less negative αi values, and easily results in only positive αi values. As for most fluorophores, the emission spectral shape of NATA is not symmetrical on the wavelength scale. The emission spectra of NATA rises quickly on the blue side of the emission, but shows a long tail on the red side of the emission (Fig. 12). This long wavelength tail results in significant spectral overlap, even comparing NATA in propylene glycol at 20°C where spectral overlap is complete and at −60°C where spectral overlap does not occur during the excited state lifetime.
Figure 12.
Temperature-dependent emission spectra of NATA, 1,8-ANS, 2,6-p-TNS and Prodan in propylene glycol. From G. Pisczek and J. Lakowicz, unpublished observations.
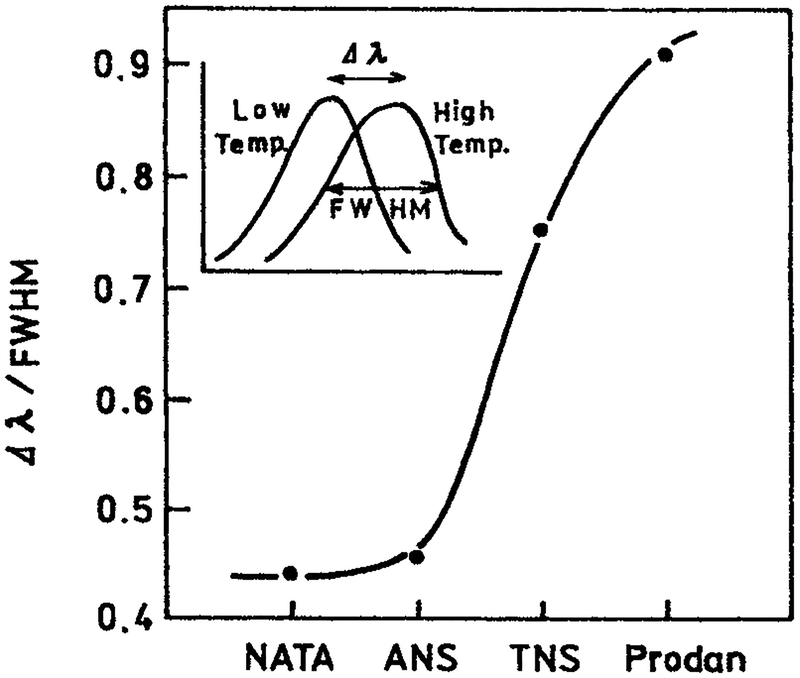
Compared to other fluorophores NATA shows a smaller temperature-dependent blueshift. This can be seen by examining the emission spectra of NATA, TNS, ANS and Prodan in propylene glycol at 20 and −60°C. One can visually see there is less overlap of the relaxed and the unrelaxed states for TNS and Prodan than for NATA (Fig. 12). This impression can be made more quantitative using the ratio of the temperature-dependent shift (Δλ) to the width of the emission spectrum (full-width at half maximum [FWHM]). These ratios show that TNS and Prodan display much larger wavelength shifts relative to the width of their emission spectra than do NATA and ANS (Fig. 13).
Figure 13.
Ratio of the temperature-dependent shift in the emission maximum (Δχ) to the FWHM intensity of the emission spectrum for NATA, ANS, TNS and Prodan (G. Pisczek and J. Lakowicz, unpublished observations).
The difficulty in observing negative preexponential factors for NATA can be seen by comparison of its FD intensity decay with that of the more solvent sensitive fluorophores. For TNS and Prodan the phase angles on the long wavelengths side of the emission easily exceed 90°, whereas such values were difficult to observe with NATA. These data were used to recover the multiexponential decay laws. The difficulties in detecting negative preexponential factors for NATA can be seen by comparing the wavelength-dependent intensity decays of NATA, TNS and Prodan (Tables 2–4). For NATA and TNS significantly negative factors could only be observed at the most favorable temperature. For Prodan (Table 4), which is more solvent sensitive, negative factors could be observed over a wider range of temperature. Equal and opposite factors (−0.5 and +0.5) were observed for Prodan, but not for TNS and NATA. In total, this comparison of temperature-dependent emission spectra and temperature-dependent decay shows that the long wavelength tail and modest overall spectral shift of NATA make it difficult to observe negative αi values except under the more favorable conditions.
Table 4.
Intensity decays of prodan in propylene glycol*
| λobs (nm) | α1 | τ1 (ns) | α2 | τ2 (ns) |
|---|---|---|---|---|
| 20°C | ||||
| 460 | 0.57 | 0.38 | 0.43 | 3.24 |
| 500 | −0.16 | 0.38 | 0.84 | 3.24 |
| 540 | −0.35 | 0.38 | 0.65 | 3.24 |
| −30°C | ||||
| 460 | 0.55 | 1.11 | 0.45 | 3.84 |
| 500 | −0.38 | 1.11 | 0.62 | 3.84 |
| 540 | −0.50 | 1.11 | 0.50 | 3.84 |
| −60°C | ||||
| 400 | 0.77 | 1.21 | 0.23 | 3.58 |
| 440 | 0.28 | 1.21 | 0.72 | 3.58 |
| 480 | −0.35 | 1.21 | 0.65 | 3.58 |
From I. Gryczynski and J. Lakowicz, unpublished observations.
For completeness we note that the ability to observe negative αi values can be affected by the choice of solvents. In particular, somewhat more negative factors were observed for NATA in isobutanol (69,70). Observation of negative αi values depends on optimal conditions for dipolar relaxation to result in an adequate spectral shift on an appropriate timescale.
Timescales of dipolar relaxation and larger molecular motions
In the preceding sections we commented that the spectral relaxation is due to small molecular motions that are expected to be more rapid than larger molecular motions such as rotational diffusion. This fact is well known in fluorescence spectroscopy and physical chemistry. There is a known relationship between the dielectric relaxation time of a solvent (τD) and the expected spectral relaxation time (τS)
| (10) |
where n is the refractive index and ϵ is the dielectric constant of the solvent (71–77). The dielectric relaxation time is essentially the correlation time for rotational diffusion of the solvent molecules. Foster components in the dielectric relaxation can be observed for smaller displacements of parts of a flexible solvent molecule or to breaking and remaking of hydrogen bonds. Apparently these faster motions are relevant for spectral relaxation. For polar solvents the values of τS is approximately 1/5 of τD. For fluid solvents at room temperature the values of τD are near 20 ps. Hence, spectral relaxation in such solvents is expected to occur in about 4 ps.
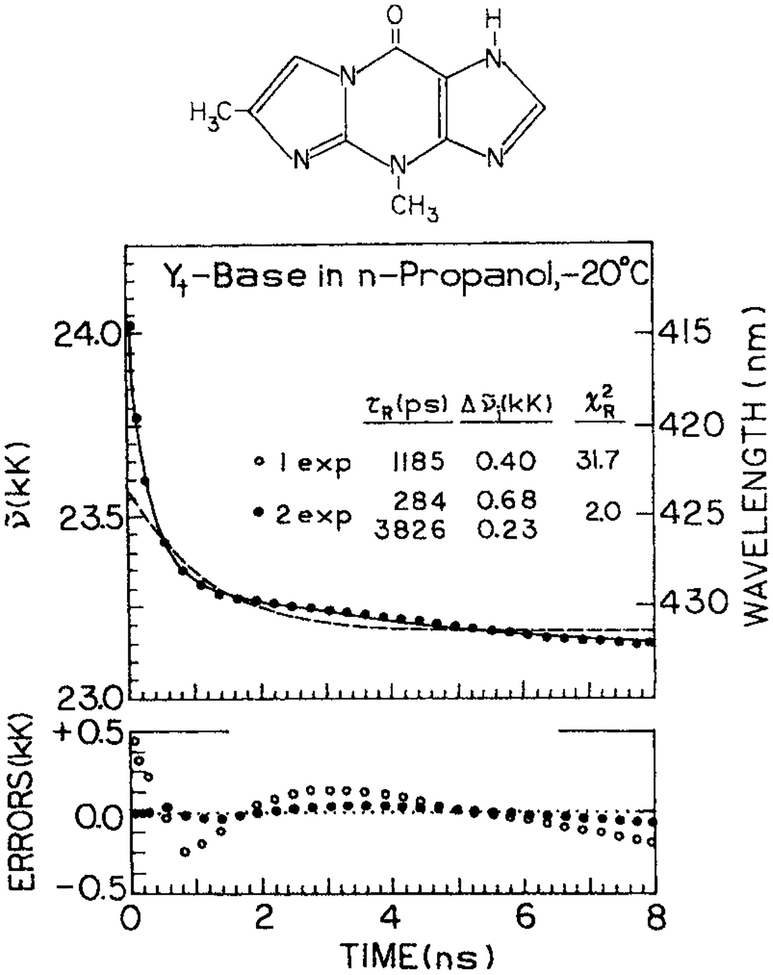
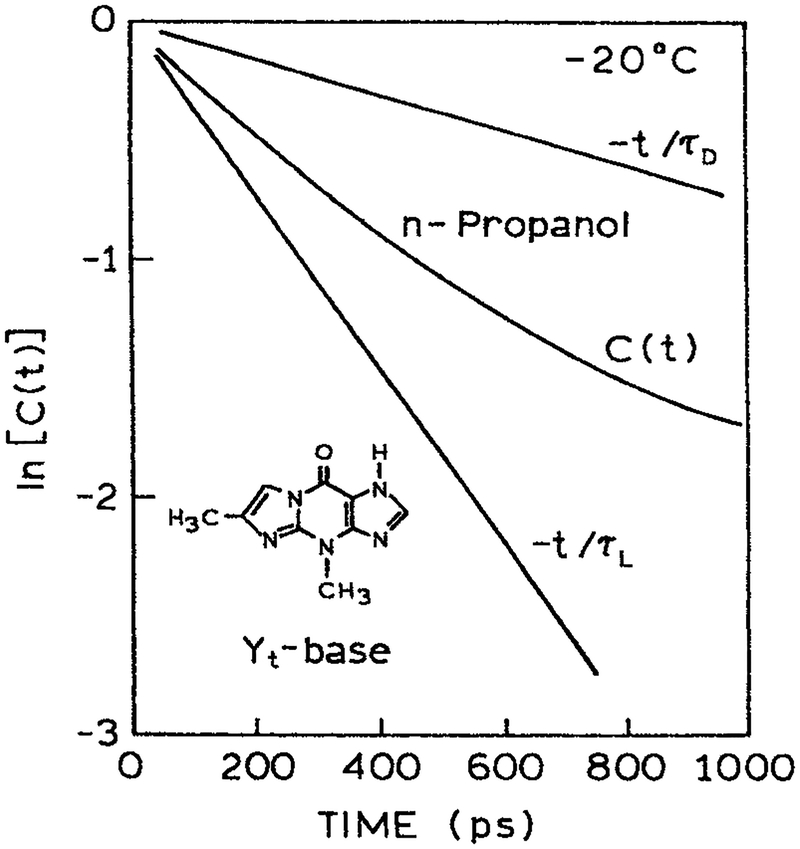
It is informative to compare the rate of spectral relaxation with the spectra (τS) and dielectric (τD) relaxation times of a solvent. Figure 14 shows the time-dependent emission center-of-gravity for 4,9-dihydro-4,6-dimethyl-9-oxy-1H-imidazo-1,2α-purine (Yt)-base in propanol at −20°C (78). The emission center-of-gravity of Yt-base decays according to a multiexponential function with spectral relaxation times of 3826 and 284 ps. These widely different times are probably due to the overall rotation of the solvent molecules and the smaller displacements of the hydroxyl groups on the solvent. A comparison of the observed rates of spectra relaxation with that expected for the known values of τS is shown in Fig. 15. This figure shows the correlation function for spectral relaxation
| (11) |
This function is basically the relaxation normalized to unity for the entire spectral shift. The measured correlation function is seen to be intermediate between that expected for solvent rotational diffusion (τD) and solvent segmental motions (τS), indicating that both processes contribute to the relaxation process. Hence it seems probable that spectral relaxation of trp residues in proteins will also be due to a combination of smaller and larger molecular motions.
Figure 14.
Time-dependent emission center-of-gravity for Yt-base in n-propanol. From Szmacinski et al. (78). Reprinted with permission from Kluwer Academic/Plenum Publishers.
Figure 15.
Comparison of the spectral relaxation correlation factors C(t) with that expected for known values of τD and τS. From Szmacinski et al. (78). Reprinted with permission from Kluwer Academic/Plenum Publishers.
The size-dependence of various molecular motions can also be seen from a comparison of the rotational correlation times of a fluorophore (θ) with the solvent relaxation time τS and τD. Since the fluorophore is larger than the solvent molecules one expects
| (12) |
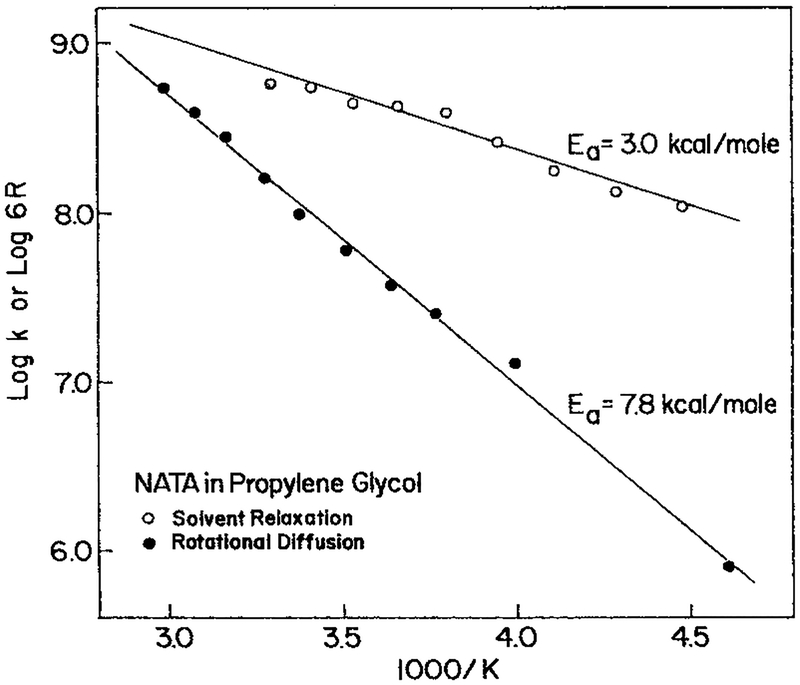
The expected relationship between τS and θ has been experimentally verified for NATA in propylene glycol over a range of temperatures (79) and for a variety of fluorophores and solvents (80–84). For NATA in propylene glycol (Fig. 16) the values of τS are about several-fold smaller than the rotational correlation times, confirming that under comparable conditions spectral relaxation is more rapid than rotational diffusion. One also notices that the activation energy is smaller for spectral relaxation than for rotational diffusion. This is consistent with the smaller molecular displacements needed for spectral relaxation. Additionally, the smaller activation energy means that it is difficult to decrease the spectral relaxation rates in proteins by decreasing the temperature. Lower temperatures can have a dramatic effect on rotational displacements, and still have a more modest effect on the spectral relaxation.
Figure 16.
Rates of spectral relaxation and the rates of rotational diffusion (6R = θ−1) for indole in propylene glycol (79). Reprinted with permission from Pergamon Press.
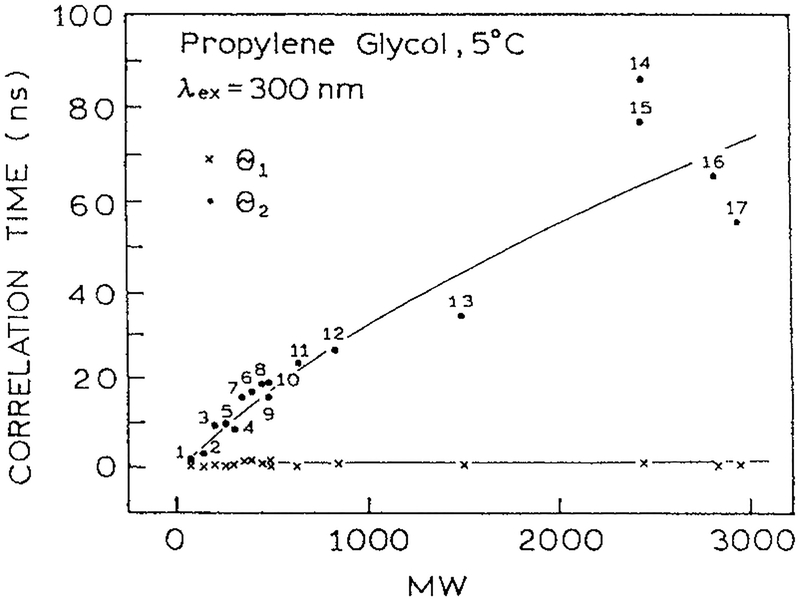
What is the significance of these observations of τS, τD and θ to spectral relaxation in proteins? With few exceptions, the trp residues in most proteins display short correlation times near 100 ps. This is shown for a series of single trp peptides (Fig. 17). The anisotropy decay of these peptides were analyzed in terms of short (θS) and long (θL) rotational correlation times (13, I. Gryczynski and J. R. Lakowicz, unpublished). The long correlation times (·) increase with the size of the protein, as is expected from the Stokes–Einstein equation. However, the short correlation times (×) are independent of protein size and are consistently near 500 ps (Fig. 17). The short correlation time can be considered to be analogous to the rotational correlation time of a fluorophore in a solvent (θ). Hence one can predict that spectral relaxation occurs several fold faster than the 500 ps correlation times for segmental motions. Based on the observations for NATA (Fig. 16) one can thus expect that spectral relaxation in proteins will occur in about 200 ps, and probably faster.
Figure 17.
Short and long rotational correlation times for indole, trp and peptides in propylene glycol at 5°C. 1, indole; 2, 3-methylindole; 3, TRP; 4, NATA; 5, gly-trp; 6, trp-trp; 7, gly-trp-gly; 8, leu-trp-leu; 9, glu-trp-glu; 10, lys-trp-lys; 11, gastrin; 12, pentagastrin; 13, (Tyr4-bombesin); 14, dynorphine; 15, (asn15)-dynorphine; 16, cosyntropin; 17, melittin (13, I. Gryczynski and J. R. Lakowicz, unpublished). Reprinted with permission from Kluwer Academic/Plenum Publishers.
Decay associated spectra of STP
The ubiquitous presence of spectral relaxation in proteins is suggested by their decay-associated spectra (DAS). The DAS are created using the same data used to construct the TRES, which are the wavelength-dependent intensity decays,
| (13) |
For most analysis it is assumed that the decay times are independent of wavelength, so that τi(λ) = τi and the number of decay times is the number of components used in the analysis. The DAS are constructed from the wavelength-dependent values of αi(λ). The emission spectrum associated with each decay time is given by
| (14) |
where I(λ) is the steady state emission spectrum (85–87). Assuming the various decay components display the same radiative decay rate, the αi(λ) are expected to represent the fractional molecular population of each component. In contrast, the value of fi represents the fractional fluorescence intensities for each decay component.
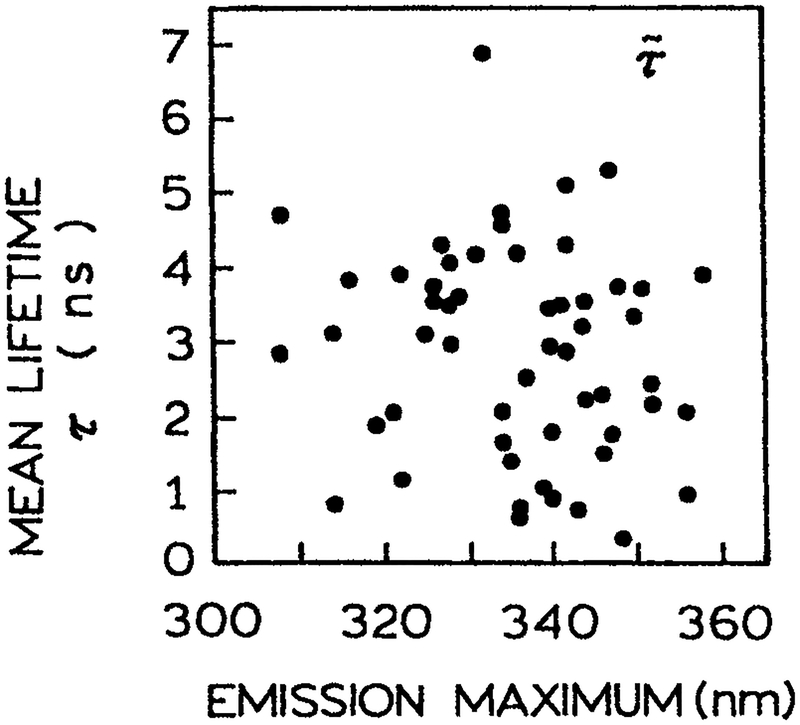
Prior to describing the DAS of STP it is useful to review their known spectral properties. The emission spectra of STP vary greatly, with some spectra being equivalent to that of indole in cyclohexane (87) and others with spectra similar to indole completely exposed to the aqueous phase. Eftink has summarized the emission maxima and mean times of STP (M. R. Eftink, unpublished). This survey yielded the somewhat counterintuitive result that there is no correlation between the emission maxima and the mean lifetime (Fig. 18). Hence for any given trp, or conformation of a trp residue in a given protein, there is no reason to expect any correlation between the decay time, emission maximum and/or the DAS. That is, the DAS associated with the long decay times should appear with equal frequency as the shorter or longer wavelength DAS.
Figure 18.
Relationship of the emission maximum of proteins to the mean lifetime T. Courtesy of Dr. M. R. Eftink, University of Mississippi (M. R. Eftink, unpublished).
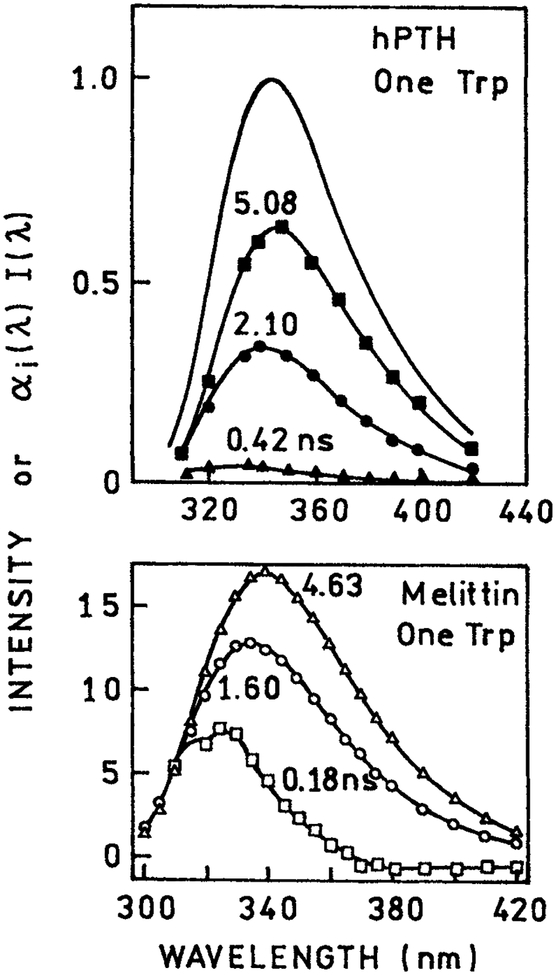
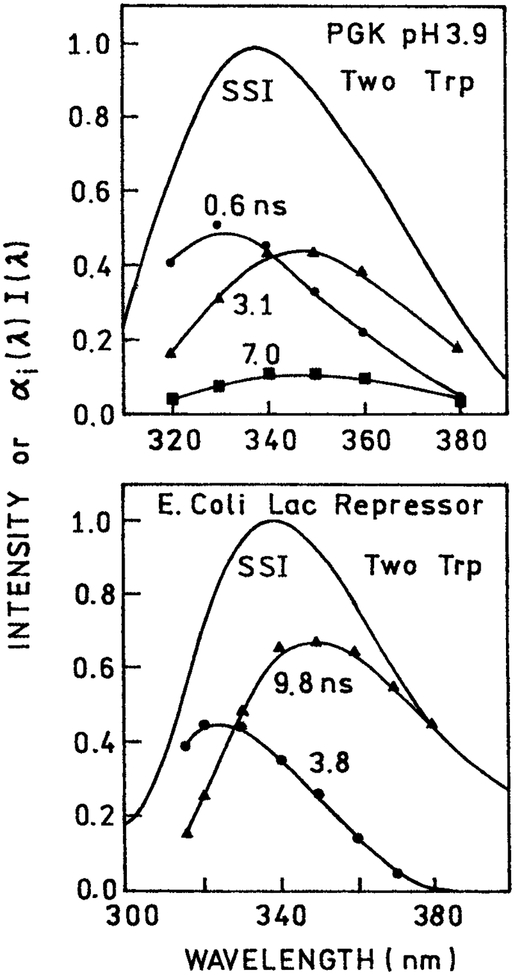
During the previous years the DAS of numerous proteins have been reported (88–96). DAS of STP and multi-trp proteins are shown in Figs. 19 and 20, respectively. Examination of the DAS reveals that the longer wavelength DAS are almost invariably associated with the longer decay times. This correlation suggests that the longer wavelength DAS are in fact the result of spectral relaxation. If the DAS were due to individual trp residues, or different conformations around a single trp, then based on the summary in Fig. 18 one expects that some long lifetime DAS will be at shorter wavelengths. The fact that such viability is not observed suggests the dominant role of spectral relaxation in determining the apparent DAS of proteins.
Figure 19.
Decay associated emission spectra of human parathyroid hormone (88) and melittin in methanol (37), each of which contains a single trp residue. Reprinted with permission from Kluwer Academic/Plenum Publishers and American Chemical Society.
Figure 20.
DAS of 3-phosphoglycerate kinase (96) and the lac repressor from Escherichia coli (93), each of which contains two trp residues.
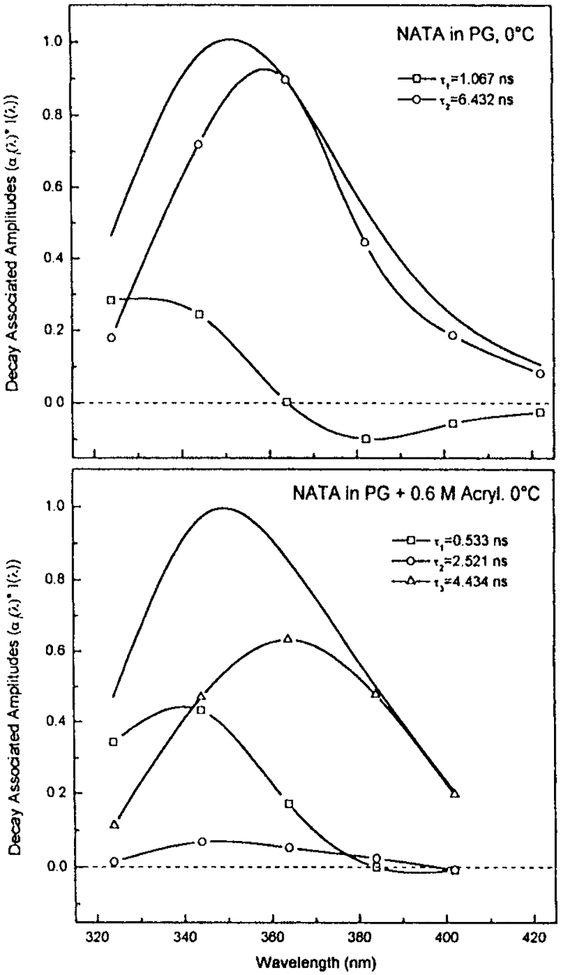
It is important to notice that DAS can be found for STP (Fig. 19). This is not expected for a single trp residue in a unique environment because NATA displays a single emission spectrum and decay time. It is also important to notice that the DAS of the STP are visually similar to the DAS found for NATA undergoing spectral relaxation (69). Figure 21 shows the DAS for NATA in propylene glycol at 0°C. These DAS were calculated from the wavelength-dependent intensity decays (unpublished). In the absence of collisional quenchers the DAS show negative preexponential factors. Hence such factors can be expected under favorable conditions. Addition of collisional quenchers results in DAS that are all positive and resemble the DAS observed for proteins. This solution of NATA in a viscous solvent with nearby quenchers can be regarded as comparable to a trp residue in proteins with a nearby quenching group. These figures show how apparent DAS are easily observed even under conditions where discrete emitting species are not present. Given such results it is not realistic to conclude that the calculation of DAS proves that a protein exists in multiple conformations, and that these conformations always have longer emission maxima associated with the longer lifetime. The dominance of longer wavelength DAS with longer decay times for STP suggest that time-dependent spectral relaxation contributes significantly to the recovered DAS.
Figure 21.
DAS of NATA in propylene glycol at 0°C. The solid lines without symbols are the steady state emission spectra. (J. R. Lakowicz et al., unpublished).
DAS have also been calculated for multi-trp proteins. Examples are shown in Fig. 20. In the case of the lac repressor the two DAS may be reasonably assigned to each of the two trp residues. In the case of phosphoglycerate kinase three DAS were recovered even though the protein contains only two trp residues. Once again one notices the usual trend that the DAS associated with longer wavelengths are those that display longer decay times. Since there does not appear to be any correlation between the trp emission maxima and decay times, there is no reason to expect the longer wavelength DAS to display longer lifetimes. These results suggest that spectral relaxation plays a role in the DAS recovered from both single and multi-trp proteins.
In the calculation and interpretation of protein DAS it is important to remember that the results are limited by the time resolution and signal-to-noise ratio of the data. Most analyses of protein intensity decays report decay times near 0.3, 1.0 and 3 ns. The decay times are typically spaced by an overall factor of 10, which appears to be the resolution limit of TD and FD measurements (13). These typical decay times seem to represent the resolution limit of the measurements rather than the actual form of a more complex nonexponential decay. A set of wavelength-dependent data is usually analyzed with the assumption that the decay times are independent of emission wavelength. This assumption results in DAS whether or not they are displayed by the protein. Typically, a set of wavelength-dependent decays can be analyzed equally well assuming the lifetimes depend on wavelength (τi[λ]). In this case the DAS would not be considered to represent any particular conformation of the trp residues or any discrete decay component. Hence, the DAS are only apparent spectra that are the result of assumptions used in the data analysis and the time resolution of the instrument. In this author’s opinion, these assumptions have often been forgotten, resulting in the overinterpretation of the DAS.
Time-dependent centers-of-gravity
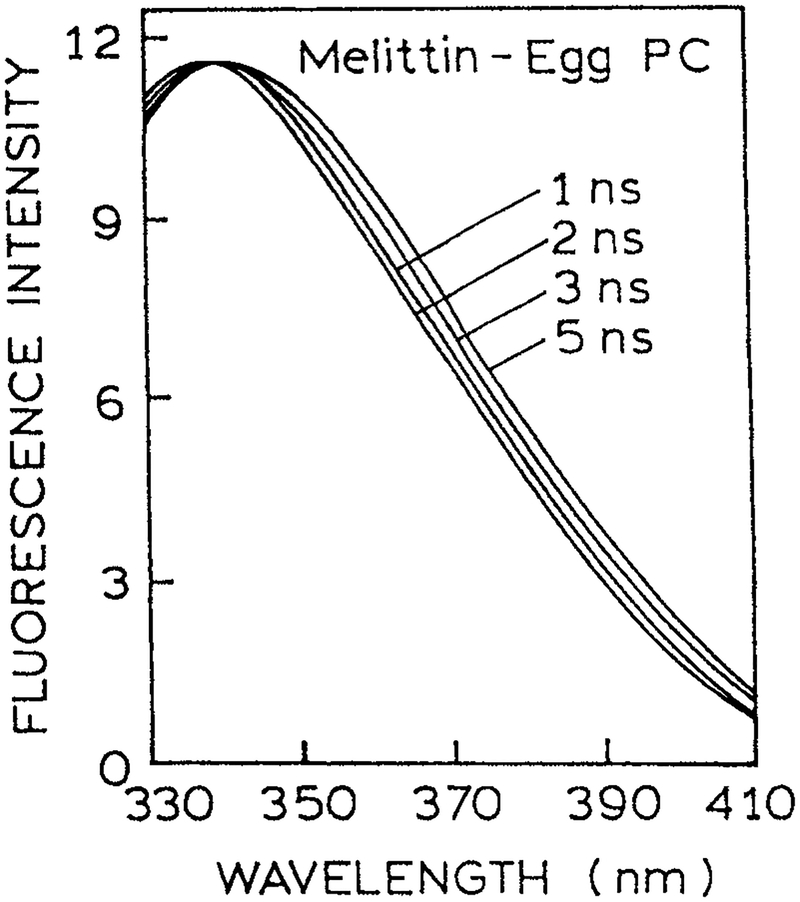
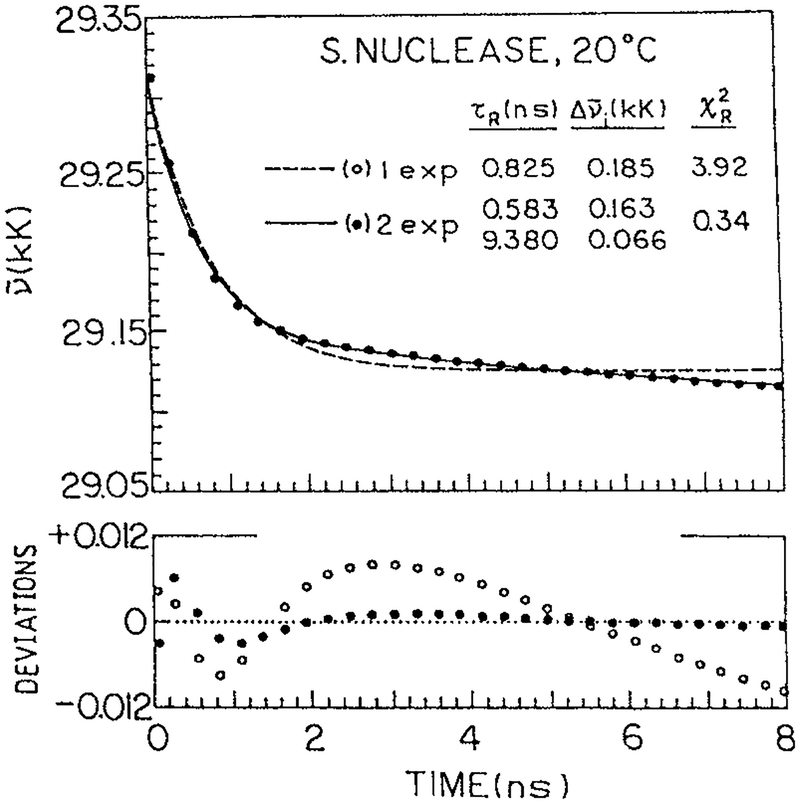
Spectral relaxation is expected to result in time-dependent shifts in the emission center-of-gravity (Eq. 3). Relatively few reports of the of trp in proteins have appeared (97–100). TRES of melittin bound to egg PC vesicles are shown in Fig. 22 (100). One notices that the emission spectra shift to longer wavelengths at longer times. Similarly, time-resolved emission center-of-gravity for S. Nuclease are shown in Fig. 23. The values of are seen to decay by a complex but rapid decay law, comparable in speed to those found for labeled proteins (Figs. 5 and 7). Such time-dependent shifts to longer wavelengths have been observed for about five STP (unpublished). In general, the resolution of complex decays is made easier when the lifetimes is reduced by collisional quenching, which is consistent with the relaxation being mostly complete within the first 0.5 ns.
Figure 22.
TRES for melittin bound to egg PC vesicles. Similar results were found for melittin tetramer. Revised from Georghiou et al. (100).
Figure 23.
Emission center-of-gravity of S. nuclease. (J. R. Lakowicz et al., unpublished).
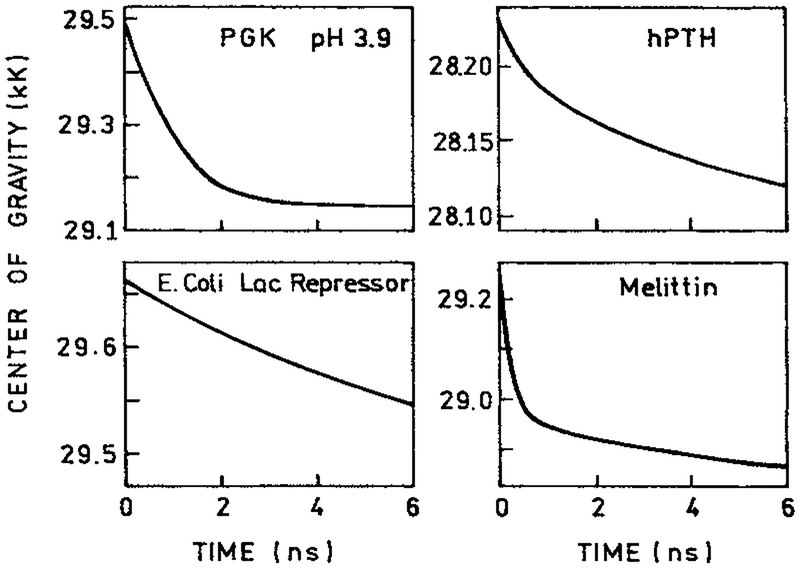
While the number of reports of protein values is small, the number could have in fact been much larger. Any set of data used to calculate the DAS can also be used to calculate the values of . Since the longer components are at longer wavelengths, the values would shift to longer wavelengths at longer times. In fact, we used the DAS for the proteins shown in Figs. 19 and 20, to calculate the values of (Fig. 24). As predicted, these all shift to longer wavelengths with time, on a timescale consistent with that expected for spectral relaxation. The slowest decay of was found for the lac repressor, which is probably the result of the DAS shown in Fig. 20, mostly due to the two trp residues. Hence, most reported DAS are equally consistent with spectral relaxation as with multiple emitting species.
Figure 24.
Time-resolved center-of-gravity for the protein shown in Figs. 19 and 20.
Collisional quenching and apparent DAS
It is important to recognize that DAS can have their origin in collisional quenching. It is well known that collisional quenching results in nonexponential intensity decays (101–105). These nonexponential decays result from transient effects in the quenching process. This effect is due to the rapid quenching of closely spaced fluorophore–quencher pairs followed by slower diffusion-controlled quenching of the remaining excited state populations. Because of the limited resolvability of complex decays available from all instruments, these nonexponential intensity decays can be equally well fit to the multiexponential decay law. As described above, the mean decay time for a fluorophore increases with wavelength in the presence of spectral relaxation. Since the extent of quenching is proportional to the excited state lifetime, there is usually more quenching in the red side of the emission spectrum than on the blue side. These two factors result in the ability to recover DAS for any fluorophore in the presence of collisional quenching.
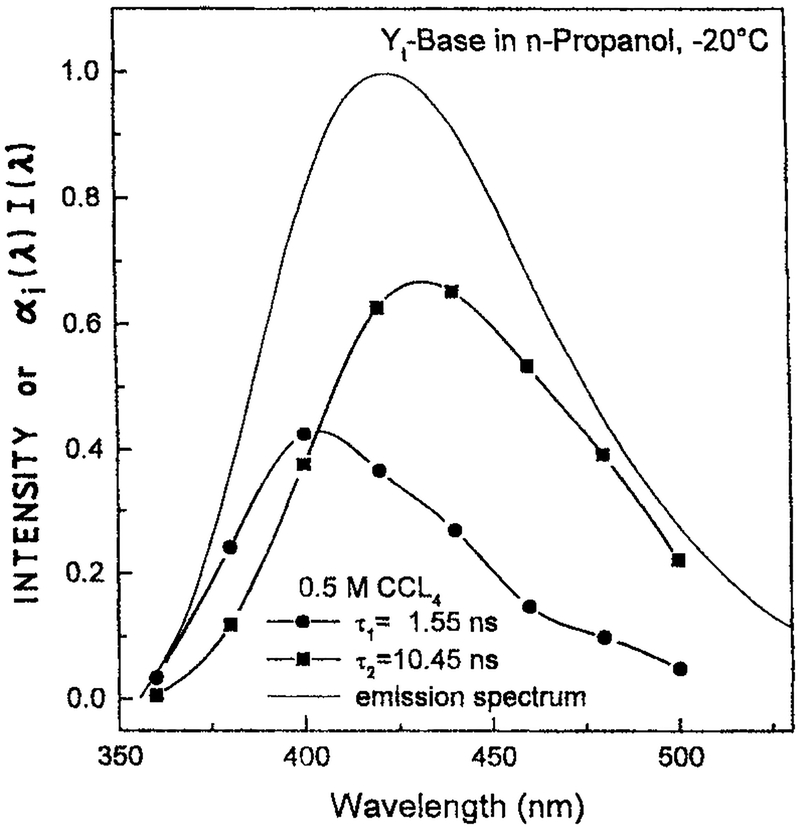
The ability of collisional quenching to result in apparent DAS is demonstrated in Figs. 21 and 25. Yt-base was quenched by CCl4 and NATA was quenched by acrylamide. We measured the multiexponential intensity decays of Yt-base and NATA across their emission spectra in the presence of quenching. The αi values recovered from the lifetime (τi) global analysis were used to construct the DAS. For both fluorophores we found shorter decay time DAS at shorter emission wavelengths (Figs. 21 and 25). In this case there are no distinct populations corresponding to each decay time. The decay times are apparent values resulting from fitting a nonexponential decay to the multiexponential model. The DAS are only apparent spectra with little molecular significance. Clearly it would not be appropriate to assign the DAS in Figs. 21 and 25 to describe species with unique decay times.
Figure 25.
Apparent DAS for Yt-base quenched by CCl4 (78).
What is the relevance of quenching-induced DAS to protein fluorescence? It is known that transient effects in quenching occur in proteins (106,107). In fact, the transient effects are larger in more viscous solvents whose viscosity is probably comparable to the interior of proteins. Quenching of protein fluorescence is often used to determine the fractional accessibility of the trp residues to the aqueous phase, or to resolve the emission spectra of the various components of the emission. Additionally, it is known that trp residues in proteins are often quenched by nearby amino acid residues such as histidine, carboxy or phenyl residues (108–111). Since the proteins are dynamic structures, these quenching interactions may also show transient effects. Hence, the DAS recovered for proteins can be the result of quenching by external or intrinsic quenchers.
Red-edge effects
One final piece of evidence for spectral relaxation in proteins is from the red edge effects. For polar fluorophores in polar viscous solvents the emission spectra shift to longer wavelengths with longer wavelength excitation (112–122). This effect is due to excitation of fluorophores that are interacting most strongly with the solvent when using excitation on the red side of the absorption. Basically, with red-edge excitation one is selecting a population of fluorophores that have interactions with the solvent comparable to the excited state interactions. Red-edge shifts are not observed in nonpolar solvents where such prerelaxed populations do not exist. Also, red-edge shifts are only observed under conditions in which the solvent relaxation time is comparable to or slower than the mean decay time. If the solvent is more fluid, then the excited state population is randomized prior to emission, and no spectral shifts are observed.
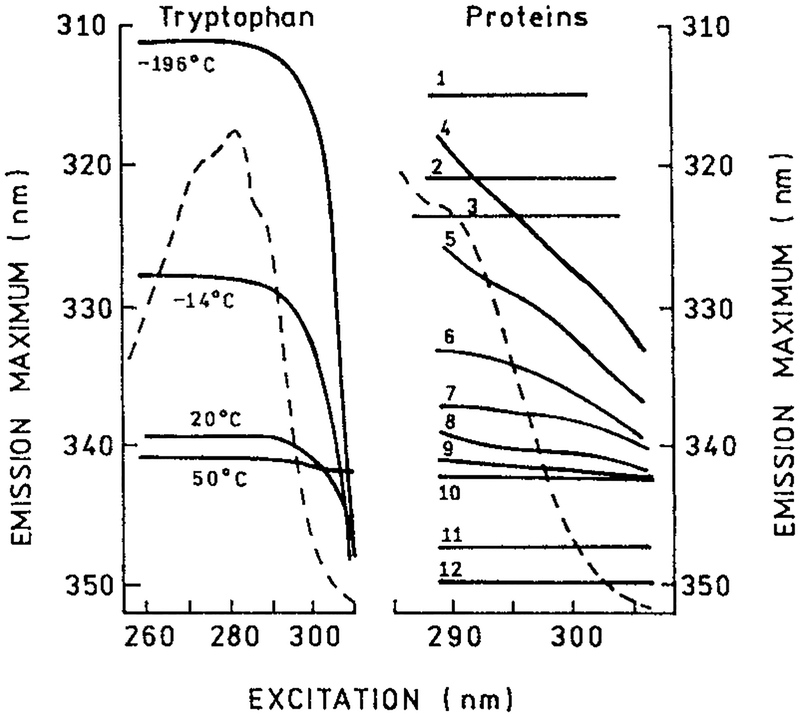
The application of these concepts to protein spectral relaxation is shown in Fig. 26. For trp red-edge shifts are only seen below 20°C in glycerol (left). Hence, one can use the red-edge shift as a measure of the dynamics of the environment surrounding trp residues. Red-edge shifts for a number of STP are also shown in Fig. 26 (right). If the trp residue is in a completely nonpolar environment, as for whiting parvalbumin and ribonuclease T1, there is no red-edge shift and no information on dynamics. For most of the other proteins there is a significant red-edge shift, the most dramatic being seen for human serum albumin. As the residues become completely exposed to the solvent, the red-edge shifts disappear, as for the melittin monomer. In this case the local dynamics are faster than the mean decay time. An overall conclusion from Fig. 26 is that spectral relaxation is comparable to the decay time in about half of the proteins. Once again this result indicates that spectral relaxation should be considered in any analysis of protein DAS.
Figure 26.
The dependence of the position of the fluorescence spectrum maximum on excitation wavelength for trp in a model medium (glycerol) at different temperatures (left) and STP (right). 1, Whiting paravalbumin, pH 6.5 in the presence of Ca2+ ions; 2, ribonuclease T1, pH 6.5; 3, ribonuclease C2, pH 6.5; 4, human serum albumin, pH 7.0, +10−4 M sodium dodecyl sulfate; 5, human serum albumin, pH 3.2; 6, melittin, pH 7.5, +0.15 M NaCl; 7, protease inhibitor ITAJ from Actinomyces janthinus, pH 2.9; 8, human serum albumin, pH 7.0; 9, β-casein, pH 7.5; 10, protease inhibitor IT-AJ, pH 7.0; 11, basic myelin protein, pH 7.0; 12, melittin in water. The dashed line is the absorption spectrum of trp. From Itoh and Azumi (117), reprinted with permission from Kluwer Academic/Plenum Publishers.
DISCUSSION
DAS of genetically engineered proteins
The preceding sections were strongly worded to emphasize the important role of spectral relaxation in proteins, and to indicate the possibility of overinterpretation of the DAS when spectral relaxation is ignored. However, it is important to acknowledge and recognize the number of elegant studies in which the decay components have reliably been assigned to individual trp residues (123–125). Such results are typically obtained for two or three trp proteins in which the individual residues have been removed by site-directed mutagenesis, followed by expression of the single trp mutant proteins. In such cases one can determine the spectral properties of residues and occasionally observe interactions between the residues and/or neighboring groups by RET or quenching.
Site-directed mutagenesis has provided important insights into the relationship of protein structure and the spectral properties of the trp residues. These studies have provided definitive evidence of quenching by nearby protonated imidazole, carboxyl and amino groups, phenyl groups and disulfide bonds (108–111). It is valuable to use these known interactions for understanding the structure and dynamics of individual proteins. In fact, these insights have increased the power and information content of the fluorescent data. The presently available information on the effects of environment on trp fluorescence, and the susceptibility of trp to quenching interactions, allows reliable use of protein fluorescence to learn about proteins.
Protein fluorescence is not particle physics
In some fields of science, observation of a single exception to the theory results in invalidation of the theory and to a search for improved models. This principle does not apply to protein fluorescence. There is little doubt that exceptions to the general thesis of this article will be found, i.e. longer lifetimes at shorter wavelengths or longer lifetime DAS at shorter wavelengths. In fact, there are a few reports on shorter wavelength DAS for longer decay times (126,127). Observations of such exceptional proteins will remain just that, exceptions. The evidence from a large number of proteins is strong evidence for the important role of spectral relaxation in proteins. Interpretation of the time-resolved data should start with consideration that the observed properties could be the result of spectral relaxation. Failure to do so can result in the creation of models, typically containing discrete conformations, which have not been demonstrated by the data.
Table 3.
Intensity decays of 2, 6-TNS in propylene glycol*
| λobs (nm) | α1 | τ1 (ns) | α2 | τ2 (ns) |
|---|---|---|---|---|
| 20°C | ||||
| 400 | 0.75 | 0.42 | 0.25 | 7.90 |
| 440 | 0.48 | 0.42 | 0.52 | 7.90 |
| 480 | 0.10 | 0.42 | 0.90 | 7.90 |
| −30°C | ||||
| 400 | 0.90 | 2.95 | 0.10 | 11.10 |
| 440 | 0.22 | 2.95 | 0.78 | 11.10 |
| 480 | −0.32 | 2.95 | 0.68 | 11.10 |
| −60°C | ||||
| 380 | 0.84 | 3.60 | 0.16 | 10.07 |
| 420 | 0.30 | 3.60 | 0.70 | 10.07 |
| 460 | 0.00 | — | 1.00 | 10.07 |
From I. Gryczynski and J. Lakowicz, unpublished observations.
Acknowledgements—
This work was supported by the NIH, National Center for Research Resources, RR-08119. The author also acknowledges prior support from the NIH and the NSF, under which many of these concepts were developed. Special thanks is given to Dr. Kazik Nowaczyk and Dr. Ignacy Gryczynski for calculation of the DAS and emission centers-of-gravity.
Footnotes
Editor’s Note: An earlier version of this Invited Review was submitted on 2 September 1999. That file was closed as a result of loss in transit of the revised manuscript.
Posted on the website on 3 August 2000.
Dedicated to Professor Ludwig Brand on the occasion of winning the Jabloński Award and for his lifelong achievements in biochemical fluorescence.
Abbreviations: ANS, I-anilino-8-naphthalene sulfonic acid; BSA, bovine serum albumin; DANCA, 2′-(N,N-dimethylamino)-6-naphthoyl-4-trans-cyclohexanoic acid; DAS, decay associated spectra; FD, frequency-domain; FWHM, full-width at half maximum; NATA, N-acetyl-l-tryptophanamide; Prodan, 6-propionyl-2-(dimethylamino) naphthalene; RET, resonance energy transfer; STP, single tryptophan protein; TD, time-domain; TNS, 1-toluidinyl-8-naphthalene sulfonic acid, or its isomers such as 2,6-TNS; 2,6-TNS, 2-p-toluidinylnaphthalene-6-sulfonic acid; TRES, time-resolved emission spectra; trp, l-tryptophan; Yt, 4,9-dihydro-4,6-dimethyl-9-oxy-1H-imidazo-1,2α-purine.
REFERENCES
- 1.Demchenko AP (1981) Ultraviolet Spectroscopy of Proteins Springer, New York. [Google Scholar]
- 2.Permyakov EA (1993) Luminescent Spectroscopy of Proteins CRC Press, Boca Raton. [Google Scholar]
- 3.Weinryb I and Steiner RF (1971) The luminescence of the aromatic amino acids In Excited States of Proteins and Nucleic Acids (Edited by Steiner RF and Weinryb I), pp. 277–318. Plenum Press, New York. [Google Scholar]
- 4.Konev SV (1967) Fluorescence and Phosphorescence of Proteins and Nucleic Acids Plenum Press, New York. [Google Scholar]
- 5.Longworth JW (1983) Intrinsic fluorescence in proteins In Time-Resolved Fluorescence Spectroscopy in Biochemistry and Biology (Edited by Cundall RB and Dale RE), pp. 651–778. Plenum Press, New York. [Google Scholar]
- 6.Beechem JM and Brand L (1985) Time-resolved fluorescence of proteins. Ann. Rev. Biochem 54, 43–71. [DOI] [PubMed] [Google Scholar]
- 7.Rayner DM and Szabo AG (1977) Time resolved fluorescence of aqueous tryptophan. Can. J. Chem 56, 743–745. [Google Scholar]
- 8.Szabo AG and Rayner DM (1980) Fluorescence decay of tryptophan conformers in aqueous solution. J. Am. Chem. Soc 102, 554–563. [Google Scholar]
- 9.Petrich JW, Chang MC, McDonald DB and Fleming GR (1983) On the origin of nonexponential fluorescence decay in tryptophan and its derivatives. J. Am. Chem. Soc 105, 3824–3832. [Google Scholar]
- 10.Robbins RJ, Fleming GR, Beddard GS, Robinson GW, Thistlethwaite PJ and Woolfe GJ (1980) Photophysics of aqueous tryptophan: pH and temperature effects. J. Am. Chem. Soc 102, 6271–6280. [Google Scholar]
- 11.Eftink MR, Jia Y, Hu D and Ghiron CA (1995) Fluorescence studies with tryptophan analogues: excited state interactions involving the side chain amino group. J. Phys. Chem 99, 5713–5723. [Google Scholar]
- 12.Chen RF, Knutson JR, Ziffer H and Porter D (1991) Fluorescence of tryptophan dipeptides: correlations with the rotamer model. Biochemistry 30, 5184–5195. [DOI] [PubMed] [Google Scholar]
- 13.Lakowicz JR (1999) Principles of Fluorescence Spectroscopy, 2nd Ed. Kluwer Academic/Plenum Publishers, New York. [Google Scholar]
- 14.Jameson DM and Weber G (1981) Resolution of the pH-dependent heterogeneous fluorescence decay of tryptophan by phase and modulation measurements. J. Phys. Chem 85, 953–958. [Google Scholar]
- 15.Döring K, Konermann L, Surrey T and Jähnig F (1995) A long lifetime component in the tryptophan fluorescence of some proteins. Eur. Biophys. J 23, 423–432. [DOI] [PubMed] [Google Scholar]
- 16.Shizuka H, Serizawa M, Shimo T, Saito I and Matsuura T (1988) Fluorescence quenching mechanism of tryptophan. Remarkably efficient internal proton-induced quenching and charge-transfer quenching. J. Am. Chem. Soc 110, 1930–1934. [Google Scholar]
- 17.Gudgin E, Lopez-Delgado R and Ware WR (1981) The tryptophan fluorescence lifetime puzzle. A study of decay times in aqueous solution as a function of pH and buffer composition. Can. J. Chem 59, 1037–1044. [Google Scholar]
- 18.Bakhshiev NG, Mazurenko Yu. T. and Piterskaya IV (1966) Luminescence decay in different portions of the luminescence spectrum of molecules in viscous solution. Opt. Spectrosc 21, 307–309. [Google Scholar]
- 19.Veselova TV, Limareva LA, Cherkasov AS and Shirokov VI (1965) Fluorometric study of the effect of solvent on the fluorescence spectrum of 3-amino-N-methylphthalimide. Opt. Spectrosc 19, 39–43. [Google Scholar]
- 20.Veselova TV and Shirokov VI (1967) Fluorometric study of the mechanism of temperature variations in the fluorescence spectrum of 3-aminophthalimide solutions in frozen dioxane. Opt. Spectrosc 6, 540–541. [Google Scholar]
- 21.Lakowicz JR and Cherek H (1980) Nanosecond dipolar relaxation in proteins observed by wavelength-resolved lifetimes of tryptophan fluorescence. J. Biol. Chem 255, 831–834. [PubMed] [Google Scholar]
- 22.Grinvald A and Steinberg IZ (1976) The fluorescence decay of tryptophan residues in native and denatured proteins. Biochim. Biophys. Acta 427, 663–678. [DOI] [PubMed] [Google Scholar]
- 23.Lakowicz JR and Weber G (1973) Quenching of fluorescence by oxygen—a probe for structural fluctuations in macromolecules. Biochemistry 12, 4161–4170. [DOI] [PMC free article] [PubMed] [Google Scholar]
- 24.Lakowicz JR and Weber G (1973) Quenching of protein fluorescence by oxygen. Detection of structural fluctuations in proteins on the nanosecond timescale. Biochemistry 12, 4171–4179. [DOI] [PMC free article] [PubMed] [Google Scholar]
- 25.Lehrer SS (1971) Solute perturbation of protein fluorescence. The quenching of the tryptophan fluorescence of model compounds and of lysozyme by iodide ion. Biochemistry 10, 3254–3263. [DOI] [PubMed] [Google Scholar]
- 26.Wasylewski Z, Kaszycki P and Drwiega M (1996) A fluorescence study of Tn10-encoded tet repressor. J. Protein Chem 15, 45–52. [DOI] [PubMed] [Google Scholar]
- 27.Wasylewski Z, Koloczek H and Wasniowska A (1988) Fluorescence quenching resolved spectroscopy of proteins. Eur. J. Biochem 172, 719–724. [DOI] [PubMed] [Google Scholar]
- 28.Eftink MR (1991) Fluorescence quenching: theory and applications In Topics in Fluorescence Spectroscopy, Principles, Vol. 2 (Edited by Lakowicz JR), pp. 53–126. Plenum Press, New York. [Google Scholar]
- 29.Calhoun DB, Vanderkooi JM, Woodrow GV and Englander SW (1983) Penetration of dioxygen into proteins studied by quenching of phosphorescence and fluorescence. Biochemistry 22, 1526–1532. [DOI] [PubMed] [Google Scholar]
- 30.Calhoun DB, Vanderkooi JM and Englander SW (1983) Penetration of small molecules into proteins studied by quenching of phosphorescence and fluorescence. Biochemistry 22, 1533–1539. [DOI] [PubMed] [Google Scholar]
- 31.Weber G and Lakowicz JR (1973) Subnanosecond solvent relaxation studies by oxygen quenching of fluorescence. Chem. Phys. Lett 22(2), 419–423. [Google Scholar]
- 32.Anufrieva EV, Vol’kenshtein MV and Samokish VA (1970) Spectral fluorescent investigation of the intramolecular mobility of macromolecules in solutions. Dokl. Biophys. (Eng. Trans.) 195, 159–161. [PubMed] [Google Scholar]
- 33.Bakhshiev NG (1972) Some special features of the appearance of orientational dipole relaxation processes in the luminescence and generation spectra of solutions. Opt. Spectrosc 32, 525–526. [Google Scholar]
- 34.Mazurenko YT and Bakhshiev NG (1970) Effect of orientation dipole relaxation on spectral, time, and polarization characteristics of the luminescence of solutions. Opt. Spectrosc 26, 490–494. [Google Scholar]
- 35.Gafni A and Brand L (1978) Excited state proton transfer reactions of acridine studied by nanosecond fluorometry. Chem. Phys. Lett 58, 346–350. [Google Scholar]
- 36.Grinvald A and Steinberg IZ (1974) Fast relaxation process in a protein revealed by the decay kinetics of tryptophan fluorescence. Biochemistry 25(13), 5170–5178. [DOI] [PubMed] [Google Scholar]
- 37.Ladokhin AS (1999) Red-edge excitation study of nonexponential fluorescence decay of indole in solution and in a protein. J. Fluoresc 9, 1–9. [Google Scholar]
- 38.Brand L and Gohlke JR (1971) Nanosecond time-resolved fluorescence spectra of a protein–dye complex. J. Biol. Chem 246, 2317–2324. [PubMed] [Google Scholar]
- 39.Gafni A, De Toma RP, Manrow RE and Brand L (1977) Nanosecond decay studies of a fluorescence probe bound to apomyoglobin. Biophys. J 17, 155–168. [DOI] [PMC free article] [PubMed] [Google Scholar]
- 40.Stryer L (1965) The interactions of a naphthalene dye with apomyoglobin and apohemoglobin. A fluorescent probe of nonpolar binding sites. J. Mol. Biol 13, 482–495. [DOI] [PubMed] [Google Scholar]
- 41.Lakowicz JR and Cherek H (1981) Proof of nanosecond timescale relaxation in apomyoglobin by phase fluorometry. Biochem. Biophys. Res. Commun 99, 1173–1178. [DOI] [PubMed] [Google Scholar]
- 42.Slavik J (1982) Anilinonaphthalene sulfonate as a probe of membrane composition and function. Biochim. Biophys. Acta 694, 1–25. [DOI] [PubMed] [Google Scholar]
- 43.Dodiuk H and Kosower EM (1977) Multiple fluorescences.4. The protonated form of N-alkyl-2-N-arylamino-6-naphthalenesulfonates. J. Am. Chem. Soc 93, 859–865. [Google Scholar]
- 44.Spencer RD and Weber G (1969) Measurements of subnanosecond fluorescence lifetimes with a cross-correlation phase fluorometer. Ann. N. Y. Acad. Sci 158, 361–376. [Google Scholar]
- 45.Veselova TV, Limareva LA, Cherkasov AS and Shiorkov VI (1965) Fluorometric study of the effect of solvent on the fluorescence spectrum of 3-amino-N-methylphthalimide. Opt. Spectrosc 19, 39–43. [Google Scholar]
- 46.Lakowicz JR, Cherek H and Bevan DR (1980) Demonstration of nanosecond dipolar relaxation in biopolymers by inversion of apparent fluorescence phase shift and demodulation lifetimes. J. Biol. Chem 255, 4403–4406. [PubMed] [Google Scholar]
- 47.Lakowicz JR and Balter A (1982) Theory of phase-modulation fluorescence spectroscopy for excited state processes. Biophys. Chem 16, 99–115. [DOI] [PMC free article] [PubMed] [Google Scholar]
- 48.O’Connor DV and Phillips D (1984) Time-Correlated Single Photon Counting Academic Press, New York. [Google Scholar]
- 49.Demas JN (1983) Excited State Lifetime Measurements Academic Press, New York. [Google Scholar]
- 50.Birch DJS and Imhof RE (1991) Time-domain fluorescence spectroscopy using time-correlated single-photon counting In Topics in Fluorescence Spectroscopy, Vol. 1: Techniques (Edited by Lakowicz JR), pp. 1–95. Plenum Press, New York. [Google Scholar]
- 51.Cundall RB and Dale RE (Editors) (1983) Time-Resolved Fluorescence Spectroscopy in Biochemistry and Biology Plenum Press, New York. [Google Scholar]
- 52.Gratton E and Limkeman M (1983) A continuously variable frequency cross-correlation phase fluorometer with picosecond resolution. Biophys. J 44, 315–324. [DOI] [PMC free article] [PubMed] [Google Scholar]
- 53.Gratton E and Lopez-Delgado R (1980) Measuring fluorescence decay times by phase-shift and modulation using the high harmonic content of pulsed light sources. Nuovo Cimento B 56, 110–124. [Google Scholar]
- 54.Lakowicz JR and Gryczynski I (1991) Frequency-domain fluorescence spectroscopy In Topics in Fluorescence Spectroscopy, Vol. 1: Techniques (Edited by Lakowicz JR), pp. 293–355. Plenum Press, New York. [Google Scholar]
- 55.Lakowicz JR and Maliwal BP (1985) Construction and performance of a variable-frequency phase-modulation fluorometer. Biophys. Chem 21, 61–78. [DOI] [PubMed] [Google Scholar]
- 56.Laczko G, Lakowicz JR, Gryczynski I, Gryczynski Z and Malak H (1990) A 10 GHz frequency-domain fluorometer. Rev. Sci. Instrum 61, 2331–2337. [Google Scholar]
- 57.Pierce DW and Boxer SG (1992) Dielectric relaxation in a protein matrix. J. Phys. Chem 96, 5560–5566. [Google Scholar]
- 58.Lakowicz JR, Gratton E, Cherek H, Maliwal BP and Laczko G (1984) Determination of time-resolved fluorescence emission spectra and anisotropies of a fluorophore–protein complex using frequency-domain phase-modulation fluorometry. J. Biol. Chem 259(17), 10 967–10 972. [PubMed] [Google Scholar]
- 59.Weber G and Farris FJ (1979) Synthesis and spectral properties of a hydrophobic fluorescent probe: 6-propionyl-2-(dimethylamino)naphthalene. Biochemistry 18, 3075–3078. [DOI] [PubMed] [Google Scholar]
- 60.Viard M, Gallay J, Vincent M, Meyer O, Robert B and Paternostre M (1997) Laurdan solvatochromism: solvent dielectric relaxation and intramolecular excited-state reaction. Biophys. J 73, 2221–2234. [DOI] [PMC free article] [PubMed] [Google Scholar]
- 61.Von Lippert E (1957) Spektroskopische bistimmung des dipolmomentes aromatischer verbindungen im ersten angeregten singulettzustand. Z. Electrochem 61, 962–975. [Google Scholar]
- 62.Mataga N, Kaifu Y and Koizumi M (1956) Solvent effects upon fluorescence spectra and the dipole moments of excited molecules. Bull. Chem. Soc. Jpn 29, 465–470. [Google Scholar]
- 63.Easter JH, De Toma RP and Brand L (1976) Nanosecond time-resolved emission spectroscopy of a fluorescence probe adsorbed to l-α-egg lecithin vesicles. Biophys. J 16, 571–583. [DOI] [PMC free article] [PubMed] [Google Scholar]
- 64.Badea MG and Brand L (1979) Time-resolved fluorescence measurements. Methods Enzymol 61, 378–425. [DOI] [PubMed] [Google Scholar]
- 65.Lakowicz JR, Cherek H, Laczko G and Gratton E (1984) Time-resolved fluorescence emission spectra of labeled phospholipid vesicles, as observed using frequency-domain fluorometry. Biochem. Biophys. Acta 777, 183–193. [Google Scholar]
- 66.Cross AJ and Fleming GR (1986) Influence of inhibitor binding of the internal motions of lysozyme. Biophys. J 50, 507–512. [DOI] [PMC free article] [PubMed] [Google Scholar]
- 67.McCammon JA, Wolynes PG and Karplus M (1979) Picosecond dynamics of tyrosine side chains in proteins. Biochemistry 18, 927–942. [DOI] [PubMed] [Google Scholar]
- 68.Ichiye T and Karplus M (1983) Fluorescence depolarization of tryptophan residues in proteins: a molecular dynamics study. Biochemistry 22, 2884–2894. [DOI] [PubMed] [Google Scholar]
- 69.Vekshin N, Vincent M and Gallay J (1992) Excited-state lifetime distributions of tryptophan fluorescence in polar solutions. Evidence for solvent exciplex formation. Chem. Phys. Lett 199(5), 459–464. [Google Scholar]
- 70.Vincent M, Gallay J and Demchenko AP (1997) Dipolar relaxation around indole as evidenced by fluorescence lifetime distributions and time-dependence spectral shifts. J. Fluoresc 7, 107S–110S. [Google Scholar]
- 71.Castner EW, Fleming GR and Bagchi B (1988) Influence of non-Debye relaxation and of molecular shape on the time-dependence of the Stokes shift in polar media. Chem. Phys. Lett 143(3), 270–276. [Google Scholar]
- 72.Castner EW, Bagehi B, Maroncelli M, Webb SP, Ruggiero AJ and Fleming GR (1988) The dynamics of polar solvation. Ber. Bunsenges Phys. Chem 92, 363–372. [Google Scholar]
- 73.Castner EW, Fleming GR, Bagchi B and Maroncelli M (1988) The dynamics of polar solvation: inhomogeneous dielectric continuum models. J. Chem. Phys 89, 3519–3534. [Google Scholar]
- 74.Bagchi B, Oxtoby DW and Fleming GR (1984) Theory of the time development of the Stokes shift in polar media. Chem. Phys 86, 257–267. [Google Scholar]
- 75.Davidson DW and Cole RH (1951) Dielectric relaxation in glycerol, propylene glycol, and n-propanol. J. Chem. Phys 19(12), 1484–1490. [Google Scholar]
- 76.Fellner-Feldegg H (1969) The measurement of dielectrics in the time domain. J. Phys. Chem 75, 616–623. [Google Scholar]
- 77.Garg SK and Smyth CP (1965) Microwave absorption and molecular structure in lipids. LXII. The three dielectric dispersion regions of the normal primary alcohols. J. Phys. Chem 1294–1301. [Google Scholar]
- 78.Szmacinski H, Gryczynski I and Lakowicz JR (1996) Resolution of multiexponential spectral relaxation of Yt-base by global analysis of collisionally quenched samples. J. Fluoresc 6(3), 177–185. [DOI] [PubMed] [Google Scholar]
- 79.Lakowicz JR and Balter A (1982) Direct recording of the initially excited and the solvent relaxed fluorescence emission spectra of tryptophan by phase sensitive detection of fluorescence. Photochem. Photobiol 36, 125–132. [DOI] [PubMed] [Google Scholar]
- 80.Kahlow MA, Jarzeba W, Kang TJ and Barbara PF (1989) Femtosecond resolved solvation dynamics in polar solvents. J. Chem. Phys 90(1), 151–158 [Google Scholar]
- 81.Harju TO, Huizer AH and Varma CAGO (1995) Nonexponential solvation dynamics of electronically excited 4-aminophthalimide in n-alcohols. Chem. Phys 200, 215–224. [Google Scholar]
- 82.Gorlach E, Gygax H, Lubini P and Wild UP (1995) Solvent relaxation of oxazine-4 in 2-methyltetrahydrofuran. Chem. Phys 194, 185–193. [Google Scholar]
- 83.Castner EW, Maroncelli M and Fleming GR (1987) Sub-picosecond resolution studies of solvation dynamics in polar aprotic and alcohol solvents. J. Chem. Phys 83(3), 1090–1097. [Google Scholar]
- 84.Jarzeba W, Walker GC, Johnson AE, Kahlow MA and Barbara PF (1988) Femtosecond microscopic solvation dynamics of aqueous solutions. J. Phys. Chem 92, 7039–7041. [Google Scholar]
- 85.Knutson JR, Walbridge DG and Brand L (1982) Decay-associated fluorescence spectra and the heterogeneous emission of alcohol dehydrogenase. Biochemistry 21, 4671–4679. [DOI] [PubMed] [Google Scholar]
- 86.Willis KJ, Szabo AG, Drew J, Zuker M and Ridgeway JM (1990) Resolution of heterogeneous fluorescence into component decay-associated excitation spectra. Biophys. J 57, 183–189. [DOI] [PMC free article] [PubMed] [Google Scholar]
- 87.Szabo AG, Stepanik TM, Wayner DM and Young NM (1983) Conformational heterogeneity of the copper binding site in azurin. Biophys. J 41, 233–244. [DOI] [PMC free article] [PubMed] [Google Scholar]
- 88.Willis KJ and Szabo AG (1992) Conformation of parathyroid hormone: time-resolved fluorescence studies. Biochemistry 31, 8924–8931. [DOI] [PubMed] [Google Scholar]
- 89.Green SM, Knutson JR, and Hensley P (1990) Steady-state fluorescence and time-resolved fluorescence monitor changes in tryptophan environment in arginase from Saccharomyces cerevisiae upon removal of catalytic and structural metal ions. Biochemistry 29, 9159–9168. [DOI] [PubMed] [Google Scholar]
- 90.Merrill A, Steer B, Prentice G, Weller M and Szabo A (1997) Identification of a chameleon-like pH-sensitive segment within the colichin E1 channel domain that may serve as the pH-activated trigger for membrane bilayer association. Biochemistry 36, 6874–6884. [DOI] [PubMed] [Google Scholar]
- 91.Kim S, Chowdhury F, Stryjewski W, Youanthan E, Russo P and Barkley M (1993) Time-resolved fluorescence of the single tryptophan of Bacillus stearothermophilus phosphofructokinase. Biophys. J 65, 215–226. [DOI] [PMC free article] [PubMed] [Google Scholar]
- 92.Neyroz P, Menna C, Polverini E and Masotti L (1996) Intrinsic fluorescence properties and structural analysis of p13suc1 from Schizosaccharomyces pombe. J. Biol. Chem 271(44), 27 249–27 258. [DOI] [PubMed] [Google Scholar]
- 93.Brochon JC, Wahl P, Charlier M, Maurizot JC and Helene C (1977) Time resolved spectroscopy of the trytophyl fluorescence of the E. coli lac repressor. Biochem. Biophys. Res. Commun 79, 1261–1271. [DOI] [PubMed] [Google Scholar]
- 94.Alberti P, Bombarda E, Kintrup M, Hillen W, Lami H, Piemont E, Doglia SM and Chabbert M (1997) Structural investigation of tet repressor loop 154–167: a time-resolved fluorescence study of three single trp mutants. Arch. Biochem. Biophys 346(2), 230–240. [DOI] [PubMed] [Google Scholar]
- 95.Hof M, Fleming G and Fidler V (1996) Time-resolved fluorescence study of a calcium-induced conformational change in prothrombin fragment 1. Proteins: Struct. Func. Genet 24, 485–494. [DOI] [PubMed] [Google Scholar]
- 96.Privat J-P, Wahl P, Auchet J-C and Pain RH (1980) Time-resolved spectroscopy of tryptophyl fluorescence of yeast 3-phosphoglycerate kinase. Biophys. Chem 11, 239–248. [DOI] [PubMed] [Google Scholar]
- 97.Szmacinski H, Lakowicz JR and Johnson M (1988) Time-resolved emission spectra of tryptophan and proteins from frequency-domain fluorescence spectroscopy. SPIE Proc 909, 293–298. [Google Scholar]
- 98.Vincent M, Gallay J and Demchenko A (1995) Solvent relaxation around the excited state of indole: analysis of fluorescence lifetime distributions and time-dependent spectral shifts. J. Phys. Chem 99, 14 931–14 941. [Google Scholar]
- 99.Demchenko AP, Gryczynski I, Gryczynski Z, Wiczk W, Malak H and Fishman M (1993) Intramolecular dynamics in the environment of the single tryptophan residue in staphylococcal nuclease. Biophys. Chem 48, 39–48. [DOI] [PubMed] [Google Scholar]
- 100.Georghiou S, Thompson M and Mukhopadhyay AK (1982) Melittin–phospholipid interaction studied by employing the single tryptophan residue as an intrinsic fluorescent probe. Biochemica 688, 441–452. [DOI] [PubMed] [Google Scholar]
- 101.Nemzek TL and Ware WR (1975) Kinetics of diffusion-controlled reactions: transient effects in fluorescence quenching. J. Chem. Phys 62, 477–489. [Google Scholar]
- 102.Lakowicz JR, Johnson ML, Gryczynski I, Joshi N and Laczko G (1987) Transient effects in fluorescence quenching measured by 2-GHz frequency-domain fluorometry. J. Phys. Chem 91, 3277–3285. [DOI] [PMC free article] [PubMed] [Google Scholar]
- 103.Periasamy N, Doraiswamy S, Venkataraman B and Fleming GR (1988) Diffusion controlled reactions: experimental verification of the time-dependent rate equation. J. Chem. Phys 89, 4799–4806. [Google Scholar]
- 104.Lakowicz JR, Zelent B, Gryczynski I, Kusba J and Johnson ML (1994) Distance-dependent fluorescence quenching of tryptophan by acrylamide. Photochem. Photobiol 60, 205–214. [DOI] [PubMed] [Google Scholar]
- 105.Lakowicz JR, Zelent B, Kusba J and Gryczynski I (1996) Distance-dependent quenching of nile blue fluorescence by N,N-diethylaniline observed by frequency-domain fluorometry. J. Fluoresc 6, 187–194. [DOI] [PubMed] [Google Scholar]
- 106.Eftink MR (1990) Transient effects in the solute quenching of tryptophan residues in proteins. Proc. SPIE 1204, 406–414. [Google Scholar]
- 107.Lakowicz JR, Joshi NB, Johnson ML, Szmacinski H and Gryczynski I (1987) Diffusion coefficients of quenchers in proteins from transient effects in the intensity decays. J. Biol. Chem 262, 10 907–10 910. [PubMed] [Google Scholar]
- 108.Sendak RA, Rothwarf DM, Wedemeyer WJ, Houry WA and Scheraga H (1996) Kinetic and thermodynamic studies of the folding/unfolding of a tryptophan containing mutant of ribonuclease. Biochemistry 35, 12 978–12 992. [DOI] [PubMed] [Google Scholar]
- 109.Sopkova J, Gallay J, Vincent M, Pancoska P and Lewit-Bentley A (1994) The dynamic behavior of annexin V as a function of calcium ion binding: a circular dichroism, UV absorption, and steady state and time-resolved fluorescence study. Biochemistry 33, 4490–4499. [DOI] [PubMed] [Google Scholar]
- 110.Rouviere N, Vincent M, Craescu CT and Gallay J (1997) Immunosuppressant binding to the immunophilin FKBP59 affects the local structural dynamics of a surface β-strand: time-resolved fluorescence study. Biochemistry 36, 7339–7352. [DOI] [PubMed] [Google Scholar]
- 111.Loewenthal R, Sancho J and Fersht AR (1991) Fluorescence spectrum of barnase: contributions of three tryptophan residues and a histidine-related pH dependence. Biochemistry 30, 6775–6779. [DOI] [PubMed] [Google Scholar]
- 112.Rudik KI and Pikulik LG (1971) Effect of the exciting light on the fluorescence spectra of phthalimide solutions. Opt. Spectrosc 30, 147–148. [Google Scholar]
- 113.Rubinov AN and Tomin VI (1970) Bathochromic luminescence in solutions of organic dyes at low temperatures. Opt. Spectrosc 29, 578–580. [Google Scholar]
- 114.Galley WC and Purkey RM (1970) Role of heterogeneity of the solvation site in electronic spectra in solution. Proc. Natl. Acad. Sci. USA 67(3), 1116–1121. [DOI] [PMC free article] [PubMed] [Google Scholar]
- 115.Itoh K and Azumi T (1973) Shift of emission band upon excitation at the long wavelength absorption edge. Chem. Phys. Lett 22(2), 395–399. [Google Scholar]
- 116.Azumi T, Itoh K and Shiraishi H (1976) Shift of emission band upon the excitation at the long wavelength absorption edge. III. Temperature dependence of the shift and correlation with the time dependent spectral shift. J. Chem. Phys 65(7), 2550–2555. [Google Scholar]
- 117.Itoh K and Azumi T (1975) Shift of the emission band upon excitation at the long wavelength absorption edge. II. Importance of the solute–solvent interaction and the solvent reorientation relaxation process. J. Chem. Phys 62(9), 3431–3438. [Google Scholar]
- 118.Kawski A, Ston M and Janic I (1983) On the intensity distribution within photoluminescence bands in rigid and liquid solutions. Z. Naturforsch 38a, 322–324. [Google Scholar]
- 119.Macgregor RB and Weber G (1981) Fluorophores in polar media. Spectral effects of the Langevin distribution of electrostatic interactions. Ann. N. Y. Acad. Sci 366, 140–154. [Google Scholar]
- 120.Demchenko AP and Ladokhin AS (1988) Red-edge excitation fluorescence spectroscopy of indole and tryptophan. Eur. Biophys. J 15, 369–379. [DOI] [PubMed] [Google Scholar]
- 121.Demchenko AP (1988) Red-edge excitation spectroscopy of single-tryptophan proteins. Eur. Biophys. J 16, 121–129. [DOI] [PubMed] [Google Scholar]
- 122.Demchenko AP (1992) Fluorescence and dynamics in proteins, in Topics in Fluorescence Spectroscopy, Vol. 3: Biochemical Applications (Edited by Lakowicz JR), p. 65–111. Plenum Press, New York. [Google Scholar]
- 123.Hansen D, Altschmied L and Hillen W (1987) Engineered tet repressor mutants with single tryptophan residues as fluorescent probes. J. Biol. Chem 29, 14 030–14 035. [PubMed] [Google Scholar]
- 124.Watanabe F, Jameson D and Uyeda K (1996) Enzymatic and fluorescence studies of four single-tryptophan mutants of rat testis fructose 6-phosphate, 2-kinase: fructose 2,6-biphosphatase. Protein Sci 5, 904–913. [DOI] [PMC free article] [PubMed] [Google Scholar]
- 125.Ross JB, Schmidt CJ and Brand L (1981) Time-resolved fluorescence of the two tryptophans in horse liver alcohol dehydrogenase. Biochemistry 20, 4369–4377. [DOI] [PubMed] [Google Scholar]
- 126.She M, Dong WJ, Umeda PK and Cheung HC (1997) Time-resolved fluorescence study of the single tryptophan of engineered skeletal muscle Troponin C. Biophys. J 73, 1042–1055. [DOI] [PMC free article] [PubMed] [Google Scholar]
- 127.Sillen A, Hennecke J, Roethlisberger D, Glockshuber R and Engelborghs Y (1999) Fluorescence quenching in the DsbA protein from Escherichia coli: complete picture of the excited state energy pathway and evidence for the reshuffling dynamics of the microstates of tryptophan. Proteins: Struct. Funct. Genet 37, 253–263. [DOI] [PubMed] [Google Scholar]


