Abstract
Salbutamol (SAL), one of the prohibited veterinary drugs, has been proven to be harmful to animals, but very few studies reported the underlying mechanism of actions and the effects after SAL intake. In this study, Ba-Ma minipigs were used as the animal model to demonstrate the impacts of SAL residues on blood lipid and the lung bronchial structures and the regulation of gene expression and gut microorganism population. The results showed that (1) SAL decreased the indexes of serum lipid and organ, (2) SAL widely retained in various tissues and organs, (3) the lung bronchial expanded under the influence of SAL, (4) the gene expression of growth-related ghrelin has increased, and (5) the residues of SAL affected the composition of gut microorganism population, which could be associated with the mechanism of action of SAL on pig. The findings suggest that SAL could be harmful to minipigs by altering the blood lipid, bronchial morphology, gastric mucosal gene expression, and the gut microorganism population.
Introduction
Salbutamol (SAL) is a short-acting β2-adrenergic receptor agonist, which has one chiral carbon atom in the SAL molecule and two types of enantiomers: (R)-salbutamol and (S)-salbutamol (Figure 1A,B). SAL is widely used to treat most types of bronchial asthma and bronchospasm, with the advantages of good safety, little irritation, and convenience of taking. Its pharmacological activity is exerted by the (R)-salbutamol, while the (S)-salbutamol is pharmacologically inert.1−3 It is unclear, however, whether SAL has any side effects on the lung bronchial morphology. While SAL is useful commercially to improve the animal’s lean meat ratio, the residual amount of SAL remaining in the body is harmful to the animal’s health. To gain great profit, the use of SAL is abused in the farm regardless of laws and regulations. To protect public health, it is important to look into the harmful effects of SAL to the body.
Figure 1.
Chemical structure of (A) (R)-salbutamol and (B) (S)-salbutamol.
A large number of studies on ghrelin gene expression and gut microorganisms highlighted their function on regulating diet and health. Ghrelin is a hormone encoded by the ghrelin gene that plays a role in stimulating gastric acid secretion to increase the appetite.4 According to the reports, SAL can promote the growth of cattle, sheep, and other livestock, but whether the growth-promoting effect is attributed to the alteration of ghrelin gene expression still remains unclear.
The intestinal microorganisms are essential to the host in the regulation of physiological function, and they provide small molecule nutrients, which can be absorbed directly into the blood stream. Studies have shown that certain Gram-negative bacteria in the gut of pigs, such as Klebsiella and Prevolla, can produce leucine, while Bacteroides can produce polysaccharide hydrolases that promote sugar degradation as well as other small molecules such as acetate, propionate, and butyrate for use in metabolism.5,6 Intestinal microorganisms are also associated with the host’s obesity profile. Humans or animals that frequently consume high-fat diet decrease the number of Bifidobacteria in the gut microbiota and, at the meantime, increase the population of Clostridium and Bacteroides. The alteration of species population might have caused a lower rate of food metabolism, resulting in excessive energy intake in the body, which eventually triggers obesity.7,8
The objective of this study was to systematically dissect the side effects of SAL on the growth and health of pigs from a new prospective. Other than studying the residues of SAL in pigs, we have also looked into the lung microstructure, the transcriptional levels of genes in gastric mucosa, and the changes of gut microbiota population.
Results
Effects of SAL on the Body Weight and Viscera Indices
The changes of body weight gain and viscera indices are shown in Figure 2, and the feed efficiency ratio (FER) and the dressing percentage (DP) of the control group and SAL group are shown in Table 1. The results showed that the body weight gain, FER, and DP in the SAL group increased in the control group, but the changes were not significant, which suggested that SAL played a role in increasing the growth efficiency.
Figure 2.
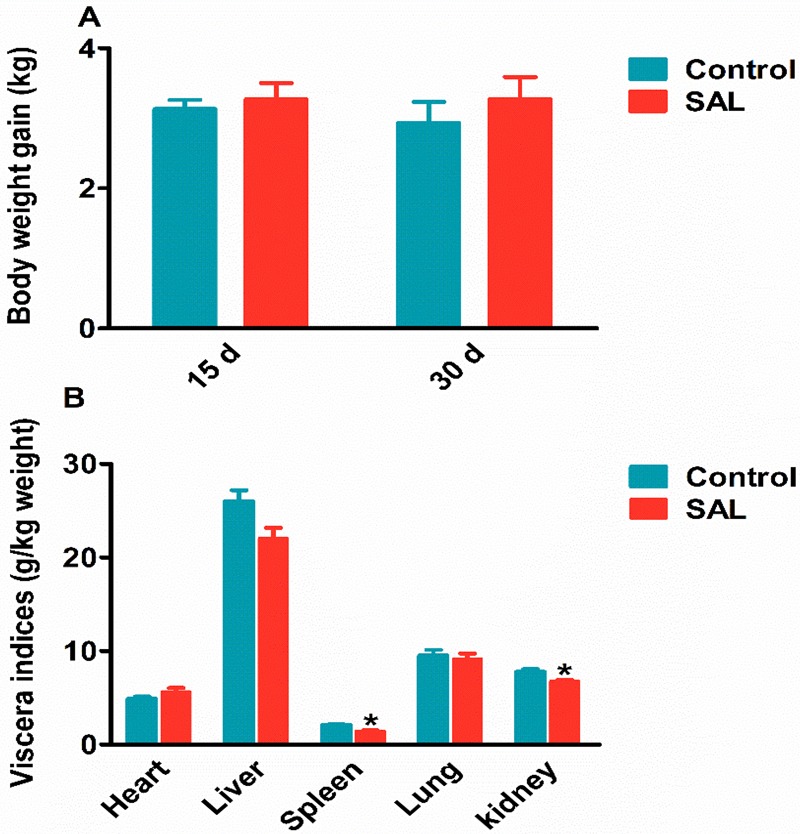
Effects of SAL on the pig (A) body weight and (B) viscera indices. All data are presented using mean ± SEM. *P < 0.05, **P < 0.01.
Table 1. Indices of Feed Conversion Ratio (FER) and Dressing Percentage (DP)a.
| control
group |
SAL group |
|||
|---|---|---|---|---|
| day | FER (kg/kg) | DP (%) | FER (kg/kg) | DP (%) |
| 15 | 0.96 ± 0.04 | 0.93 ± 0.06 | ||
| 30 | 2.45 ± 0.28 | 75% ± 1 | 2.18 ± 0.19 | 79 ± 1 |
All data are presented using mean ± SEM.
The viscera indices of liver, spleen (1.42 ± 0.1 vs 2.08 ± 0.14 g/kg, P < 0.05), lung, kidney (6.53 ± 0.35 vs 7.79 ± 0.15 g/kg, P < 0.05) were shown to be decreased in the SAL group, except for the heart (5.53 ± 0.18 vs 4.90 ± 0.13 g/kg, P < 0.05) with a significant increase (Figure 2B). These observations suggested that SAL may have some interactions with the receptors in the heart that can subsequently lead to atrophy of other organs.
Effects of SAL on the Serum Lipid and Antioxidant Indices
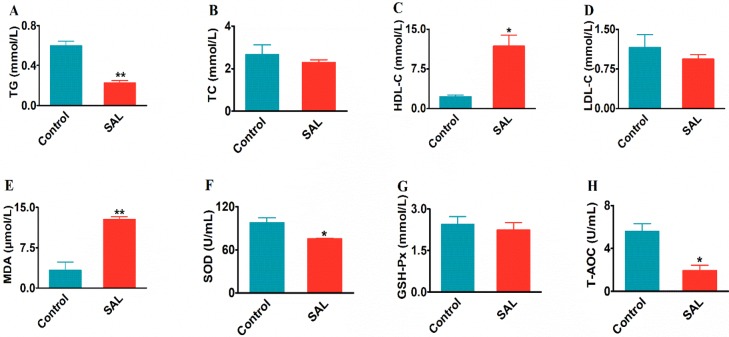
Compared with the control group in Figure 3, while the level of TG (0.22 ± 0.02 vs 0.59 ± 0.04 mmol/L, P < 0.01) decreased significantly, the levels of TC (2.29 ± 1.12 vs 2.67 ± 0.45 mmol/L, P > 0.05) and LDL-C (0.94 ± 0.07 vs 1.15 ± 0.24 mmol/L, P > 0.05) also lowered but not significant. Meanwhile, the HDL-C level in blood lipid showed a significant increase (11.79 ± 2.07 vs 2.88 ± 0.04 mmol/L, P < 0.05). To summarize, the overall changes of TG, TC, LDL-C, and HDL-C indicated the function of SAL at decreasing fat level in the blood.
Figure 3.
Effects of SAL supplementation on the serum lipid and antioxidant indices. The changes of (A) triglyceride (TG), (B) total cholesterol (TC), (C) high-density lipoprotein cholesterol (HDL-C), (D) low-density lipoprotein cholesterol (LDL-C), (E) malondialdehyde (MDA), (F) superoxide dismutase (SOD), (G) glutathione (GSH-Px), and (H) total antioxidant capacity (T-AOC). All data are presented by mean ± SEM. *P < 0.05, **P < 0.01.
For the blood antioxidants, while the indices of MDA (3.33 ± 1.5 vs 12.77 ± 0.51 μmol/L, P < 0.01), SOD (75.3 ± 0.83 vs 98.09 ± 6.83 U/mL, P < 0.05), and T-AOC (1.93 ± 0.49 vs 5.57 ± 0.72 U/mL, P < 0.05) decreased significantly, the GSH-Px also decreased (2.24 ± 0.26 vs 2.44 ± 0.27 mmol/L, P > 0.05) but not at a significant level. The results suggested that the blood antioxidant capacity had been lowered in the presence of SAL (Figure 3).
Residual Amount of SAL in the Feces and Organs
The SAL residues were also detected in the gastric contents (14.50 ± 7.86 μg/kg), colon contents (1013.93 ± 234.75 μg/kg), feces-15 d (53.95 ± 6.93 μg/kg), and feces-30 d (1597.64 ± 141.68 μg/kg) (Figure 4A). With the prolonged feeding time, the feces became the main excretion pathway for SAL.
Figure 4.
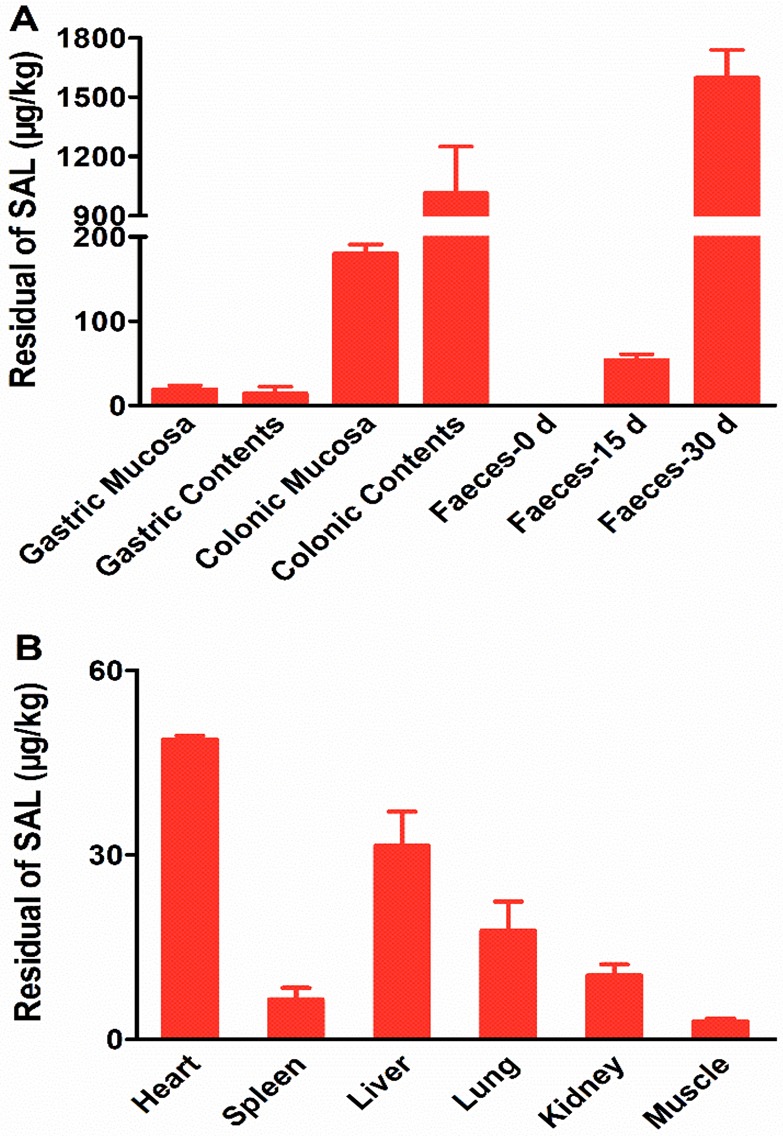
Detection of SAL in feces and organs. (A) The residual amount of SAL in gastric mucosa, gastric contents, colonic mucosa, colonic contents, feces-0 d (feces collected at 0 day), feces-15 d (feces collected at 15 days), and feces-30 d (feces collected at 30 days) of the SAL group. (B) The residual amount of SAL in heart, spleen, liver, lung, and kidney of the SAL group. All data are presented by mean ± SEM.
SAL was found to be widely distributed in the animal tissues and organs, including heart (48.75 ± 0.62 μg/kg), spleen (6.50 ± 1.90 μg/kg), liver (31.45 ± 5.59 μg/kg), lung (17.70 ± 4.70 μg/kg), kidney (10.40 ± 1.80 μg/kg), gastric mucosa (19.09 ± 4.88 μg/kg), colonic mucosa (180.11 ± 10.94 μg/kg), and muscle (2.90 ± 0.40 μg/kg) (Figure 4B). Generally, our results suggested that SAL remained mainly in the organs but less in the muscles.
The parameters for the determination of SAL by UPLC–MS/MS are shown in Table 2. The method had a good linearity in a range of 0.4–3000 μg/kg with an LOD of 0.12 μg/kg and LOQ of 0.38 μg/kg and a recovery of 68%–80%.
Table 2. Analytical Parameters for the Determination of SAL by UPLC–MS/MS.
| compound | regression equation | linearity (r2) | range (ng/mL) | LOD (ng/mL) | LOQ (ng/mL) | recovery (%) |
|---|---|---|---|---|---|---|
| SAL | Y = 0.142X + 0.046 | 0.99 | 0.4–3000 | 0.12 | 0.38 | 68–80 |
Effects of SAL on the Lung Bronchial Morphology of Pigs
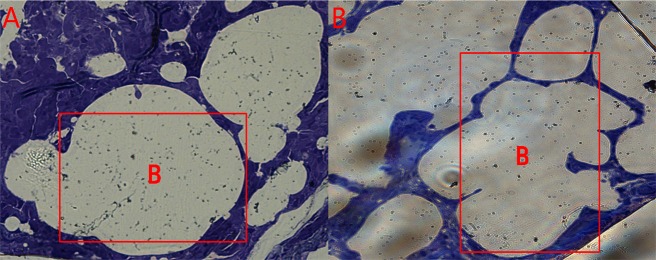
From the lung microstructure analysis (Figure 5), it was found that the control group had a normal bronchial morphology with smooth muscle integrity and a normal interval between adjacent bronchi. However, in the SAL group, the bronchi showed irregularities with a narrower bronchial septum. Overall, the differences in the lung morphology between the two groups indicated that SAL had an impact on the bronchial structure.
Figure 5.
Lung microstructure of pigs in the (A) control group and (B) SAL group. The letter “B” indicated in the frame denotes “bronchus”.
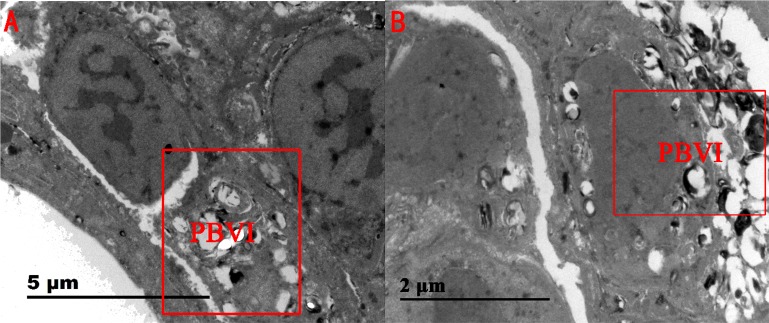
From the lung ultrastructural results (Figure 6), the tissues surrounding the bronchi of the control pigs were observed to be normal. However, in the SAL group, the tissues surrounding the bronchi showed some level of damage with and signs of purulent inflammation, which implicated an underlying risk of bronchiectasis.
Figure 6.
Lung ultrastructures of pigs in the (A) control group and (B) SAL group. The abbreviation “PBVI” in the box denotes “peribronchovascular interstitium”.
Effects of SAL on the mRNA Expression Profiles in the Gastric Mucosa
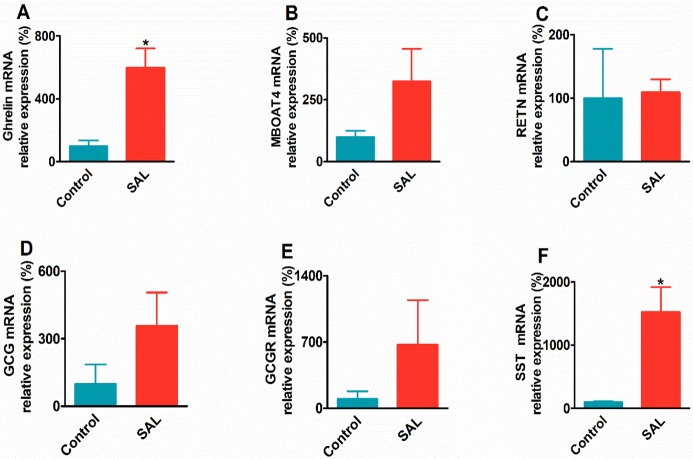
The changes of relative mRNA expression levels of the ghrelin, MBOAT4, RETN, GCG, GCGR, and SST in the SAL group are shown in Figure 7. SAL significantly increased the mRNA expression of ghrelin (6-fold vs control, P < 0.05) and SST (14-fold vs control, P < 0.05). The MBOAT4 (3-fold vs control, P > 0.05), GCG (4-fold vs control, P > 0.05), and GCGR (7-fold vs control, P > 0.05) mRNA expression level also increased, but the changes were not significant. However, the RETN gene mRNA expression in the SAL group was found to be unchanged compared to that of the control group. The results suggested that the residual SAL in the gastric mucosa may have an impact on the physiological state of the gastric mucosa and changed the growth-related genes, such as ghrelin and SST.
Figure 7.
mRNA expression profiles of the target genes in the gastric mucosa of the SAL group: (A) ghrelin, (B) MBOAT4, (C) RETN, (D) GCG, (E) GCGR, (F) SST. All data are presented by mean ± SEM. *P < 0.05, **P < 0.01.
Effects of SAL on the Gut Microbiota Population
Illumina MiSeq sequencing produced 583,689 valid DNA sequences (with 326,658 and 257,031 sequences for the control and SAL groups, respectively) from the fecal samples. In general, it can be defined as an operational taxonomy unit (OTU) when the similarity of different 16S rDNA sequences exceeds 97%.
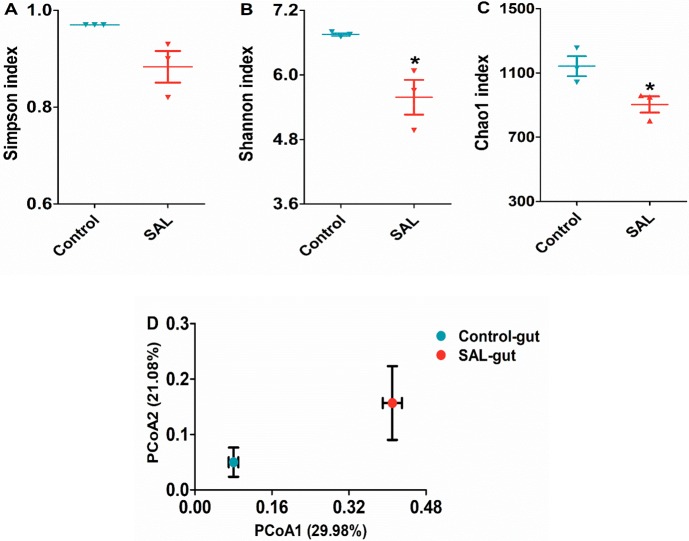
The Simpson, Shannon, and Chao1 analysis was used to evaluate the species richness in the community ecology. The Simpson indices did not show any significant difference between the control and SAL groups, but the Shannon and Chao1 indices of the SAL group (0.56 ± 0.32 vs 6.75 ± 0.04, P < 0.05 and 0.88 ± 0.05 vs 0.97 ± 0.03, P < 0.05, respectively) were both significantly decreased, compared to the control group (Figure 8A–C). The results indicated that the richness of gut microorganism species declined under the influence of SAL.
Figure 8.
Changes the gut microbiota composition in pigs fed with SAL: (A) Shannon index, (B) Simpson index, (C) Chao1 index, and (D) weighted Unifrac PCoA of gut microbiota based on the OTU data.
The overall composition changes of the gut microbiota population were analyzed using the weighted UniFrac method, and the PCoA scores clearly separated the control group from the SAL group in the PCoA plot (Figure 8D), which indicated that there was a change in the composition of the gut microorganism population in the presence of SAL.
Microbial Shifts in Response to the Presence of SAL in the Gut
At the phylum level of the gut microbiomes, with the prolonged feeding time, the proportion of Firmicutes increased in both groups. However, the ratio of Bacteroidetes slightly increased at 15 days and then decreased at 30 days in the control group, whereas it decreased during the entire duration tested in the SAL group. The ratio of Spirochaetes in the SAL group rose to 10.9% at 15 days, and then dropped to 4% at 30 days, but in the control group, it increased up to the 9% at 30 days (Figure 9A).
Figure 9.
Taxon of classifications of the average sequence reads at phylum and class levels at (A) the phylum level and (B) the class level in the gut. Control-0 d and SAL-0 d, control-15 d and SAL-15 d, and control-30 d and SAL-30 d denote the feces collected at 0, 15, and 30 days in the control and SAL groups, respectively.
Clostridia and Bacteroidia were the most abundant classes in the phylum Firmicutes and Bacteroidetes, respectively. The proportion of Clostridia increased from 32.5 to 55.56% and 37.63 to 70.83% in the control group and SAL group, respectively. The proportion of Bacteroidia decreased to 25.13% at 30 days in the control group, but when SAL was supplemented, it reduced from 46.13 to 12.83% (Figure 9B).
Effects of SAL on the Microbiota Genus Variation in the Gut
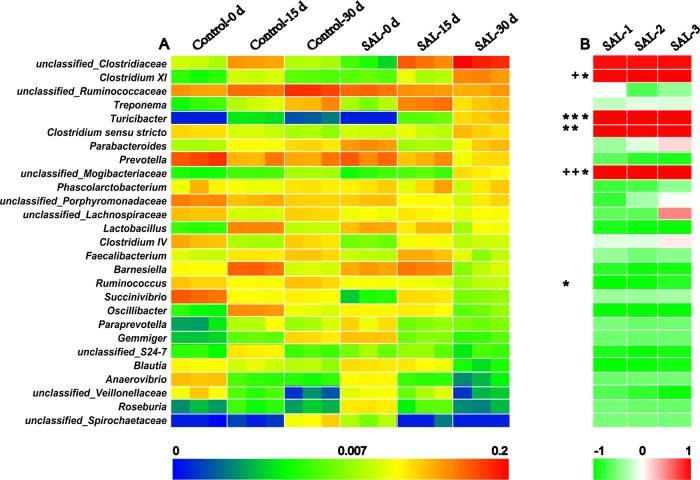
A total of 160 genera were identified in the feces of the control and SAL groups at the three-time points (0, 15, and 30 days), and 27 genera with an abundance level of more than 2.5% in at least one group are shown in Figure 10A. As the feeding time prolonged, there were nine and five genera with increasing abundance and 8 and 13 genera with decreasing abundance in the control and SAL groups, respectively. After 30 days of feeding with SAL, eight genera, including Clostridium XI, Turicibacter, Clostridium sensu stricto, Parabacteroides, and Lactobacillus and the unclassified Clostridiaceae, Mogibacteriaceae, and Veillonellaceae enhanced the abundance in the SAL group, whereas the other 21 genera showed a trend of decreasing abundance, compared to the control group.
Figure 10.
Twenty-seven genera identified in the gut microbiota with the level of abundance greater than 2.5% in at least one group. (A) The abundance of 27 genera in the control and SAL groups at three-time points (0, 15, and 30 days). (B) The correlation between the gut microbiota and the SAL residues in the feces. The genera labeled in red mean positive correlation, while those labeled in green mean negative correlation. *P < 0.05, +P < 0.01. All data were presented after log 2.
The correlation between SAL fecal residues and the abundance of 27 genera in the SAL group are shown in Figure 10B. The average SAL residues in the feces samples were 0, 53.95, and 1597.64 μg/kg at 0, 15, and 30 days, respectively. In the presence of SAL, there were five genera that showed a positive correlation with SAL residues, including the unclassified Clostridiaceae (R = 0.958, 0.954, 0.967), Clostridium XI (R = 0.994, 1, 0.999), Turicibacter (R = 0.999, 1, 1), Clostridium sensu stricto (R = 0.997, 0.999, 0.996), and unclassified Mogibacteriaceae (R = 1, 1, 0.999). The other 22 genera showed a negative correlation with SAL residues in at least two pigs, and the Lactobacillus (R = −0.885, −0.957, −0.975), Barnesiella (R = −0.838, −0.954, −0.937), Ruminococcus (R = −0.998, −0.975, −0.864), Oscillibacter (R = −0.988, −0.99, −0.996), unclassified_S24-7 (R = −0.897, −0.978, −0.938), Blautia (R = −0.997, −0.97, −0.923), and unclassified Veillonellaceae (R = −0.684, −0.815, −0.959) presented higher negative correlation indices than the other genera.
Discussion
Due to the effects of salbutamol on improving the animal production efficiency, more and more researchers focus on delivering the positive production benefits to the swine industry. In a previous study, the body weight of pigs fed with 2 mg/kg (R)-salbutamol for 4 weeks showed a significant increase compared with those of the control group, the 4 mg/kg (R)-salbutamol group, and the 8 mg/kg group.9 Meanwhile, the same study conducted by Yousefi et al10 demonstrated that 5 mg/L salbutamol was more effective at increasing feed intake and body weight gain than the 10 and 15 mg/L diet for broiler chickens. However, when we fed the pigs with 5 mg/kg SAL containing both (R)-salbutamol and (S)-salbutamol for 30 days, the body weight gain, FER, and DP in the SAL group were all improved but not significant. Thus, we concluded that the high concentrations of SAL and the racemic mixture of (R,S)-salbutamol may have contributed to the insignificant increase of the pigs’ weight gain.
In previous studies using mice models, the serum lipid indices were used to evaluate the level of obesity.11,12 As shown in Figure 3, the concentrations of TG significantly decreased while the HDL-C index significantly increased, which can be used as the markers that promoted fat decomposition.13,14 Superoxide dismutase (SOD), which plays a role in removing free radicals generated in vivo, was found to be effective at inhibiting cardiovascular diseases and preventing atherosclerosis.15,16 When the pigs were fed with SAL diet for 30 days, the SOD levels in the blood stream significantly decreased and the MDA increased dramatically, which indicated that SAL could reduce the total antioxidant molecules, which in turn increase the free radicals and accelerate the risk of cardiovascular diseases.
Similar to clenbuterol, salbutamol has the propensity to accumulate in tissues and organs that cause adverse reactions. According to previous reports, the cattle heart rate beats faster after taking clenbuterol for 1 h, which was in agreement with our results. Gojmerac reported that pigs fed with a diet containing clenbuterol showed symptoms of slight hyperplasia of the bile duct, inflammation of the liver interstitium, and degeneration of the liver cells. These indices, including ALB, ALT, AST, AKP, and TBILI, are considered indicators of liver functions. When pigs were fed with the SAL diet, these indicators could become abnormal and the liver indices decreased significantly.17 In this experiment, the liver indices of the SAL group were lower than those of the control group, and the mean residual value of SAL in the liver was 31.45 μg/kg. The results showed that SAL contributed to the damage and the normal function of the liver.
To our knowledge, SAL is extensively used for the clinical treatment of asthma,18−20 but the side effects of SAL on the lungs were rarely reported. From our results (Figures 5 and 6), SAL caused bronchial lumen expansion in the lungs and some destruction to tissues near the bronchi, which enhanced the risk of bronchiectasis. Patients with bronchiectasis are often accompanied by chronic cough, massive purulent sputum, and repeated hemoptysis.21 Therefore, in clinical settings, the dosage and duration of administration of salbutamol as a drug should be carefully applied to avoid an adverse effect on the lung bronchi.
To date, as far as we are aware, no studies have reported about the effects of SAL on the gene expression related to growth in the stomach of pigs. The hormones of the gastrointestinal tract secreted by the endocrine cells in the body play an important role in regulating the activities of stomach and intestines, such as secretion, absorption, and movement.22,23 The ghrelin hormone, known as the “hunger hormone”, can function as a neuropeptide, which acts on the hypothalamic brain cells to increase the sense of hunger as well as on the gastric acid secretion to stimulate the body for food intake. The ghrelin hormone exhibits similar motility with the motilin. Some studies have shown that the intragastric injection of the ghrelin hormone in rats could stimulate the gastric acid secretion, which in turn speeds up the gastric emptying and intestinal delivery of liquid diet.24 Dogs treated with SAL showed a higher plateau of gastrin concentration in the plasma than that in the control group.25−27 When we fed SAL (5 mg/kg) to pigs for 30 days, they showed a strong appetite with a significantly increased level of the ghrelin gene. Thus, we concluded that SAL could alter the appetite and growth by regulating ghrelin expression.
Unlike the ghrelin hormone, the main physiological function of SST hormones is the inhibition of cell proliferation, regulation of neurotransmitters release, and inhibition of gastric acid.28,29 Many studies have shown that the levels of ghrelin and SST hormones are associated with the pathogenesis of gastrointestinal inflammation.30 In this study, the ghrelin and SST gene expression levels in the SAL group were significantly increased. We can deduce that the elevated ghrelin gene expression serves to increase the gastrointestinal activity to contribute to the body growth, whereas the body’s immunity stimulates the SST gene expression to protect the stomach.
A previous study has shown that different intestinal parts of pigs have different microorganism composition.31 The dominant bacteria in the small intestine were Firmicutes and Proteobacteria, and the dominant bacteria in the large intestine were Firmicutes and Bacteroidetes. However, the composition of microorganisms in various regions of the large intestine (such as cecum, colon, rectum, etc.) is not identical.32,33 Starch, protein, and fat can be metabolized in the small intestine, and the undigested cellulose can be metabolized by microorganisms in the large intestine to produce short-chain fatty acids, which are then absorbed by the body as an extra source of energy. The gut microbiota composition in the large intestine of obese individuals has been shown to have an increased proportion of Firmicutes and decreased Bacteroidetes.(34,35) This composition feature equipped the gut microbiota the ability to specially increase nutrient absorption, resulting in excessive energy intake for the body and eventually leads to obesity.36,37 In our study, however, we examined the gut microbiota in pig feces and found that with the prolonged feeding time, SAL increased the population level of Firmicutes and reduced the proportion of Bacteroidetes, which indicated that the microbiota composition changes attributed to SAL were similar to those in obese individuals but with the exception that SAL also reduced the serum lipid level. The results suggested that the changes of the proportion of Firmicutes and Bacteroidetes may not be the major factor.
The phyla of Fibrobacteria and Bacteroidetes are regarded as the major contributors to fat accumulation among human intestinal microorganisms with Clostridium is being one of the biggest genera in the phylum of Fibrobacteria.(38) The intestine is rich in metabolic enzymes including polysaccharide hydrolase, phosphotransferase, and fructosidase, which can promote the catabolism of cellulose into short-chain fatty acids to allow an increased energy intake in the body. The existence of Clostridium in the gut of obese individuals is regarded to be associated with these enzymes.39,40 The fasting-induced adipose factor (FIAF) is associated with fat metabolisms. The body fat accumulates in the body when FIFA expression is suppressed.41 A number of studies have shown that the increased proportion of Clostridium inhibited the expression of FIFA.42Bacteroides has also been found to produce polysaccharide-hydrolyzing enzymes, and the level of enzyme production increases in the presence of Clostridium.(43) It is not clear whether the increased proportion of Clostridium is the main contributor of polysaccharide hydrolase produced in the gut. The actual role of Clostridium in contributing to the amount of short-chain fatty acids produced and higher energy intake of the host is also unknown. In this experiment, Clostridium showed a positive correlation with the SAL fecal residues of all three pigs. The increased abundance of unclassified Clostridiales was similar to that of the microbiota composition of obese individuals but completely the opposite of skinny individuals. Nevertheless, the role of Clostridium and Bacteroides in contributing to obesity needs to be further clarified with studies that illustrate the correlation between Clostridium and SAL.
Turicibacter, a Gram-positive bacteria, originally isolated from the blood of patients with acute appendicitis is also found in the ileum of sufferers with ulcerative colitis.44,45 A number of studies have reported that the dietary type has an impact to the presence of Turicibacter. The abundance of Turicibacter was found to have improved in the pigs fed with a high-starch diet.46 However, the physiological characteristics and the function of Turicibacter in the intestine are generally not very clear. In the present study, the Turicibacter was not detected in the feces of pigs in the control group, but it was shown to be increased linearly with the presence of SAL in feces. Similarly, the relative proportion of Turicibacter in obese mice was found to be lower than that in mice fed with a normal diet.47 Thus, it is possible that the non-obese pigs due to SAL in turn contributed to the increase of Turicibacter.
As for the genera that decreased linearly with the presence of SAL in feces, the Prevotella was found to be the predominant genera in the control group, but the population was decreased in the SAL group. Prevotella has a positive correlation to the body weight gain as it can metabolize food to produce short chain fatty acids, which are growth stimulants for young pigs.48,49 The pigs in the SAL group had a higher body weight gain than those in the control group with a significantly decreased level of the blood lipids, such as TC, TG and LDL-C, suggesting that the alteration of the Prevotella abundance may be one of the contributing factors to decrease the level of fat in pigs.
For other genera, the population of unclassified Ruminococcaceae and Lactobacillus in the SAL group was found to be decreased linearly with feeding time. The characteristics of microbial metabolic pathways may be the explanation why Rumenococcus is the dominant genus under high protein and animal fat diet.
The high-activity multienzyme complexes known as cellulosomes produced by the Ruminococcus genus can degrade insoluble xyloglucan, wood poly sugar, and cellulose to short-chain fatty acids.50 The presence of SAL decreased the proportion of Ruminococcaceae, which then reduce the intake of additional energy and promote intestinal peristalsis. Lactobacillus, as the representative of probiotics, is known to provide health benefits to the host.51Lactobacillus curvatus K313 and K243 isolated from the chicken intestine were found to have an inhibitory effect on the adhesion of Salmonella and the reduction of proinflammatory cytokine transcription.52Lactobacillus plantarum 10hk2 can modulate the anti-inflammatory factors in murine macrophage RAW264.7.53 SAL decreased Lactobacillus in the gut of pigs and altered the balance of gut microorganism population, which in turn reduced the immune function.
In conclusion, with minipigs fed with SAL as the model, we demonstrated that SAL reduced the serum lipid, caused pulmonary bronchiectasis, increased the ghrelin gene expression, and altered the composition of gut microbiota. This study presented an insight into the bronchial expansion and gene expression related to growth. The role of gut microbiota in the presence of SAL requires further investigation.
Methods
Experimental Design
In this study, a total of six one-month-old castrated Ba-Ma minipigs (Sus scrofa domestica) weighing 2.93 ± 0.19 kg were purchased from Zhejiang Kaihua Hongxing Co., Ltd. All pigs were fed with the same standard commercial feed at 100 g/day with sufficient water for a week. The pigs were randomly separated into two groups of three. The pigs in the control group received only standard feed for 30 days, while the pigs in the SAL group received salbutamol sulfate purchased from the Jiangsu Yabang Epson Pharmaceutical Co., Ltd. at a concentration of 5 mg/kg in their feed for 30 days. The pigs in the control group and SAL group were all fed 100 g/day in the first 5 days and the amount increased by 100 g every subsequent 5 days until it reaches 500 g/day. Fresh feces samples in the two groups were collected at designated time points of 0, 15, and 30 days and then stored at −80 °C. The weight of pigs was also recorded on the same day.
UPLC–MS/MS Instrument and Conditions
The UPLC system was coupled to a triple quadrupole mass spectrometer (Waters, Milford, USA) equipped with an electrospray ionization (ESI) source operated in the positive ion mode. Separations were carried out on a Waters Acquity UPLC BEH C18 column (100 mm × 2.1 mm, 1.7 μm) and the column temperature was set at 25 °C. The mobile phase was consisted of 0.1% formic acid (solvent A) and MeOH (solvent B) with a flow rate at 0.3 mL/min. The following gradient profile was used: 0–1 min: maintaining 10% B; 1–4.5 min: linear from 10 to 50% B; 4.5–4.6 min: 50 to 90% B; 4.6–6.7 min: maintaining 10% B; 6.7–6.8 min: 90 to 10%; 6.8–9 min: maintaining 10% B. The precursor ions were m/z 240.1 for SAL [M + H+] and 243.2 for the internal standard SAL-D3 [M + H+]. Quantification was performed using MRM by monitoring the ion transitions m/z 240.1 > 148.1 for SAL and 243.2 > 151.1 for SAL-D3.
Sample Preparation
For detection of SAL, 2 ± 0.1 g of sample was added into a centrifuge tube comprising 8 mL of ammonium acetate buffer, 40 μL of β-glucosidase, and 100 μL of SAL-D3 internal standard (100 μg/mL). The mixture was incubated at 37 °C for 16 h in the dark. Then, the solution was centrifuged, pH-adjusted, and extracted with ethyl acetate and tert-butyl methyl ether. Finally, SAL was extracted by SPE and then injected in UPLC–MS/MS.
Method Parameters
The linearity of the calibration curve was assessed by analyzing a series of standards at the concentrations of 0.4, 1, 3, 30, 300, 900, and 3000 ng/mL for SAL. The LOD and LOQ for the target compounds were calculated as signal-to-noise ratios of 3:1 and 10:1, respectively. Recovery was calculated by comparing the peak areas of the analytes from spiked samples with those from the spiked mobile phase at three different concentrations including 10, 50, and 450 ng/mL.
Measurement of Blood Lipid and Antioxidant Indices
Blood lipid measurements, including total cholesterol (TC), triglyceride (TG), high-density lipoprotein cholesterol (HDL-C), and low-density lipoprotein cholesterol (LDL-C), and blood antioxidant measurements, including malondialdehyde (MDA), superoxide dismutase (SOD), glutathione peroxidase (GSH-Px), and total antioxidant capacity (T-AOC), were performed in our laboratory using kits purchased from the Nanjing JianCheng Bioengineering Institute.
Preparation of Lung Tissue Section
The original lung samples were fixed in the 2.5% glutaraldehyde solution, post-fixed with 1% tannic acid, and embedded in the glycidyl ether after dehydration with alcohol. The semi thin sections of 1 μm were cut with glass knives, stained with methylene blue, and then examined with a light microscope (Olympus BX-60, Olympus, Japan). The ultrathin sections of 40 nm were made with a diamond knife, stained with uranium acetate and lead citrate for 5–15 min, and then examined with electron microscopy (JEM-1200EX, Hitachi, Japan).
RNA Extraction and RT-qPCR
Total RNA was extracted from the gastric mucosa samples using TransZolUp Plus RNA kit (TransGen, Beijing, China). Isolated RNA was quantified by NanoDrop 2000 (Thermo Fisher Scientific, Waltham, USA). The RNA purity was evaluated with the ratio of OD260/280 and OD260/230, and its integrity was confirmed by agarose gel electrophoresis.
The RNA extracted was reverse transcribed to cDNA using the TransScript kit (TransGen, Beijing, China). A total of 1 μg of RNA, 5 μL of TransScript ALL-in-One SuperMix, 1 μL gDNA remover, and variable RNase-free water were added into a centrifuge tube. The mixture solution was then incubated for 15 min at 42 °C and heated for 5 s at 85 °C.
Six target genes were chosen for qPCR to analyze the mRNA expression levels in the gastric mucosa of the SAL group and the control group. The six target genes include ghrelin, membrane bound O-acyltransferase domain containing 4 (MBOAT4), resistin (RETN), glucagon (GCG), glucagon receptor (GCGR), and somatostatin (SST). Primers were designed using the sequences obtained from NCBI, and the primer sequences are shown in Table 3. RT-qPCR was performed with the cDNA template diluted 30 times using the Tip Green qPCR SuperMix kit (TransGen, Beijing). The PCR reaction procedure was performed with these steps: 5 min at 95 °C followed by 40 temperature cycles of 30 s at 95 °C and 10 s at 72 °C using the Rotor-Gene 6000 (Qiagen, Düsseldorf, Germany). β-actin was used as the reference gene. The relative expression quantity of gene was calculated using the 2–ΔΔCt method.
Table 3. Primer Sequences of Target Genes Used for Real-Time PCR of Gastric Mucosa Samples.
| gene | forward primer (5′ to 3′) | reverse primer (5′ to 3′) | product length (bp) | Tm (°C) |
|---|---|---|---|---|
| β-actin | CATCACCAACTGGGACGACA | GTTGGCCTTAGGGTTCAGGG | 121 | 55 |
| ghrelin | AGTGCAGCAGAGAAAGGAGTC | GATCCCAACATCACAGGGGG | 151 | 55 |
| MBOAT4 | GGATCCCAGGCACTCTCTCT | TGCCGACAATCAGTCAATCCA | 123 | 59 |
| RETN | GCTCTCTCCCTCCTCTTCCT | CGACATCCCGGATCTTCTCATT | 100 | 55 |
| GCG | GCGAGATTTCCCAGAGGAAGTT | AAAGTCTCGGGTGGCAAGATT | 115 | 55 |
| GCGR | CGTGCAGAGCTGGTCTGTAATA | CGCCGTGGCTACCTTTGT | 127 | 55 |
| SST | TGCTCTCTGAACCCAACCAG | CAGCCAGCTTTGCGTTCTC | 148 | 55 |
16S rDNA Sequencing
Total bacterial DNA was extracted from the feces sample. The DNA concentration was determined using NanoDrop 2000 (Thermo Scientific, Waltham, USA). The PCR primers are designed around the conserved regions of V3 and V4. The forward and reverse primers are 319F 5′-ACTCCTACGGGAGGCAGCAG-3′ and 806R 5′-GGACTACHVGGGTWTCTAAT-3′, respectively. After the first amplification, different adapters and barcodes were added at each pair of primers. Then, the amplified PCR products were sequenced at L C-Bio Co., Ltd. (Hangzhou, China) using an Illumina MiSeq platform.
Statistical Analysis
For data analysis, the raw data were processed with several steps: (1) The barcode and linker sequences for reads were removed. (2) Each pair of paired end reads could be combined into a single longer tag. (3) The tags containing more than 5% of N (N indicates undefined base information) and low-quality tags (20% or more of the total number of bases with Q < 10) were removed.
To test the differences in physiological and biochemical values for correlation analysis, normally distributed data were analyzed using the independent sample t-test and Pearson correlations, respectively (SPSS, (version 20.0), Chicago, IL, USA), and all data were presented as means ± SEM. The differences were considered significant when P < 0.05.
Acknowledgments
This study is financially supported by Ningbo Science and Technology Bureau Agricultural and Social Development Major Science and Technology Project (2010C10040), Ningbo Municipal Education Bureau Key Discipline Project (2017050352), Ningbo Agricultural Major Project (2015C110004) and K.C. Wong Magna Fund in Ningbo University.
The authors declare no competing financial interest.
References
- Brittain R. T.; Farmer J. B.; Marshall R. J. Some observations on the β-adrenoceptor agonist properties of the isomers of salbutamol. Br. J. Pharmacol. 1973, 48, 144–147. 10.1111/j.1476-5381.1973.tb08232.x. [DOI] [PMC free article] [PubMed] [Google Scholar]
- Chapman I. D.; Buchheit K. H.; Manley P.; Morley J. Active enantiomers may cause adverse effects in asthma. Trends Pharmacol. Sci. 1992, 13, 231–232. 10.1016/0165-6147(92)90071-D. [DOI] [PubMed] [Google Scholar]
- Nakpheng T.; Songkarak S.; Suwandecha T.; Sritharadol R.; Chunhachaichana C.; Srichana T. Evidences for salbutamol metabolism by respiratory and liver cell lines. Drug Metab. Pharmacokinet. 2017, 32, 127–134. 10.1016/j.dmpk.2016.11.006. [DOI] [PubMed] [Google Scholar]
- Sánchez J.; Oliver P.; Palou A.; Picó C. The inhibition of gastric ghrelin production by food intake in rats is dependent on the type of macronutrient. Endocrinology 2004, 145, 5049–5055. 10.1210/en.2004-0493. [DOI] [PubMed] [Google Scholar]
- Kaoutari A. E.; Armougom F.; Gordon J. I.; Raoult D.; Henrissat B. The abundance and variety of carbohydrate-active enzymes in the human gut microbiota. Nat. Rev. Microbiol. 2013, 11, 497–504. 10.1038/nrmicro3050. [DOI] [PubMed] [Google Scholar]
- Dai Z.-L.; Li X.-L.; Xi P.-B.; Zhang J.; Wu G.; Zhu W.-Y. Metabolism of select amino acids in bacteria from the pig small intestine. Amino Acids 2012, 42, 1597–1608. 10.1007/s00726-011-0846-x. [DOI] [PubMed] [Google Scholar]
- Cani P. D.; Delzenne N. M.; Amar J.; Burcelin R. Role of gut microflora in the development of obesity and insulin resistance following high-fat diet feeding. Pathol. Biol. 2008, 56, 305–309. 10.1016/j.patbio.2007.09.008. [DOI] [PubMed] [Google Scholar]
- Moreira A. P. B.; Texeira T. F. S.; Ferreira A. B.; Peluzio M. d. C. G.; Alfenar R. d. C. G. Influence of a high-fat diet on gut microbiota, intestinal permeability and metabolic endotoxaemia. J. Geophys. Res. Oceans 2012, 108, 801–809. 10.1017/S0007114512001213. [DOI] [PubMed] [Google Scholar]
- Marchant-forde J. N.; Lay D. C. Jr.; Marchant-Forde R. M.; McMunn K. A.; Richert B. T. The effects of R-salbutamol on growth, carcass measures, and health of finishing pigs. J. Anim. Sci. 2012, 90, 4081–4089. 10.2527/jas.2011-4423. [DOI] [PubMed] [Google Scholar]
- Yousefi J.; Maheri-Sis N.; Shaddel-Telli A.; Hatefinezhad K.; Eshartkhah B.; Saber S. N. Effect of salbutamol (a beta-adrenergic agonist) on growth performance of broiler chickens. Ann. Biol. Res. 2011, 2, 500–505. [Google Scholar]
- Song S. J.; Choi S.; Park T. Decaffeinated green coffee bean extract attenuates diet-induced obesity and insulin resistance in mice. Evid.-based Complement Altern. Med. 2014, 2014, 718379. 10.1155/2014/718379. [DOI] [PMC free article] [PubMed] [Google Scholar]
- Tanaka K.; Nishizono S.; Tamaru S.; Kondo M.; Shimoda H.; Tanaka J.; Okada T. Anti-Obesity and Hypotriglyceridemic Properties of Coffee Bean Extract in SD Rats. Food Sci. Technol. Res. 2009, 15, 147–152. 10.3136/fstr.15.147. [DOI] [Google Scholar]
- Choi B.-K.; Park S.-B.; Lee D.-R.; Lee H. J.; Jin Y.-Y.; Yang S. H.; Suh J.-W. Green coffee bean extract improves obesity by decreasing body fat in high-fat diet-induced obese mice. Asian Pac. J. Trop. Med. 2016, 9, 635–643. 10.1016/j.apjtm.2016.05.017. [DOI] [PubMed] [Google Scholar]
- Sunil V.; Shree N.; Venkataranganna M. V.; Bhonde R. R.; Majumdar M. The anti diabetic and anti obesity effect of Memecylon umbellatum extract in high fat diet induced obese mice. Biomed. Pharmacother. 2017, 89, 880–886. 10.1016/j.biopha.2017.01.182. [DOI] [PubMed] [Google Scholar]
- Marikovsky M.; Ziv V.; Nevo N.; Harris-Cerruti C.; Mahler O. Cu/Zn superoxide dismutase plays important role in immune response. J. Immunol. 2003, 170, 2993–3001. 10.4049/jimmunol.170.6.2993. [DOI] [PubMed] [Google Scholar]
- Shen Y.; Zhang H.; Cheng L.; Wang L.; Qian H.; Qi X. In Vitro and In Vivo Antioxidant activity of Polyphenols Extracted from Black Highland Barley. Food Chem. 2016, 194, 1003–1012. 10.1016/j.foodchem.2015.08.083. [DOI] [PubMed] [Google Scholar]
- Lu C.; Zhou J.; Li Y.; Zhang D.; Wang Z.; Li Y.; Cheong L.; Zhang C.; Su X. Structural modulation of gut microbiota in Bama minipigs in response to treatment with a ″growth-promoting agent″, salbutamol. Appl. Microbiol. Biotechnol. 2017, 101, 5809–5818. 10.1007/s00253-017-8329-y. [DOI] [PubMed] [Google Scholar]
- Honmane S.; Hajare A.; More H.; Osmani R. A. M.; Salunkhe S. Lung delivery of nanoliposomal salbutamol sulfate dry powder inhalation for facilitated asthma therapy. J. Liposome Res. 2019, 29, 332–342. 10.1080/08982104.2018.1531022. [DOI] [PubMed] [Google Scholar]
- Usmani O. S.; Biddiscombe M. F.; Yang S.; Meah S.; Oballa E.; Simpson J. K.; Fahy W. A.; Marshall R. P.; Lukey P. T.; Maher T. M. The topical study of inhaled drug (salbutamol) delivery in idiopathic pulmonary fibrosis. Respir. Res. 2018, 19, 25–34. 10.1186/s12931-018-0732-0. [DOI] [PMC free article] [PubMed] [Google Scholar]
- Carotenuto M.; Perfetti L.; Calcagno M. G.; Meriggi A. Comparison Of Acute Bronchodilator Effects Of Inhaled Ipratropium Bromide And Salbutamol In Adults With Bronchial Asthma. J. Allergy Clin. Immunol. 2018, 141, AB209. 10.1016/j.jaci.2017.12.660. [DOI] [Google Scholar]
- Thomas S.; Roy T.; Madhu A. P.; Neelakantan N.; Shukla V.; Korula R. J. Surgical results in bronchiectasis: analysis of 149 patients. J. Asian Cardiovasc. Thorac. Ann. 2007, 15, 290–296. 10.1177/021849230701500405. [DOI] [PubMed] [Google Scholar]
- Date Y.; Kojima M.; Hosoda H.; Sawaguchi A.; Mondal M. S.; Suganuma T.; Matsukura S.; Kangawa K.; Nakazato M. Ghrelin, a novel growth hormone-releasing acylated peptide, is synthesized in a distinct endocrine cell type in the gastrointestinal tracts of rats and humans. Endocrinology 2000, 141, 4255–4261. 10.1210/endo.141.11.7757. [DOI] [PubMed] [Google Scholar]
- Cammisotto P.; Bendayan M. A review on gastric leptin: the exocrine secretion of a gastric hormone. Anat. Cell. Biol. 2012, 45, 1–16. 10.5115/acb.2012.45.1.1. [DOI] [PMC free article] [PubMed] [Google Scholar]
- Asakawa A.; Inui A.; Kaga O.; Yuzuriha H.; Nagata T.; Ueno N.; Makino S.; Fujimiya M.; Niijima A.; Fujino M. A.; Kasuga M. Ghrelin is an appetite-stimulatory signal from stomach with structural resemblance to motilin. Gastroenterology 2001, 120, 337–345. 10.1053/gast.2001.22158. [DOI] [PubMed] [Google Scholar]
- Schwartz M. W.; Woods S. C.; Porte D. Jr.; Seeley R. J.; Baskin D. G. Central nervous system control of food intake. Nature 2000, 404, 661–671. 10.1038/35007534. [DOI] [PubMed] [Google Scholar]
- Abizaid A.; Liu Z. W.; Andrews Z. B.; Shanabrough M.; Borok E.; Elsworth J. D.; Roth R. H.; Sleeman M. W.; Picciotto M. R.; Tschöp M. H.; Gao X.-B.; Horvath T. L. Ghrelin modulates the activity and synaptic input organization of midbrain dopamine neurons while promoting appetite. J. Clin. Invest. 2006, 116, 3229–3239. 10.1172/JCI29867. [DOI] [PMC free article] [PubMed] [Google Scholar]
- Curwain B. P.; Fielding L. P.; Russell C. Proceedings: Effects of salbutamol on gastric acid secretion and gastrin liberation after feeding in conscious Heidenhain pouch dogs. Br. J. Pharmacol. 1974, 52, 462. [PMC free article] [PubMed] [Google Scholar]
- Schaller G.; Schmidt A.; Pleiner J.; Woloszczuk W.; Wolzt M.; Luger A. Plasma ghrelin concentrations are not regulated by glucose or insulin: a double-blind, placebo-controlled crossover clamp study. Diabetes 2003, 52, 16–20. 10.2337/diabetes.52.1.16. [DOI] [PubMed] [Google Scholar]
- Arosio M.; Ronchi C. L.; Gebbia C.; Cappiello V.; Beck-Peccoz P.; Peracchi M. Stimulatory Effects of Ghrelin on Circulating Somatostatin and Pancreatic Polypeptide Levels. J. Clin. Endocrinol. Metab. 2003, 88, 701–704. 10.1210/jc.2002-021161. [DOI] [PubMed] [Google Scholar]
- Qiu W.-C.; Wang Z.-G.; Wang W.-G.; Yan J.; Zheng Q. Gastric motor effects of ghrelin and growth hormone releasing peptide 6 in diabetic mice with gastroparesis. World J. Gastroenterol. 2008, 14, 1419–1424. 10.3748/wjg.14.1419. [DOI] [PMC free article] [PubMed] [Google Scholar]
- Moore W. E. C.; Cato E. P.; Holdeman L. V. Some current concepts in intestinal bacteriology. Am. J. Clin. Nutr. 1978, 31, S33–S42. 10.1093/ajcn/31.10.S33. [DOI] [PubMed] [Google Scholar]
- Ramayo-Caldas Y.; Mach N.; Lepage P.; Levenez F.; Denis C.; Lemonnier G.; Leplat J.-J.; Billon Y.; Berri M.; Doré J.; Rogel-Gaillard C.; Estellé J. Phylogenetic network analysis applied to pig gut microbiota identifies an ecosystem structure linked with growth traits. ISME J. 2016, 10, 2973–2977. 10.1038/ismej.2016.77. [DOI] [PMC free article] [PubMed] [Google Scholar]
- Kim H. B.; Isaacson R. E. The pig gut microbial diversity: Understanding the pig gut microbial ecology through the next generation high throughput sequencing. Vet. Microbiol. 2015, 177, 242–251. 10.1016/j.vetmic.2015.03.014. [DOI] [PubMed] [Google Scholar]
- Turnbaugh P. J.; Ley R. E.; Mahowald M. A.; Magrini V.; Mardis E. R.; Gordon J. I. An obesity-associated gut microbiome with increased capacity for energy harvest. Nature 2006, 444, 1027–1031. 10.1038/nature05414. [DOI] [PubMed] [Google Scholar]
- de la Serre C. B.; Ellis C. L.; Lee J.; Hartman A. L.; Rutledge J. C.; Raybould H. E. Propensity to high-fat diet-induced obesity in rats is associated with changes in the gut microbiota and gut inflammation. Am. J. Physiol. 2010, 299, G440–G448. 10.1152/ajpgi.00098.2010. [DOI] [PMC free article] [PubMed] [Google Scholar]
- Ley R. E.; Turnbaugh P. J.; Klein S.; Gordon J. I. Microbial ecology: human gut microbes associated with obesity. Nature 2006, 444, 1022–1023. 10.1038/4441022a. [DOI] [PubMed] [Google Scholar]
- Turnbaugh P. J.; Hamady M.; Yatsunenko T.; Cantarel B. L.; Duncan A.; Ley R. E.; Sogin M. L.; Jones W. J.; Roe B. A.; Affourtit J. P.; Egholm M.; Henrissat B.; Heath A. C.; Knight R.; Gordon J. I. A core gut microbiome in obese and lean twins. Nature 2009, 457, 480–484. 10.1038/nature07540. [DOI] [PMC free article] [PubMed] [Google Scholar]
- Pryde S. E.; Duncan S. H.; Hold G. L.; Stewart C. S.; Flint H. J. The microbiology of butyrate formation in the human colon. FEMS Microbiol. Lett. 2002, 217, 133–139. 10.1111/j.1574-6968.2002.tb11467.x. [DOI] [PubMed] [Google Scholar]
- Turnbaugh P. J.; Bäckhed F.; Fulton L.; Gordon J. I. Diet-induced obesity is linked to marked but reversible alterations in the mouse distal gut microbiome. Cell Host Microbe 2008, 3, 213–223. 10.1016/j.chom.2008.02.015. [DOI] [PMC free article] [PubMed] [Google Scholar]
- Rastmanesh R. High polyphenol, low probiotic diet for weight loss because of intestinal microbiota interaction. Chem.-Biol. Interact. 2011, 189, 1–8. 10.1016/j.cbi.2010.10.002. [DOI] [PubMed] [Google Scholar]
- Josephs T.; Waugh H.; Kokay I.; Grattan D.; Thompson M. Fasting-induced adipose factor identified as a key adipokine that is up-regulated in white adipose tissue during pregnancy and lactation in the rat. J. Endocrinol. 2007, 194, 305–312. 10.1677/JOE-07-0158. [DOI] [PubMed] [Google Scholar]
- Vrieze A.; Holleman F.; Zoetendal E. G.; de Vos W. M.; Hoekstra J. B. L.; Nieuwdorp M. The environment within: how gut microbiota may influence metabolism and body composition. Diabetologia 2010, 53, 606–613. 10.1007/s00125-010-1662-7. [DOI] [PMC free article] [PubMed] [Google Scholar]
- Mahowald M. A.; Rey F. E.; Seedorf H.; Turnbaugh P. J.; Fulton R. S.; Wollam A.; Shah N.; Wang C.; Magrini V.; Wilson R. K.; Cantarel B. L.; Coutinho P. M.; Henrissat B.; Crock L. W.; Russell A.; Verberkmoes N. C.; Hettich R. L.; Gordon J. I. Characterizing a model human gut microbiota composed of members of its two dominant bacterial phyla. Proc. Natl. Acad. Sci. U. S. A. 2009, 106, 5859–5864. 10.1073/pnas.0901529106. [DOI] [PMC free article] [PubMed] [Google Scholar]
- Bosshard P. P.; Zbinden R.; Altwegg M. Turicibacter sanguinis gen. nov., sp. nov., a novel anaerobic, Gram-positive bacterium. Int. J. Syst. Evol. Microbiol. 2002, 52, 1263–1266. 10.1099/00207713-52-4-1263. [DOI] [PubMed] [Google Scholar]
- Falk A.; Olsson C.; Ahrné S.; Molin G.; Adawi D.; Jeppsson B. lleal pelvic pouch microbiota from two former ulcerative colitis patients, analysed by DNA-based methods, were unstable over time and showed the presence of Clostridium perfringens. Scand. J. Gastroenterol. 2007, 42, 973–985. 10.1080/00365520701204238. [DOI] [PubMed] [Google Scholar]
- Sun Y.; Su Y.; Zhu W. Microbiome-Metabolome Responses in the Cecum and Colon of Pig to a High Resistant Starch Diet. Front. Microbiol. 2016, 7, 1–7. 10.3389/fmicb.2016.00779. [DOI] [PMC free article] [PubMed] [Google Scholar]
- Jung M.-J.; Lee J.; Shin N.-R.; Kim M.-S.; Hyun D.-W.; Yun J.-H.; Kim P. S.; Whon T. W.; Bae J.-W. Chronic Repression of mTOR Complex 2 Induces Changes in the Gut Microbiota of Diet-induced Obese Mice. Sci. Rep. 2016, 6, 30887. 10.1038/srep30887. [DOI] [PMC free article] [PubMed] [Google Scholar]
- Kamada N.; Seo S.-U.; Chen G. Y.; Núñez G. Role of the gut microbiota in immunity and inflammatory disease. Nat. Rev. Immunol. 2013, 13, 321–335. 10.1038/nri3430. [DOI] [PubMed] [Google Scholar]
- Mach N.; Berri M.; Estellé J.; Levenez F.; Lemonnier G.; Denis C.; Leplat J.-J.; Chevaleyre C.; Billon Y.; Doré J.; Rogel-Gaillard C.; Lepage P. Early-life establishment of the swine gut microbiome and impact on host phenotypes. Environ. Microbiol. Rep. 2015, 7, 554–569. 10.1111/1758-2229.12285. [DOI] [PubMed] [Google Scholar]
- Hyeon J. E.; Jeon S. D.; Han S. O. Cellulosome-based, Clostridium-derived multi-functional enzyme complexes for advanced biotechnology tool development: advances and applications. Biotechnol. Adv. 2013, 31, 936–944. 10.1016/j.biotechadv.2013.03.009. [DOI] [PubMed] [Google Scholar]
- Geier M. S.; Butler R. N.; Giffard P. M.; Howarth G. S. Lactobacillus fermentum BR11, a potential new probiotic, alleviates symptoms of colitis induced by dextran sulfate sodium (DSS) in rats. Int. J. Food Microbiol. 2007, 114, 267–274. 10.1016/j.ijfoodmicro.2006.09.018. [DOI] [PubMed] [Google Scholar]
- Sun Z.; Huang L.; Kong J.; Hu S.; Zhang X.; Kong W. In vitro evaluation of Lactobacillus crispatus K313 and K243: High-adhesion activity and anti-inflammatory effect on Salmonella braenderup infected intestinal epithelial cell. Vet. Microbiol. 2012, 159, 212–220. 10.1016/j.vetmic.2012.03.043. [DOI] [PubMed] [Google Scholar]
- Chon H.; Choi B.; Lee E.; Lee S.; Jeong G. Immunomodulatory effects of specific bacterial components of Lactobacillus plantarum KFCC11389P on the murine macrophage cell line RAW 264.7. J. Appl. Microbiol. 2009, 107, 1588–1597. 10.1111/j.1365-2672.2009.04343.x. [DOI] [PubMed] [Google Scholar]


