Abstract
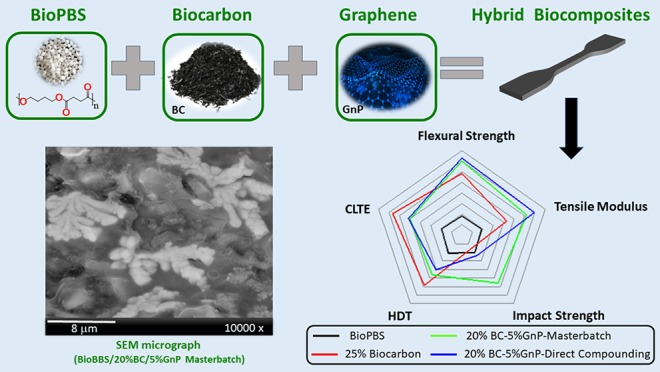
Bio-based poly(butylene succinate) (BioPBS) was combined with pyrolyzed Miscanthus microparticles (biocarbon) and graphene nanoplatelets to create a hybrid bionanocomposite. Pyrolyzed biomass, known as biocarbon, was incorporated into a BioPBS matrix to improve the thermo-mechanical properties of the bioplastic while simultaneously increasing the value of this co-product. Biocomposites loaded with 25 wt % biocarbon showed 57, 13, and 32% improvements in tensile modulus, heat deflection temperature, and thermal expansion, respectively. Further improvements were found when graphene nanoplatelets (GnPs) were added to the biocomposite, forming a hierarchical hybrid bionanocomposite. Two processing methods were used to incorporate graphene into the composites: (I) graphene, BioPBS, and biocarbon were added together and directly compounded, and (II) a masterbatch of graphene and BioPBS was processed first and then diluted to the same ratios as those used in the direct compounding method I. The two methods resulted in different internal morphologies that subsequently impacted the mechanical properties of the composites; little change was observed in the thermal properties studied. Bionanocomposites processed using the direct compounding technique showed the greatest increase in tensile strength and modulus: 17 and 120%, respectively. Bionanocomposites processed using a masterbatch technique had slightly lower strength and modulus but showed almost twice the impact strength compared with the direct compounding method. This masterbatch technique was found to have a superior balance of stiffness and toughness, likely due to the presence of superclustered graphene platelets, confirmed through a scanning electron microscope and a transmission electron microscope.
Introduction
Polymers are dominating the material landscape across the world, owing in part to their low density, low cost, and easy formability. However, it is estimated that future consumption will grow rapidly in developing countries; even small increases of per capita of plastic consumption will translate into a large increase in plastic usage.1 Recently, biodegradable aliphatic polyesters have seen a surge in popularity across a number of industries.2 Poly(butylene succinate) (PBS) is produced by the esterification of succinic acid with 1,4-butanediol. The current industrial process utilizes approximately 54% bio-based content in the production of PBS in the form of bio-succinic acid.3,4 However, with further industrialization, bio-succinic acid can be used to produce 1,4-butanediol,5 which would lead to 100% bio-based PBS (BioPBS).
Charred biomass, referred to as biocarbon (BC) or biochar, is one of the three main products produced from the pyrolysis of biomass.6,7 Biocarbon has been traditionally used as a carbon sink or soil amendment.8,9 More recently biocarbon has been used as a bio-filler for composite applications.7,8,10,11 In composite applications, it is advantageous to have both surface functionality and high surface area to create blends with good thermo-mechanical properties; therefore, pyrolysis conditions are very important when creating biocarbon. Research has shown that using high- and low-temperature biocarbon in toughened polypropylene composites resulted in drastically different mechanical properties.12 High-temperature pyrolysis (∼900 °C) resulted in a stiffer biocarbon compared to low-temperature biocarbon (∼500 °C); this increased stiffness resulted in a stiffer composite.12 High-temperature biocarbon also resulted in tougher (measured through impact strength) composites; this was attributed to the better affinity between biocarbon and the matrix.12 Researchers found the opposite trend when high- and low-temperature biocarbon was added to a polyamide 6 matrix.10 In this case, the higher functionality of the low-temperature biocarbon was attributed to the increased tensile and flexural strengths observed in the composites.10 These studies emphasize the differences between both the biocarbon filler used and the matrix in which they are reinforced, demonstrating a wide variety of thermo-mechanical properties, dependent on both the filler and the matrix.
Structure–property relations and the processing steps that result in this structure have led to large breadth of knowledge in composite polymeric materials. However, the addition of nanomaterials such as graphene, carbon nanotubes, nanofibers, and nanoclays has further widened this field.13 Graphene, specifically graphene nanoplatelets (GnP), is a nanoscale platelet of multiple graphene sheets (a single graphene sheet is roughly 4 nm thick)14 with a thickness between 0.34 and 100 nm.15 Graphene is one of the strongest materials known, with an intrinsic tensile strength of 130.5 GPa and a Young’s modulus of 1 TPa.16 The addition of graphene to polymeric matrices, not surprisingly, leads to great improvement in stiffness and strength,17−20 likely due to a mixture of high aspect ratio particles, alignment during processing and deformation, and the preferment of strain-induced crystallization.21 However, for these properties to be fully taken advantage of graphene must be evenly dispersed and well distributed within the polymer matrix. Research has shown that the orientation of the graphene also affects the composites’ stiffness and thermal properties.22 Proper distribution and orientation is not easily obtained due to graphene nanoplatelets (GnPs’) large surface area, van der Waals forces (which hold the sheets together),23 and low solubility in organic solvents and polymer melts,23 resulting in low levels of dispersion and exfoliation when using conventional manufacturing processes like solution or melt blending.24 Many advanced techniques have shown excellent levels of dispersion including ultrasound-assisted extrusion,25 addition of surfactants26 or functionalized groups,17 water,27 or supercritical CO2,28 and in situ polymerization.29
Melt mixing or melt compounding is a process in which a polymer and filler are compounded together in a high shear environment,18 conventionally done in an extruder. Compared to solution mixing, which requires the use of solvents, melt mixing is more economical,18 more environment friendly, and does not require a distinct processing line in a manufacturing setting.30 However, to date, the literature suggests that melt mixing does not provide the same level of dispersion as the previously mentioned advanced methods.30,31
In the production of polymer nanocomposites, Dennis et al.32 showed that an increase in the residence time during compounding promotes exfoliation, but an excessive amount of shear or back mixing causes poor dispersion. Back mixing occurs when the compounded mixture reaches the end of the extruder and is reintroduced to the beginning of the extruder for further compounding. This is commonly used in microcompounders to simulate the longer extrusion lines present in manufacturing processes. Back mixing will be present in this study. Villmow et al.33 also showed that the residence time and throughput had an effect on the dispersion of a carbon nanotubes masterbatch in a polycaprolactone matrix. They found that an increase in throughput, which corresponds to a decrease in residence time and less shear, resulted in worse dispersion and poor electrical properties33 when compared to a slower throughput. Most researchers agree that composites with well-dispersed exfoliated structures ultimately have better properties.18,34 However, significant improvements are not observed in every system, including nanoclay35 and GnP systems.36 Gong et al.36 showed that multilayer graphene was superior to single-layer graphene in reinforcing epoxy systems.
In this study, BioPBS, BC, and graphene were melt compounded, extruded, and injection molded to create hybrid bionanocomposites with superior thermo-mechanical properties compared to the neat matrix. To the best of the author’s knowledge, to date, there has been no research on the hybridization of biocarbon and graphene for composite applications. Graphene was added to the composites using two different processing methods to compare the relationship between processing conditions and the resulting properties: (I) a masterbatch technique where 25 wt % of GnPs was first compounded with BioPBS, extruded, and dried. The masterbatch was then diluted with BioPBS and re-compounded with BC to create the desired blend ratios. (II) A direct compounding technique where BioPBS, BC, and GnPs were mixed together and compounded directly. The process–structure and property relationships were explored through tensile and flexural properties, impact strength, morphology, rheology, and thermo-dimensional properties. The two different processes used could have affected the dispersion and distribution of graphene within the matrix, which resulted in different thermo-mechanical properties.
Results and Discussion
Mechanical Properties of Biocarbon basedReinforced BioPBS Biocomposites
The mechanical properties of a material, specifically the strength, stiffness, and toughness, are crucial to determine which application the material will be used in. These properties are influenced by a few parameters, namely, particle size, the particle matrix interaction, and particle loading (amount of particles).37 An increase in tensile and flexural properties is observed when BioPBS is reinforced with biocarbon, observed in red in Figure 1a,b. An increase in strength suggests good interfacial adhesion between the BioPBS matrix and the particulate filler and that the particles are able to carry load within the composite.12 This is highly dependent on effective stress transfer between the matrix and filler.38 The higher modulus of biocarbon compared to the BioPBS matrix is attributed to the increase in the composite’s stiffness.39 It can be seen that the flexural strength of the neat BioPBS was lower than the tensile strength: 34.15 MPa compared to 41.5 MPa. However, after the addition of biocarbon to the matrix, the composite’s flexural strength increased by 59%, while the composite’s tensile strength increased by 6%. This suggests that the biocarbon reinforcement is not uniaxial in nature. Flexural strength accounts for not only the tensile stresses within a material but also the compressive stresses.40 For this reason, flexural strength values are normally higher than tensile strength and are also more characteristic of everyday applied stress.40
Figure 1.
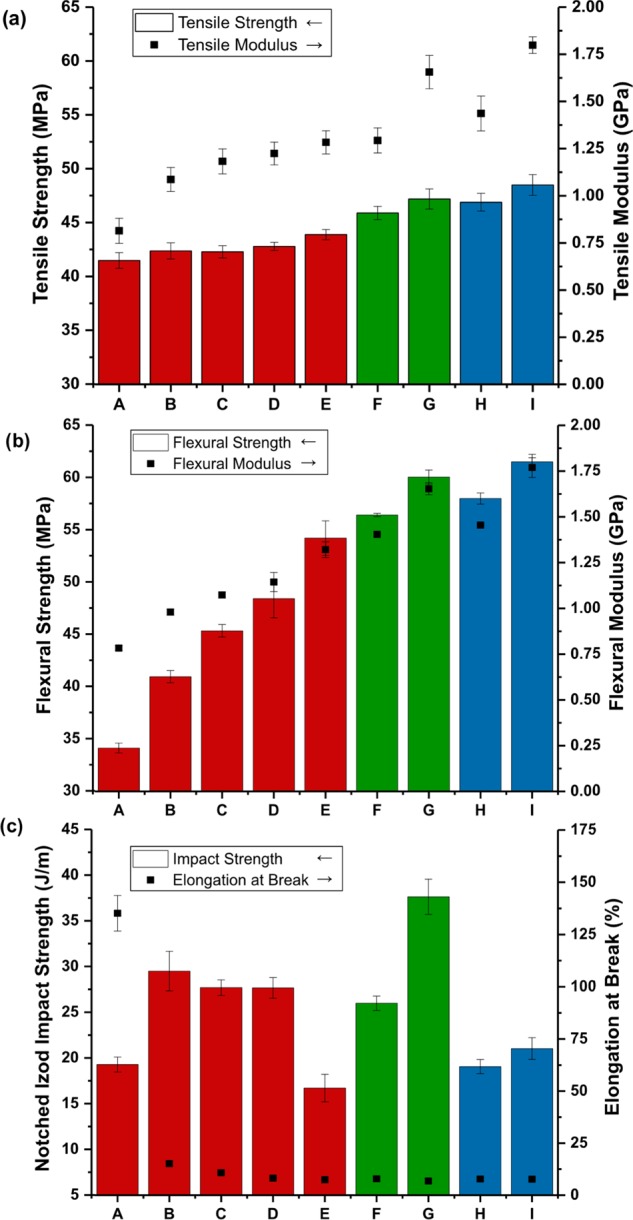
Mechanical properties of the biocomposites, (a) tensile strength and modulus, (b) flexural strength and modulus, and (c) notched Izod impact strength and elongation at break, where (A) BioPBS, (B) BioPBS/BC (90/10), (C) BioPBS/BC (85/15), (D) BioPBS/BC (80/20), (E) BioPBS/BC (75/25), (F, G) BioPBS/BC/GnP (MB) (75/24/1) and (75/20/5), respectively, and (H, I) BioPBS/BC/GnP (DC) (75/24/1) and (75/20/5), respectively.
Impact toughness corresponds to the energy absorbed by the material before failure. Biocarbon reinforcement also improved the toughness of the biocomposite, measured through impact strength, seen in Figure 1c. There is often a trade-off between strength and toughness in composites and a simultaneous increase is often not observed.6,41 Impact toughness is dependent on many factors and is a highly complicated mechanism that is often misrepresented.42 Generally, impact toughness in filler-reinforced composites can be attributed to the size of the filler, the orientation and distribution of the filler, and the adhesion between the filler and matrix.40 To improve toughness, the energy needs to be effectively transferred to the filler, enabling it to absorb said energy.40 During fracture, the crack propagates through the matrix and it is momentarily stopped, known as crack pinning, due to the heterogeneity of the filler.38 If there is good adhesion between the filler and the matrix, some of the crack energy will be transferred to the filler, leading to a tougher composite.42 Impact toughness normally decreases when fillers are added;6,43 however, it was found that the size of the filler has a large effect on the impact toughness of the composite, where smaller particles increase impact toughness.37
As shown in Figure 1c, the initial loadings of biocarbon into the BioPBS matrix resulted in increased impact strength, up until 20 wt % loading. However, above this level (25 wt %), the impact strength decreased below that of the neat BioPBS. Kumar et al.44 found that initial loading of fillers (up to 7.5% aluminum cenospheres) increased impact strength, but further loading (10%) resulted in lower impact strength. Lange and Radford45 similarly showed an epoxy–alumina trihydrate system in which the fracture energy across several sizes of alumina trihydrate particles also peaked at a certain volume fraction and decreased after that. The decrease in fracture energy after the peak is attributed to the fact that the particles are packed too closely to effectively interact with the propagating crack, reducing the effects of crack pinning.45
Mechanical Properties of Hybrid Bionanocomposites
Graphene was compounded into the composites in two different ways; this resulted in different tensile, flexural, and impact properties. Regardless of the way the graphene was compounded into the composites, the addition of graphene drastically increased the tensile and flexural properties of the composites. This was attributed to the high strength and stiffness of graphene.16 Researchers have shown that property improvement is highly dependent on processing conditions and morphology.21 However, high levels of dispersion are hard to achieve in graphene composite systems.24 The main differences in the two processes used, masterbatch (MB) and direct compounding (DC), were the increased total residence time (4 min) and initial graphene loading (25 wt %) of the MB technique. The major mechanical differences between the two compounding methods were the increased strength and stiffness seen in the DC method and the increased toughness (impact strength) seen in the MB method, MB shown in green and DC in blue in Figure 1.
Researchers found that increasing the mixing duration of compounding, equivalent to an increase in residence time in a microcompounder, almost doubled the dispersion levels of fibers from 14 to 30%.46 This was not observed in this study; this could be for several reasons. First, the initial loading of graphene in the MB was relatively high (25 wt %) compared to DC blends, which led to the formation of superclustered graphene domains. Second, GnPs display a much higher affinity to one another than fibers,47,48 leading to less dispersion. However, some researchers have shown that aggregation of fillers is actually beneficial in the reinforcing composites,49,50 claiming that a certain level of structural hierarchy may be needed to achieve the full reinforcement potential of graphene.49,50 This hierarchical structure is achieved in the MB composites through the addition of larger biocarbon particles, the graphene superclusters, as well as the smaller graphene domains. Reinforcement through aggregation is observed in this study, through the marked increase in impact strength. Superclusters of graphene were observed in the MB compounded composites, which are most likely responsible for the increased impact strength. Differences are also observed in the complex viscosity seen in rheological properties as discussed later.
Statistical Analysis
To determine if there was a significant difference between the two processing methods used, as well as the amount of graphene present in the composite, a 22 factorial design was performed on impact and tensile strength. Analysis of variance (ANOVA) was performed on the 22 factorial design.
A summary of the analysis can be seen in Table 1; full ANOVA results can be seen in Tables S2 and S3 in the supporting information. At a 95% confidence level, there is a significant difference, observed for both the processing method used and the amount of graphene added. It is interesting to note that there is a significant interaction effect between the processing method used and the amount of graphene added for impact strength only. The difference between F and Fcrit is also much larger for impact strength relative to tensile strength; P-values for impact strength are also much lower compared to tensile strength. This suggests that both factors have a more significant effect on the impact strength of the blends compared to the tensile strength.
Table 1. Summary of 22 ANOVA.
| impact
strength |
tensile
strength |
|||||
|---|---|---|---|---|---|---|
| source of variation | F | P-value | Fcrit | F | P-value | Fcrit |
| process method | 255.9819 | 2.33 × 10⁻⁷ | 5.317655 | 11.17031 | 0.004135 | 4.493998 |
| amount of graphene | 76.13656 | 2.33 × 10⁻⁵ | 5.317655 | 11.77811 | 0.003422 | 4.493998 |
| interaction | 43.17356 | 0.000175 | 5.317655 | 0.040755 | 0.842557 | 4.493998 |
Morphological Investigation of the Bionanocomposites
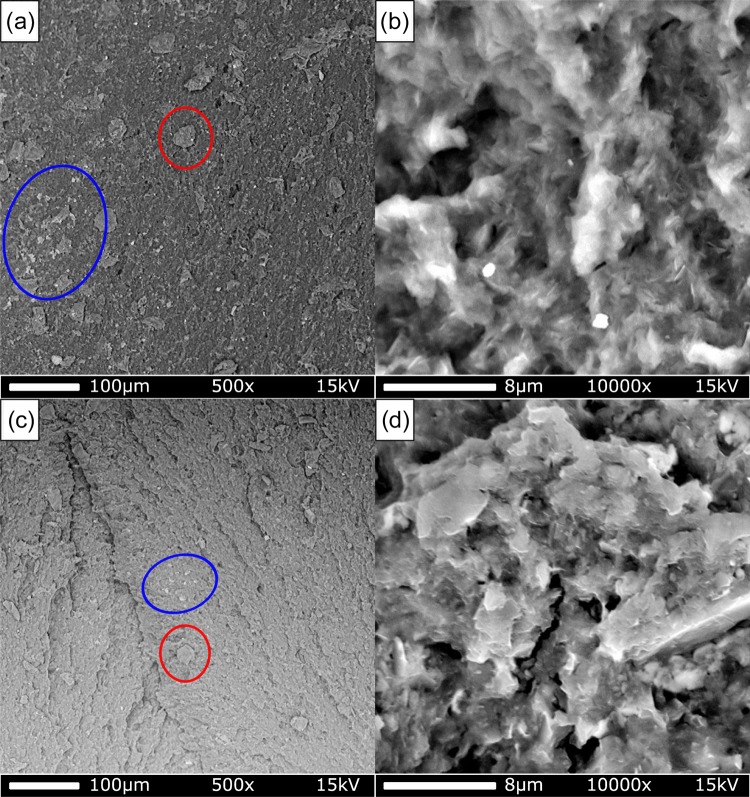
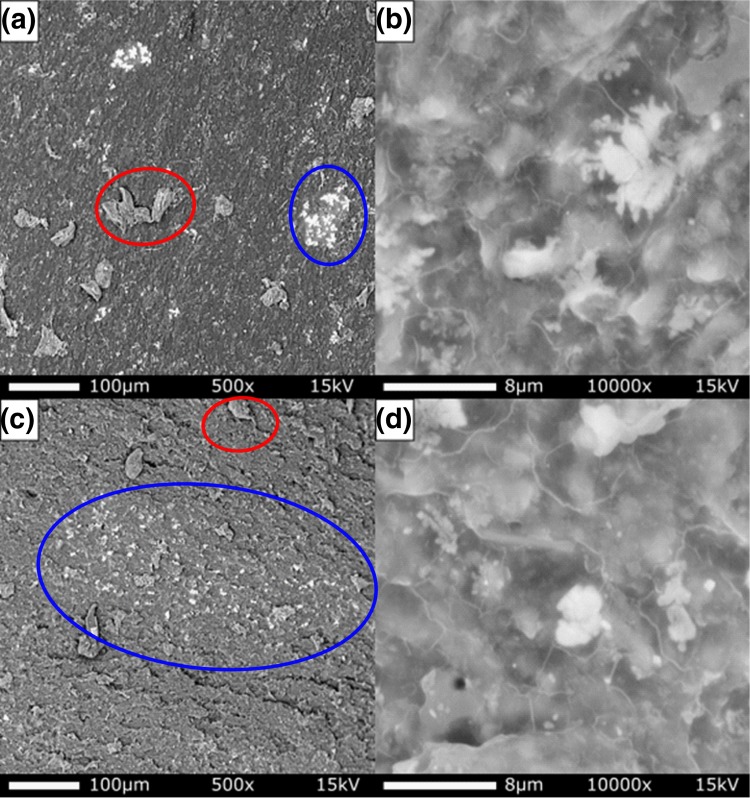
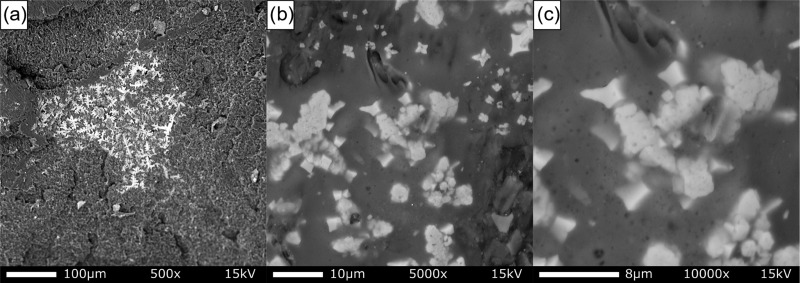
The morphology of the composites was observed through scanning electron microscopy (SEM) images of the impact fracture surface. Researchers have shown that it is possible to distinguish, based on contrast, between different qualities of carbon due to their intrinsic differences in conductivity.51 This principle was used in this study to differentiate between graphene and biocarbon, circled in blue and red, respectively, in Figures 2 and 3. The levels of dispersion of graphene throughout the matrix are clearly different between the DC composites (Figure 2) and MB composites (Figure 3). Although no quantitative analysis was conducted on the levels of dispersion, it is apparent that superclusters of graphene have formed in the MB blends, while they are not apparent in the DC blends. These superclusters were formed in the initial MB process, observed in Figure 4. These superclusters were reduced in size and dispersed substantially, more so in the 1% graphene MB composites (Figure 3c,d) compared to the 5% graphene MB composites (Figure 3a,b). It is known that the orientation of GnP and other high aspect ratio particulates has a significant effect on both the mechanical and gas barrier properties.52 Well-orientated particles, which are orientated in the same direction, often flow induced, show increased mechanical properties in a parallel direction and increased barrier properties in a perpendicular direction.52 This is observed to a slight degree locally but not in the overall morphology of the composites; this infers that there was some degree of flow-induced orientation during the extrusion process.24
Figure 2.
SEM images of the fracture surface of DC blended composites. (a) 5% GnP content, 500× magnification, (b) the same surface at 10 000× magnification, (c) 1% GnP content, 500× magnification, and (d) the same surface at 10 000× magnification. All images taken at 15 kV.
Figure 3.
SEM images of fracture surfaces of MB blended composites. (a) 5% GnP content, 500× magnification, (b) the same surface at 10 000× magnification, (c) 1% GnP content, 500× magnification, and (d) the same surface at 10 000× magnification. All images taken at 15 kV.
Figure 4.
Fracture surface morphology of the 25 wt % GnP in BioPBS masterbatch. (a) 500× magnification, (b) 5000× magnification, and (c) 10 000× magnification.
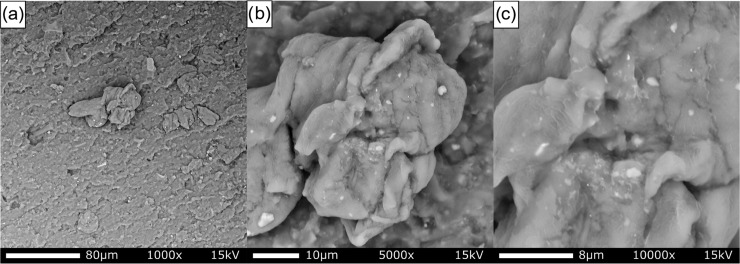
Biocarbon particles show good levels of adhesion to the surrounding matrix, as there is no particle pullout observed after impact testing.37 Graphene is also observed on the surface of biocarbon particles (Figure 5), which could also assist in adhering to the BioPBS matrix.
Figure 5.
Evidence of GnP on the surface of larger biocarbon particles. (a) 500× magnification, (b) 5000× magnification, and (c) 10 000× magnification.
Some degree of dispersion is observed in the higher magnification images of both DC and MB blends. It is interesting to note that in the 25 wt % graphene-loaded masterbatch, there is no dispersion within the supercluster domains (Figure 4a–c), suggesting that higher loading of graphene restricts dispersion.
Transmission electron microscopy (TEM) was used to further investigate the dispersion and intercalation of the graphene within the 5% MB blend. TEM revealed the structure of the superclustered graphene surrounded by the polymer matrix. The superclusters are likely made of stacked graphene platelets that have agglomerated during the extrusion process.53 In Figure 6, individual GnPs can be distinguished on the surface of the graphene aggregate, circled in blue. These platelets correspond in size with the graphene manufacturer specifications. As seen in the SEM images of the MB blends (Figures 3a,b and 4), the local area surrounding the graphene aggregate (within the supercluster) shows no evidence of dispersion or intercalation of the GnPs.
Figure 6.
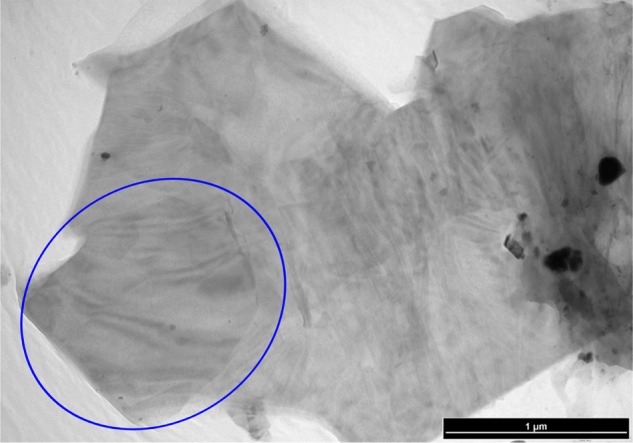
TEM image of a GnP aggregate surrounded by BioPBS matrix in the BioPBS/BC/GnP (75/20/5) MB blend.
Rheological Behavior
The flow behavior of polymer melts is of great interest to manufacturers of polymers and composites. It is important to understand the rheological behavior, as the resulting material is affected by the processing environment.23 All polymer blends showed signs of shear thinning (non-Newtonian behavior), a drop in complex viscosity associated with increased shear rates. This shear thinning is most dramatic in the DC blends, shown in blue in Figure 7. The addition of biocarbon to the BioPBS matrix increased both the complex and zero shear viscosities, while lowering the melt flow index (MFI) of the composites (Figures 7 and S1). Typically, the addition of filler to a polymer matrix increases the complex viscosity and the storage modulus of the samples due to the strong filler networks, particularly above the critical filler concentration.54 The increased complex viscosity of BioPBS/BC composites reflects the good dispersion of the biocarbon in the matrix and a strong filler–filler interaction with BioPBS chains. Moreover, the MFI of the BioPBS with 25% BC composite was higher than 10 g/10 min, which was still within acceptable limits for processing. The addition of 1% graphene did not have an outward effect on any of the rheological measurements, except in the DC composite systems where increased shear thinning is observed in the higher frequency domains of complex viscosity. It is interesting that in the DC 1% graphene composites, the zero shear viscosity decreased, while MFI increased compared to 25% BC and 1% MB composites, seen in Figure S1.
Figure 7.
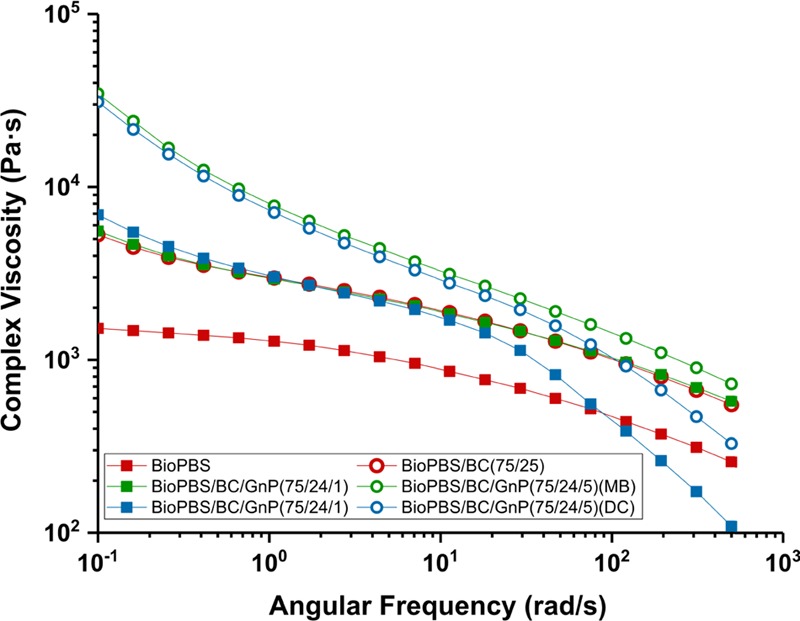
Complex Viscosity of BioPBS Composites.
Flow can have a large effect on the viscoelastic properties of polymer melts filled with anisotropic nanoparticles.55,56 The large shear strain from the induced flow can orientate the particles in the direction of flow, subsequently reducing viscosity.24 The shear thinning observed in DC composites compared to MB composites could be attributed to this phenomenon. The shear thinning observed in DC composites agrees with the observed increase in dispersion of DC composites compared to MB composites. All composites showed increased viscosity and decreased MFI compared to the BioPBS matrix, Figure S1. However, they are still within acceptable ranges for extrusion and injection molding manufacturing processes.
Thermo-Dimensional Properties
One of the main drawbacks of polymers are their high coefficient of linear thermal expansions (CLTEs) and low heat deflection temperature (HDT), which can be undesirable for many applications where materials are exposed to elevated levels of heat.37 CLTE is a measure of dimensional expansion in response to changes in heat and is calculated by the expanded thickness divided by the initial thickness: (α – α0)/α0.37 A low CLTE and a high HDT are indicative of greater thermo-dimensional stability.57 Combining polymers with more thermally stable materials has become a common strategy to increase their thermal stability. Biocarbon and nanofillers like GnPs have been shown to be effective at reducing thermal expansion.37,58
The CLTE of all composites were lower than that of the neat BioPBS matrix, Figure 8. However, the most evident reduction (32%) in CLTE was observed in the composites reinforced with 25% biocarbon content. Statistical analyses of CLTE measurements are available in the supporting information, Table S4. BC and nanofillers like GnPs have been shown to be effective at reducing thermal expansion.36,57,61 Ahmad et al.59 showed that the shape of silica particles in an epoxy matrix had a slight impact on the CLTE of the composite. Further, angular shapes, containing many sharp edges, and elongated shaped silica particles showed lower CLTE values compared to the same-sized cubic particles.59 It would then follow that the irregular shape of biocarbon is an advantageous property in reducing the CLTE of polymer composites.
Figure 8.
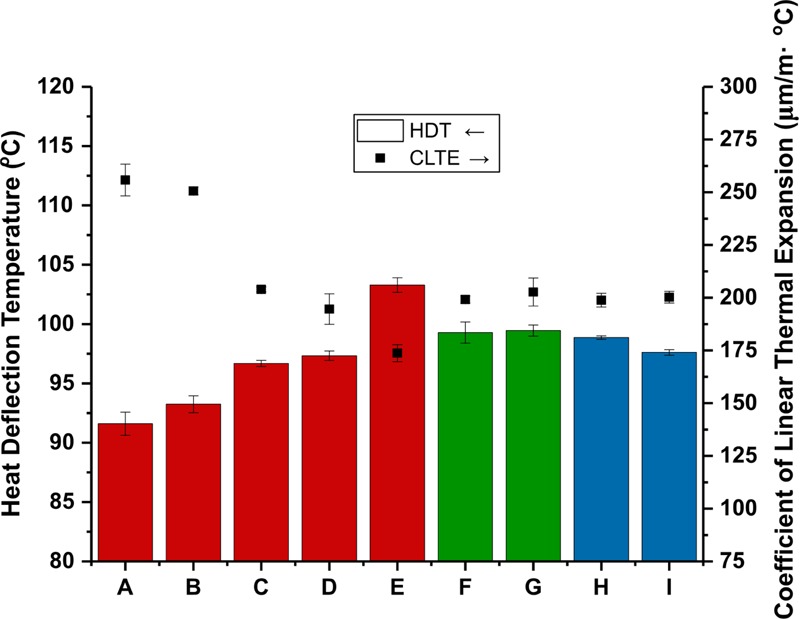
Thermo-dimensional properties, specifically, HDT and CLTE (flow direction) of BioPBS composites, where (A) BioPBS, (B) BioPBS/BC (90/10), (C) BioPBS/BC (85/15), (D) BioPBS/BC (80/20), (E) BioPBS/BC (75/25), (F, G) BioPBS/BC/GnP (MB) (75/24/1) and (75/20/5), respectively, and (H, I) BioPBS/BC/GnP (DC) (75/24/1) and (75/20/5), respectively.
The HDT is another important thermo-dimensional property; a high HDT is indicative of high thermo-dimensional stability. Similar to CLTE, the HDT of all composites increased compared to the neat BioPBS matrix, Figure 8. Again, the greatest increase (∼12 °C, 11%) was observed in the composites reinforced with 25% biocarbon content. Statistical analyses of HDT measurements are available in the supporting information, Table S4. Improvement in HDT is often attributed to the improved stiffness associated with the reinforced composites;60,61 it was expected that the addition of GnPs would further improve both the HDT and CLTE of the biocomposites.58,62 However, this was not observed in this study. Perhaps higher levels of dispersion and improved orientation of the GnPs within the matrix would result in further thermo-dimensional stability.22,63
Conclusions
BioPBS was successfully combined with biocarbon and graphene, creating a hybrid bionanocomposite. These composites had improved thermo-mechanical properties compared to neat BioPBS. Incorporating biocarbon into a bioplastic composite increases the value of this co-product. Biocomposites loaded with 25 wt % biocarbon showed 57, 13, and 32% improvements in tensile modulus, HDT, and CLTE, respectively. Further improvements were found when graphene was added to the biocomposite, forming a hierarchical hybrid bionanocomposite. Two processing methods were used to incorporate graphene in the composites: DC and MB processing techniques. The two methods resulted in different internal morphologies, which subsequently impacted the mechanical properties of the composites. However, little change was observed in the thermo-dimensional properties studied. Composites processed using the DC technique showed the greatest increase in tensile strength and modulus: 17 and 120%, respectively. Composites processed using the MB technique had slightly lower strength and modulus but almost twice the impact strength compared with DC blends. This MB technique was found to have a superior balance of stiffness and toughness likely due to the presence of superclustered graphene platelets. It is recommended that large-scale processing techniques be used to create these composites to confirm their industrial viability. It would also be interesting to add further toughing agents like bio-based glycerol, or study the electrical conductivity of the composites.
Experimental Section
Materials
Injection-grade BioPBS (PBS FZ71PM), a product of PTT MCC Biochem CO., Ltd., Thailand, was obtained from Competitive Green Technologies, Canada. The injection-grade BioPBS had a melt flow index (MFI) of 22 g/10 min at 190 °C with 2.16 kg, a density of 1.26 g/cm3, and a melting point of 115 °C. Miscanthus grass biocarbon was obtained from Genesis Industries, and the Miscanthus biocarbon was produced through a two-stage slow pyrolysis process at 500 °C and sifted to ∼6.35 mm. Once received, the biocarbon was ground in a planetary ball mill (Retsch PM100, Germany) with 50, 10 mm diameter balls at 250 rpm for 1 h, resulting in particles with an average size of 16.25 ± 14.68 μm. GnPs (Grade C) with a particle diameter of less than 2 μm, thickness of 1–5 nm, and surface area of 500 m2/g were used as received, purchased from XG Sciences, Lansing, MI, USA.
Processing of Hybrid Biocomposites
BioPBS and biocarbon were dried for 8 h at 80 and 105 °C, respectively, prior to processing. The remaining moisture content prior to processing of the BioPBS, biocarbon, and graphene was less than 0.1, 1.0, and 2.0 wt %, respectively, as determined using an infrared moisture analyzer (Sartorius MA37-1, Germany). Compounding and injection molding took place in a 15-cc co-rotating, twin-screw microcompounder paired with a 12-cc micro injection molder (Xplore Instruments, The Netherlands). Compounding was conducted at 140 °C with a screw speed of 100 rpm. Injection molding was conducted using a mold temperature of 30 °C, an injection pressure of 10 bar, and an injection time of 10 s. First, BioPBS pellets and biocarbon powder were briefly mixed together (all blends were formulated on wt % basis) by hand in BioPBS/BC wt % ratios of 90/10 through 75/25 and directly compounded for 2 min in the above conditions. Second, two different processing techniques were utilized to compound biocarbon and graphene into a BioPBS matrix to create hybrid bionanocomposites: (I) direct compounding (DC), where BioPBS, BC, and GnP were mixed by hand in ratios of 75/24/1 and 75/20/5 and compounded directly for 2 min in above conditions; (II) a masterbatch (MB) of BioPBS and graphene was prepared by compounding in the same conditions for 2 min, to form a BioPBS blend with 25 wt % GnP content. The masterbatch was then diluted with BioPBS pellets and compounded with BC again for 2 min to form the same BioPBS/BC/GnP blend ratios 75/24/1 and 75/20/5. In both processing methods, samples were injection molded immediately after the final compounding step and conditioned following ASTM D618 prior to further characterization.
Thermo-Mechanical Analysis
Tensile and flexural tests were conducted using an Instron 3382 (Instron) following ASTM D638 and D790, respectively. Impact strength of the materials was measured using a 5 ft·lb pendulum in a TMI Monitor Impact Tester (Testing Machines Inc), following ASTM D256. Samples were notched immediately after processing using a TMI Notching Cutter (Testing Machines Inc). Five samples were used for each test.
The heat deflection temperature (HDT) was determined under three-point bending following ASTM D648 using a DMA Q800 (TA Instruments). Samples were tested at a heating rate of 2 °C/min until a deflection of 250 μm was reached.
The coefficient of linear thermal expansion (CLTE) was measured using a TMA Q400 (TA Instruments), following ASTM E831. Tests were conducted in a temperature range from −60 to 100 °C at a heating rate of 5 °C/min; samples were cut to ∼6 mm × 6 mm × 3 mm. The expansion probe was set normal to the injection flow direction with an applied force of 0.05 N. Further thermal properties (available in the supporting information, Table S1) were analyzed using a DSC Q200 (TA Instruments) in a nitrogen atmosphere. First, the sample (5–10 mg) was heated to 180 °C at 10 °C/min and held for 2 min, then cooled to −60 °C at 5 °C/min and held for 2 min. This cycle was repeated to erase the thermal history of the first cycle; the second heating scan and the first cooling scan were used for analysis. Percentage crystallinity of biocomposites was calculated (Table S1) using the same method as that of Chen et al.64 Two samples were used for each test.
Rheology Analysis
Two methods were used to determine the rheological properties of the composites. First, the MFI was measured following ASTM D1238 procedure A at 190 °C under 2.16 kg. Second, frequency-dependent viscosity was determined using an MCR302 rheometer (Anton Paar GmbH, Austria); a frequency sweep was conducted from 500 to 0.1 rad/s at 150 °C. Zero shear viscosity was obtained using a Carreau regression; two samples were used for each test.
Morphological Analysis
The impact fracture surfaces of the composites were observed using scanning electron microscopy, a Phenom ProX SEM (Phenom-World, The Netherlands) with a 15 kV acceleration voltage. Prior to imaging, samples were gold sputter coated for 5 s using a 108 manual sputter coater (TED PELLA, Inc). Samples were prepared for transmission electron microscopy using a Leica RM microtome (Leica Biosystems, Germany) to cut ∼100 nm thick sections from the fracture site. A 200 kV field emission TEM (Tecnai G2 F20, FEI) was used for imaging.
Acknowledgments
The authors gratefully acknowledge financial support from the Natural Sciences and Engineering Research Council (NSERC), Canada Discovery Grants (Project # 400320 and 401111), and Collaborative Research and Development (CRD) Project # 401190, the Ontario Centres of Excellence (OCE), Canada Project # 053035 and the Competitive Green Technologies, Canada Project # 053036 through VIA—Agriculture program to carry out this research.
Supporting Information Available
The Supporting Information is available free of charge at https://pubs.acs.org/doi/10.1021/acsomega.9b01771.
Zero shear viscosity and melt flow index of all biocomposites (Figure S1); thermal data of the neat polymer and composite samples (Table S1); 22 analysis of variance of impact strength and tensile strength on GnP content and processing methods, α −0.05 (Tables S2 and S3, respectively); and two-sample t-test, assuming unequal variances, of CLTE and HDT measurements, α −0.05 (Table S4) (PDF)
The authors declare no competing financial interest.
Supplementary Material
References
- McCarthy S. P.Biodegradable Polymers. In Plastics and the Environment; Andrady A. L., Ed.; The Royal Society of Chemistry, 2005; pp 359–377. [Google Scholar]
- Mohanty A. K.; Misra M.; Hinrichsen G. Biofibres, Biodegradable Polymers and Biocomposites: An Overview. Macromol. Mater. Eng. 2000, 276–277, 1–24. 10.1002/(SICI)1439-2054(20000301)276:13.0.CO;2-W. [DOI] [Google Scholar]
- Zini E.; Scandola M. Green composites: An overview. Polym. Compos. 2011, 32, 1905–1915. 10.1002/pc.21224. [DOI] [Google Scholar]
- Zhang K.; Mohanty A. K.; Misra M. Fully Biodegradable and Biorenewable Ternary Blends from Polylactide, Poly(3-hydroxybutyrate-co-hydroxyvalerate) and Poly(butylene succinate) with Balanced Properties. ACS Appl. Mater. Interfaces 2012, 4, 3091–3101. 10.1021/am3004522. [DOI] [PubMed] [Google Scholar]
- Clark J. H.; Budarin V.; Deswarte F. E. I.; Hardy J. J. E.; Kerton F. M.; Hunt A. J.; Luque R.; Macquarrie D. J.; Milkowski K.; Rodriguez A.; Samuel O.; Tavener S. J.; White R. J.; Wilson A. J. Green Chemistry and the Biorefinery: A Partnership for a Sustainable Future. Green Chem. 2006, 8, 853–860. 10.1039/b604483m. [DOI] [Google Scholar]
- Behazin E.; Misra M.; Mohanty A. K. Sustainable Biocomposites from Pyrolyzed Grass and Toughened Polypropylene: Structure–Property Relationships. ACS Omega 2017, 2, 2191–2199. 10.1021/acsomega.7b00122. [DOI] [PMC free article] [PubMed] [Google Scholar]
- Shankar Tumuluru J.; Shahab S.; Hess J. R.; Wright C. T.; Boardman R. D. Review: A Review on Biomass Torrefaction Process and Product Properties For Energy Applications. Ind. Biotechnol. 2011, 7, 384–401. 10.1089/ind.2011.7.384. [DOI] [Google Scholar]
- Woolf D.; Amonette J. E.; Street-Perrott F. A.; Lehmann J.; Joseph S. Sustainable Biochar to Mitigate Global Climate Change. Nat. Commun. 2010, 1, 56 10.1038/ncomms1053. [DOI] [PMC free article] [PubMed] [Google Scholar]
- Uchimiya M.; Wartelle L. H.; Boddu V. M. Sorption of Triazine and Organophosphorus Pesticides on Soil and Biochar. J. Agric. Food Chem. 2012, 60, 2989–2997. 10.1021/jf205110g. [DOI] [PubMed] [Google Scholar]
- Ogunsona E. O.; Misra M.; Mohanty A. K.. Sustainable Biocomposites from Biobased Polyamide 6,10 and Biocarbon from Pyrolyzed Miscanthus Fibers J. Appl. Polym. Sci. 2017, 134 (4), 44221–44232. 10.1002/app.44221. [DOI]
- Mohanty A. K.; Vivekanandhan S.; Pin J.-M.; Misra M. Composites from Renewable and Sustainable Resources: Challenges and Innovations. Science 2018, 362, 536–542. 10.1126/science.aat9072. [DOI] [PubMed] [Google Scholar]
- Behazin E.; Misra M.; Mohanty A. K. Sustainable Biocarbon from Pyrolyzed Perennial Grasses and Their Effects on Impact Modified Polypropylene Biocomposites. Composites, Part B 2017, 118, 116–124. 10.1016/j.compositesb.2017.03.003. [DOI] [Google Scholar]
- Fedullo N.; Sorlier E.; Sclavons M.; Bailly C.; Lefebvre J.-M.; Devaux J. Polymer-based Nanocomposites: Overview, Applications and Perspectives. Prog. Org. Coat. 2007, 58, 87–95. 10.1016/j.porgcoat.2006.09.028. [DOI] [Google Scholar]
- Shearer C. J.; Slattery A. D.; Stapleton A. J.; Shapter J. G.; Gibson C. T. Accurate Thickness Measurement of Graphene. Nanotechnology 2016, 27, 125704 10.1088/0957-4484/27/12/125704. [DOI] [PubMed] [Google Scholar]
- Jang B. Z.; Zhamu A. Processing of Nanographene Platelets (NGPs) and NGP Nanocomposites: A Review. J. Mater. Sci. 2008, 43, 5092–5101. 10.1007/s10853-008-2755-2. [DOI] [Google Scholar]
- Lee C.; Wei X.; Kysar J. W.; Hone J. Measurement of the Elastic Properties and Intrinsic Strength of Monolayer Graphene. Science 2008, 321, 385–388. 10.1126/science.1157996. [DOI] [PubMed] [Google Scholar]
- Quiles-Díaz S.; Enrique-Jimenez P.; Papageorgiou D. G.; Ania F.; Flores A.; Kinloch I. A.; Gómez-Fatou M. A.; Young R. J.; Salavagione H. J. Influence of The Chemical Functionalization of Graphene on The Properties of Polypropylene-based Nanocomposites. Composites, Part A 2017, 100, 31–39. 10.1016/j.compositesa.2017.04.019. [DOI] [Google Scholar]
- Potts J. R.; Dreyer D. R.; Bielawski C. W.; Ruoff R. S. Graphene-based Polymer Nanocomposites. Polymer 2011, 52, 5–25. 10.1016/j.polymer.2010.11.042. [DOI] [Google Scholar]
- Bafana A. P.; Yan X.; Wei X.; Patel M.; Guo Z.; Wei S.; Wujcik E. K. Polypropylene Nanocomposites Reinforced With Low Weight Percent Graphene Nanoplatelets. Composites, Part B 2017, 109, 101–107. 10.1016/j.compositesb.2016.10.048. [DOI] [Google Scholar]
- Kalaitzidou K.; Fukushima H.; Drzal L. T. A New Compounding Method for Exfoliated Graphite–Polypropylene Nanocomposites With Enhanced Flexural Properties and Lower Percolation Threshold. Compos. Sci. Technol. 2007, 67, 2045–2051. 10.1016/j.compscitech.2006.11.014. [DOI] [Google Scholar]
- Potts J. R.; Shankar O.; Du L.; Ruoff R. S. Processing–Morphology–Property Relationships and Composite Theory Analysis of Reduced Graphene Oxide/Natural Rubber Nanocomposites. Macromolecules 2012, 45, 6045–6055. 10.1021/ma300706k. [DOI] [Google Scholar]
- Kalaitzidou K.; Fukushima H.; Drzal L. T. Multifunctional Polypropylene Composites Produced by Incorporation of Exfoliated Graphite Nanoplatelets. Carbon 2007, 45, 1446–1452. 10.1016/j.carbon.2007.03.029. [DOI] [Google Scholar]
- Hwang S.-H.; Kim B.-J.; Baek J.-B.; Shin H. S.; Bae I.-J.; Lee S.-Y.; Park Y.-B. Effects of Process Parameters and Surface Treatments of Graphene Nanoplatelets on The Crystallinity and Thermomechanical Properties of Polyamide 6 Composite Fibers. Composites, Part B 2016, 100, 220–227. 10.1016/j.compositesb.2016.06.062. [DOI] [Google Scholar]
- Kim H.; Macosko C. W. Processing-property Relationships of Polycarbonate/Graphene Composites. Polymer 2009, 50, 3797–3809. 10.1016/j.polymer.2009.05.038. [DOI] [Google Scholar]
- Blanco M.; Sarasua J. A.; López M.; Gonzalo O.; Marcaide A.; Muniesa M.; Fernández A. Ultrasound Assisted Extrusion of Polyamide 6 Nanocomposites Based on Carbon Banotubes. Macromol. Symp. 2012, 321–322, 80–83. 10.1002/masy.201251113. [DOI] [Google Scholar]
- Krause B.; Mende M.; Pötschke P.; Petzold G. Dispersability and Particle Size Distribution of CNTs In An Aqueous Surfactant Dispersion as a Function of Ultrasonic Treatment Time. Carbon 2010, 48, 2746–2754. 10.1016/j.carbon.2010.04.002. [DOI] [Google Scholar]
- Lecouvet B.; Sclavons M.; Bourbigot S.; Devaux J.; Bailly C. Water-assisted Extrusion as a Novel Processing Route to Prepare Polypropylene/halloysite Nanotube Nanocomposites: Structure and Properties. Polymer 2011, 52, 4284–4295. 10.1016/j.polymer.2011.07.021. [DOI] [Google Scholar]
- Chauvet M.; Sauceau M.; Fages J. Extrusion assisted by supercritical CO2: A Review on Its Application to Biopolymers. J. Supercrit. Fluids 2017, 120, 408–420. 10.1016/j.supflu.2016.05.043. [DOI] [Google Scholar]
- Park C.; Ounaies Z.; Watson K. A.; Crooks R. E.; Smith J.; Lowther S. E.; Connell J. W.; Siochi E. J.; Harrison J. S.; Clair T. L. S. Dispersion of Single wall Carbon Nanotubes by In Situ Polymerization Under Sonication. Chem. Phys. Lett. 2002, 364, 303–308. 10.1016/S0009-2614(02)01326-X. [DOI] [Google Scholar]
- Istrate O. M.; Paton K. R.; Khan U.; O’Neill A.; Bell A. P.; Coleman J. N. Reinforcement in Melt-Processed Polymer–Graphene Composites at Extremely Low Graphene Loading Level. Carbon 2014, 78, 243–249. 10.1016/j.carbon.2014.06.077. [DOI] [Google Scholar]
- Kim H.; Miura Y.; Macosko C. W. Graphene/Polyurethane Nanocomposites for Improved Gas Barrier and Electrical Conductivity. Chem. Mater. 2010, 22, 3441–3450. 10.1021/cm100477v. [DOI] [Google Scholar]
- Dennis H. R.; Hunter D. L.; Chang D.; Kim S.; White J. L.; Cho J. W.; Paul D. R. Effect of Melt Processing Conditions on the Extent of Exfoliation in Organoclay-based Nanocomposites. Polymer 2001, 42, 9513–9522. 10.1016/S0032-3861(01)00473-6. [DOI] [Google Scholar]
- Villmow T.; Kretzschmar B.; Pötschke P. Influence of Screw Configuration, Residence Time, and Specific Mechanical Energy in Twin-Screw Extrusion of Polycaprolactone/Multi-walled Carbon Nanotube Composites. Compos. Sci. Technol. 2010, 70, 2045–2055. 10.1016/j.compscitech.2010.07.021. [DOI] [Google Scholar]
- Hussain F.; Hojjati M.; Okamoto M.; Gorga R. E. Review article: Polymer-Matrix Nanocomposites, Processing, Manufacturing, and Application: An Overview. J. Compos. Mater. 2006, 40, 1511–1575. 10.1177/0021998306067321. [DOI] [Google Scholar]
- Ray S. S.; Yamada K.; Okamoto M.; Fujimoto Y.; Ogami A.; Ueda K. New Polylactide/Layered Silicate Nanocomposites. 5. Designing of Materials with Desired Properties. Polymer 2003, 44, 6633–6646. 10.1016/j.polymer.2003.08.021. [DOI] [Google Scholar]
- Gong L.; Young R. J.; Kinloch I. A.; Riaz I.; Jalil R.; Novoselov K. S. Optimizing the Reinforcement of Polymer-Based Nanocomposites by Graphene. ACS Nano 2012, 6, 2086–2095. 10.1021/nn203917d. [DOI] [PubMed] [Google Scholar]
- Codou A.; Misra M.; Mohanty A. K. Sustainable Biocarbon Reinforced Nylon 6/Polypropylene Compatibilized Blends: Effect of Particle Size and Morphology on Performance of the Biocomposites. Composites, Part A 2018, 112, 1–10. 10.1016/j.compositesa.2018.05.018. [DOI] [Google Scholar]
- Fu S.-Y.; Feng X.-Q.; Lauke B.; Mai Y.-W. Effects of Particle Size, Particle/matrix Interface Adhesion and Particle Loading on Mechanical Properties of Particulate–polymer Composites. Composites, Part B 2008, 39, 933–961. 10.1016/j.compositesb.2008.01.002. [DOI] [Google Scholar]
- Behazin E.; Ogunsona E.; Rodriguez-Uribe A.; Mohanty A. K.; Misra M.; Anyia A. O. Mechanical, Chemical, and Physical Properties of Wood and Perennial Grass Biochars for Possible Composite Application. BioResources 2015, 11, 15. 10.15376/biores.11.1.1334-1348. [DOI] [Google Scholar]
- Nagarajan V.; Mohanty A. K.; Misra M. Biocomposites with Size-Fractionated Biocarbon: Influence of the Microstructure on Macroscopic Properties. ACS Omega 2016, 1, 636–647. 10.1021/acsomega.6b00175. [DOI] [PMC free article] [PubMed] [Google Scholar]
- Móczó J.; Pukánszky B. Polymer Micro and Nanocomposites: Structure, Interactions, Properties. J. Ind. Eng. Chem. 2008, 14, 535–563. 10.1016/j.jiec.2008.06.011. [DOI] [Google Scholar]
- Rothon R.; DeArmitt C.. Fillers (Including Fiber Reinforcements). In Brydson’s Plastics Materials, 8th ed.; Gilbert M., Ed.; Butterworth-Heinemann, 2017; Chapter 8, pp 169–204. [Google Scholar]
- Lu H.; Chen Z.; Ma C. Bioinspired Approaches for Optimizing The Strength and Toughness of Graphene-based Polymer Nanocomposites. J. Mater. Chem. 2012, 22, 16182–16190. 10.1039/c2jm32763e. [DOI] [Google Scholar]
- Kumar D. V. R.; Seenappa; Asha P. B.; Rao C. R. P. Influence Of Percent Filler On Tensile Strength, Impact Strength And Wear Properties Of The Al7075-Cenosphere Composite. Mater. Today: Proc. 2018, 5, 11697–11708. 10.1016/j.matpr.2018.02.139. [DOI] [Google Scholar]
- Lange F. F.; Radford K. C. Fracture Energy of an Epoxy Composite System. J. Mater. Sci. 1971, 6, 1197–1203. 10.1007/BF00550091. [DOI] [Google Scholar]
- Zhuang H. Relationship Between Fiber Degradation and Residence Time Distribution in the Processing of Long Fiber Reinforced Thermoplastics. eXPRESS Polym. Lett. 2008, 2, 560–568. 10.3144/expresspolymlett.2008.68. [DOI] [Google Scholar]
- Dasari B. L.; Nouri J. M.; Brabazon D.; Naher S. Graphene and Derivatives – Synthesis Techniques, Properties and Their Energy Applications. Energy 2017, 140, 766–778. 10.1016/j.energy.2017.08.048. [DOI] [Google Scholar]
- Boukhvalov D. W.; Katsnelson M. I. A New Route Towards Uniformly Functionalized Single-layer Graphene. J. Phys. D: Appl. Phys. 2010, 43, 175302 10.1088/0022-3727/43/17/175302. [DOI] [Google Scholar]
- Akcora P.; Kumar S. K.; Moll J.; Lewis S.; Schadler L. S.; Li Y.; Benicewicz B. C.; Sandy A.; Narayanan S.; Ilavsky J.; Thiyagarajan P.; Colby R. H.; Douglas J. F. “Gel-like” Mechanical Reinforcement in Polymer Nanocomposite Melts. Macromolecules 2010, 43, 1003–1010. 10.1021/ma902072d. [DOI] [Google Scholar]
- Akcora P.; Liu H.; Kumar S. K.; Moll J.; Li Y.; Benicewicz B. C.; Schadler L. S.; Acehan D.; Panagiotopoulos A. Z.; Pryamitsyn V.; Ganesan V.; Ilavsky J.; Thiyagarajan P.; Colby R. H.; Douglas J. F. Anisotropic Self-assembly of Spherical Polymer-grafted Nanoparticles. Nat. Mater. 2009, 8, 354. 10.1038/nmat2404. [DOI] [PubMed] [Google Scholar]
- Jozwik I.; Baranowski J. M.; Grodecki K.; Dabrowski P.; Strupinski W. Conductivity Contrast in SEM Images of Hydrogenated Graphene Grown on SiC. Microsc. Microanal. 2015, 21, 31–32. 10.1017/S1431927615000951.26227696 [DOI] [Google Scholar]
- Hull D.; Clyne T. W.. An Introduction to Composite Materials; 2nd ed.; Cambridge University Press: Cambridge, 1996. [Google Scholar]
- Botta L.; Scaffaro R.; Sutera F.; Mistretta M. C. Reprocessing of PLA/Graphene Nanoplatelets Nanocomposites. Polymers 2018, 10, 18. 10.3390/polym10010018. [DOI] [PMC free article] [PubMed] [Google Scholar]
- Leonov A. I. On the Rheology of Filled Polymers. J. Rheol. 1990, 34, 1039–1068. 10.1122/1.550109. [DOI] [Google Scholar]
- Du F.; Scogna R. C.; Zhou W.; Brand S.; Fischer J. E.; Winey K. I. Nanotube Networks in Polymer Nanocomposites: Rheology and Electrical Conductivity. Macromolecules 2004, 37, 9048–9055. 10.1021/ma049164g. [DOI] [Google Scholar]
- Krishnamoorti R.; Banik I.; Xu L. Rheology and Processing of Polymer Nanocomposites. Rev. Chem. Eng. 2010, 26, 3. 10.1515/REVCE.2010.003. [DOI] [Google Scholar]
- Kim Y.; Kwon O. H.; Park W. H.; Cho D. Thermomechanical and Flexural Properties of Chopped Silk Fiber-Reinforced Poly(butylene Succinate) Green Composites: Effect of Electron Beam Treatment of Worm Silk. Adv. Compos. Mater. 2013, 22, 437–449. 10.1080/09243046.2013.843830. [DOI] [Google Scholar]
- Gao Y.; Picot O. T.; Bilotti E.; Peijs T. Influence of Filler Size on the Properties of Poly(lactic acid) (PLA)/Graphene Nanoplatelet (GNP) Nanocomposites. Eur. Polym. J. 2017, 86, 117–131. 10.1016/j.eurpolymj.2016.10.045. [DOI] [Google Scholar]
- Ahmad F. N.; Jaafar M.; Palaniandy S.; Azizli K. A. M. Effect of Particle Shape of Silica Mineral on the Properties of Epoxy Composites. Compos. Sci. Technol. 2008, 68, 346–353. 10.1016/j.compscitech.2007.07.015. [DOI] [Google Scholar]
- Nanda M. R.; Misra M.; Mohanty A. K. Performance Evaluation of Biofibers and Their Hybrids as Reinforcements in Bioplastic Composites. Macromol. Mater. Eng. 2013, 298, 779–788. 10.1002/mame.201200112. [DOI] [Google Scholar]
- Muthuraj R.; Misra M.; Mohanty A. K. Injection Molded Sustainable Biocomposites From Poly(butylene succinate) Bioplastic and Perennial Grass. ACS Sustainable Chem. Eng. 2015, 3, 2767–2776. 10.1021/acssuschemeng.5b00646. [DOI] [Google Scholar]
- Manias E.; Touny A.; Wu L.; Strawhecker K.; Lu B.; Chung T. C. Polypropylene/Montmorillonite Nanocomposites. Review of the Synthetic Routes and Materials Properties. Chem. Mater. 2001, 13, 3516–3523. 10.1021/cm0110627. [DOI] [Google Scholar]
- Fang H.; Bai S.-L.; Wong C. P. Microstructure Engineering of Graphene Towards Highly Thermal Conductive Composites. Composites, Part A 2018, 112, 216–238. 10.1016/j.compositesa.2018.06.010. [DOI] [Google Scholar]
- Chen R.-Y.; Zou W.; Zhang H.-C.; Zhang G.-Z.; Yang Z.-T.; Jin G.; Qu J.-P. Thermal Behavior, Dynamic Mechanical Properties and Rheological Properties of Poly(butylene succinate) Composites Filled With Nanometer Calcium Carbonate. Polym. Test. 2015, 42, 160–167. 10.1016/j.polymertesting.2015.01.015. [DOI] [Google Scholar]
Associated Data
This section collects any data citations, data availability statements, or supplementary materials included in this article.


