Abstract
Background:
Periodontitis is an example of persistent low-grade disease. The primary cause for the disease is anaerobic gram-negative bacteria thriving in a protective biofilm in subgingival periodontal pockets. The treatment of this infection is removal of these deposits by mechanical instrumentation (Phase I therapy). This can help achieve reduction of the bacterial load thus suppressing localized inflammation. Phase I therapy or mechanical debridement of the subgingival area causes a severe transient bacteremia along with some damage to the surrounding soft tissue, resulting in a systemic inflammatory response being elicited. The objective of the current study was to comparatively assess periodontal parameters, serum C-reactive protein (CRP) levels, and transitory alterations in hematological parameters; in 30-systemically healthy patients having chronic periodontitis, before and after Phase I therapy.
Materials and Method:
The individuals underwent an intensive session of mechanotherapy with ultrasonic scalers. Blood samples were taken before treatment and at 1, 7, and 30 days after treatment to assess the parameters.
Results:
There was a clear recuperation in periodontal parameters as well as marked improvement in the values of CRP and complete blood count (CBC) by 30 days after transient alterations occurring initially.
Conclusion:
Phase I (mechanotherapy) – the first step in treatment of periodontitis leads to transient bacteremia by systemic dispersal of bacteria harbored in dental plaque. This produces an acute-phase response resulting in variations in the levels of CRP and the CBC counts. After a month, both periodontal and hematological parameters show marked improvement, thus establishing periodontal health and decreasing the risk of inadvertent cardiovascular or thromboembolic episode.
Keywords: Bacteremia, Blood, C-reactive protein, Inflammatory response, Periodontitis, Phase I therapy
INTRODUCTION
Periodontal disease is a common infectious disease affecting humans. It represents an excellent model of chronic infection characterized by gingival inflammation, as well as loss of tissues adjoining the teeth causing tooth loss.[1]
Nonsurgical periodontal therapy is the first step in the treatment procedure aimed at eliminating etiological factors of gingival and periodontal diseases. This results in halting of disease progression,[2] which is clinically evident as decreased gingival bleeding, improved plaque score, reduction in probing pocket depth (PPD), and improved clinical attachment level (CAL).[3]
Routinely while performing the nonsurgical therapy, inadvertent injury occurs which damages an intact gingival tissue barrier, allowing the bacterial ingress to the systemic circulation and causing transient bacteremia.[4,5] This triggers a local and systemic response of various pro-inflammatory cytokines such as tumor necrosis factor–α (TNF-α), interleukins (IL), and acute-phase proteins.[6]
Acute-phase proteins are inflammatory proteins which increase by about 25% following the initiation of inflammation. C-reactive protein (CRP) is one such acute-phase protein which serves as a systemic marker of inflammation.[6] CRP values increase significantly from basal levels in ng/ml range to be in the mg/ml range. These changes have a duration of around 72 h.[7,8] The acute-phase response is a nonspecific response as a result of physiological and metabolic changes which occur immediately after the start of tissue injury or infection. Both increases and decreases in synthesis of various proteins are seen due to the changes in their production by hepatocytes, at differing rates and to different degrees. Synthesis of albumin, transthyretin, transferrin, alpha-fetoprotein, and α-2 h glycoprotein diminishes; thus, they are called the “negative” acute-phase proteins. Ceruloplasmin and a number of complement components, including C3 and C4, display only slight elevation (50%) and are thus referred to as modest “positive” acute-phase proteins. While concentrations of a number of proteins including haptoglobin, α-1 protease inhibitor, α-1 antichymotrypsin and fibrinogen usually increase two to five fold ; levels of C-reactive protein (CRP) and serum amyloid A (SAA) can increase up to a thousand fold. Thus, these two are the major ‘positive’ human acute phase proteins.[9,10] Diagram 1.[10]
Diagram 1.
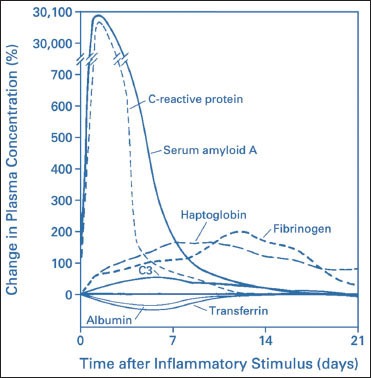
Patterns of change in plasma concentrations of some acute-phase proteins after a moderate inflammatory stimulus
In response to this, a plethora of changes act in harmony to neutralize the inflammatory mediator and ultimately result in tissue healing.[7,8] One such change hematologically seen in the earliest stages is an initial sharp fall in the leukocyte numbers attributed to peripheral vascular margination and shift of neutrophils from circulating to tissue pool followed by a rise later.[7,8,11,12] A tendency towards a mild anemic status developing post intense periodontal therapy has also been reported in patients with periodontitis.[7]
Many experimental models have been proposed over the years to study the effects of acute inflammation in vivo such as the vaccination model, the physical training model, and the most known and adopted – the endotoxin model.[7] In all these reported prototypes, the systemic inflammatory response has been measured through variations in values of well-recognized serological marker CRP as well as hematological parameters.[7]
MATERIALS AND METHODS
The present study was planned as a prospective single-blind intervention trial with a 1-month follow-up. The ethical clearance for the study was obtained from the review board at the State Government University of Health Sciences.
A sample size of 30 patients with chronic generalized periodontitis aged between 30 and 64 years (Male - 22:Female - 8) were selected from the outpatient department of periodontics.
The sample estimation was done as per the formula by Daniel, 1999 which is:
n = Z2 P(1 − P)/d2
Where n = sample size, Z = Z statistic for a level of confidence, P = expected prevalence or proportion.
(in proportion of one; if 20%, P = 0.2), and d = precision (in proportion of one; if 5%, d = 0.05).
Z statistic (Z): For the level of confidence of 95%, Z = 1.96.
The patients’ selection was done as per the following criteria:
Chronic generalized periodontitis patients with pocket probing depth ≥6 mm and evidence of 30% or more marginal alveolar bone loss
Patients who consented to willingly follow the endorsed plaque control and follow-up routine.
Exclusion criteria were as follows:
Patients having evidence of systemic diseases such as diabetes mellitus or cardiovascular, kidney, liver, lung disease, arthritis, Crohn's disease
Smokers or former smokers
Treatment with any medication such as nonsteroidal anti-inflammatory drugs or antibiotics (in the preceding 3 months) known to affect levels of serum inflammatory markers
Pregnant/lactating females.
All individuals had signed a consent form to willingly participate in the study. Recordings for full mouth (six point periodontal probing and charting), was done for all participants along with orthopantomograph to confirm radiographic bone loss. All teeth with hopeless prognosis were extracted.
The periodontal parameters evaluated at baseline and 1-month post-therapy were gingival index (GI), plaque index (PI), probing pocket depth (PPD), and clinical attachment levels (CALs) [Figure 1]. Serum inflammatory marker CRP and complete blood counts (CBCs) were also assessed before therapy, on day one, after 1 week, and 1 month after treatment.
Figure 1.
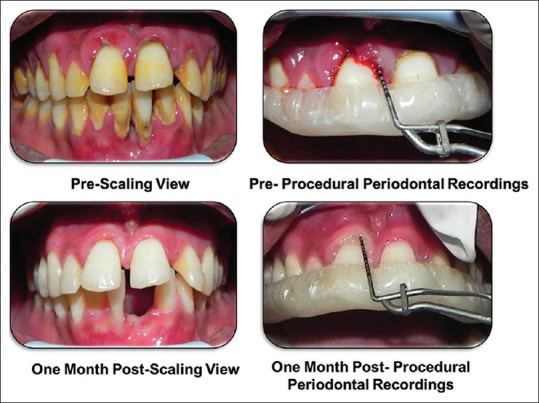
Preoperative and postoperative clinical picture
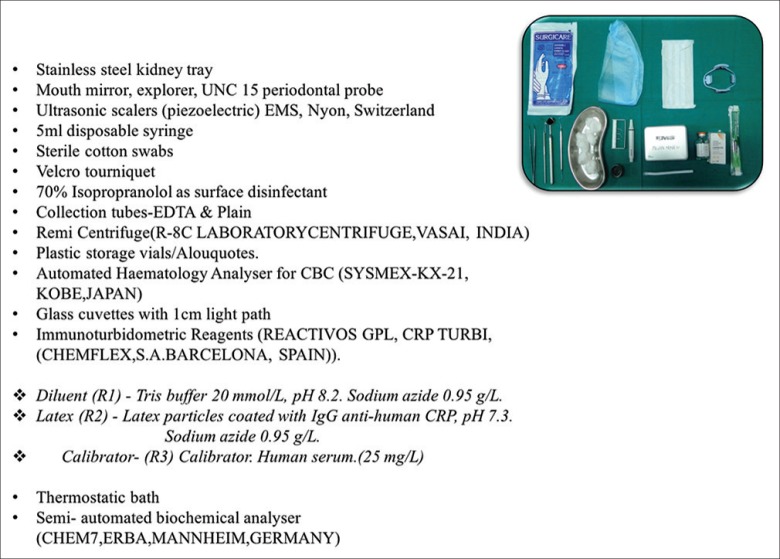
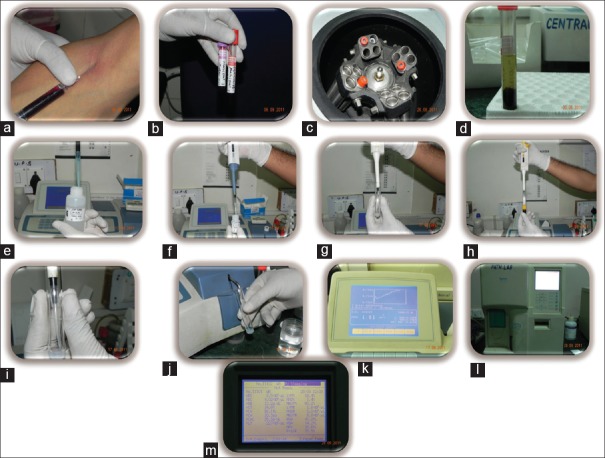
The individuals were selected after determining the body mass index which had to be 26 ± 4 kg/m2.[7] They were then referred to the central laboratory of our medical college hospital for collection of nonfasting blood samples for the estimation of hematological and biochemistry parameters. Blood samples were taken before treatment. Analysis of blood samples included – using 2ml (EDTA) for complete blood cell Count(CBC), differential count and haematocrit -which were done using an automated haematology analyser [SYSMEX-KX 21, (Kobe, Japan)]; while 4ml of blood was used as clot sample for biochemistry parameters. The clot sample was left to stand for 30 min before centrifugation. These serum samples were subsequently centrifuged at 3500 r.p.m. for 15 min using REMI Centrifuge (Vasai, India). The serum obtained was then carefully removed and taken in a glass cuvette with 1 cm light path. The serum was used for assessment of total CRP values using the commercial latex kit (REACTIVOS GPL, CRP TURBI (CHEMFLEX, S. A. Barcelona, Spain) with the help of a semi-automated biochemical analyzer (CHEM-7, ERBA, Mannheim, Germany) [Figure 2]. Hemolyzed, lipemic, or icteric samples were not used. The individuals thereafter received a single intensive session[7] of subgingival mechanical instrumentation (under local anaesthesia if required) with ultrasonic (piezoelectric scalers - EMS, Nyon, Switzerland). Extraction of hopeless teeth was done in the same session of intense periodontal therapy in accordance of standard clinical practice. Instructions for oral hygiene maintenance were given to the patients. Blood samples were taken again at day one, 1 week, and 1 month after treatment [Figure 3].
Figure 2.
Armamentarium
Figure 3.
(a) Blood draw, (b) Blood separated for haemetological and serological analysis, (c) Cetrifiguation for serum separation, (d) Serum separated, (e, f, g) Reagents 1&2 for CRP analysis mixed in tube, (h, i) Serum aspirated and added to reagent mix, (j) Sample loaded for CRP analysis, (k) CRP levels displayed as graph and values on machine display, (l) Automated Haematology analyzer. (m) Haemetological counts displayed on analyzer
Statistical analysis data were reported as means ± standard deviation (SD) for normally distributed variables or as median and interquartile ranges. The statistical analysis for the periodontal parameters was done using a “Paired–t-test” for comparisons at two different time intervals. The biochemical and hematological values were assessed using nonparametric test–”Friedman ANOVA” followed by a post hoc comparison between values using “Wilcoxon signed rank sum test.” The value of alpha was fixed at 0.05. If significance value P < 0.05, then we can say that there is significant difference between the mean value of two groups at 95% confidence level (mark as*) and if P < 0.01, in that case, the significance level will be 99% (mark as**); otherwise (P > 0.05), mean difference is considered as nonsignificant (without star). The statistical analysis was completed by means of statistical package for social sciences Version 19.0 (IBM, USA) statistical analysis software. The values were denoted as numbers (%) and mean ± SD.
RESULTS
The study included 30 patients 22 males and 8 females of Asian-Indian origin with an average age of 30–64 years. With the exception of the presence of severe, generalized periodontitis, all individuals were medically healthy. The patients remained healthy and stable during the study period with no changes in their lifestyles such as diet, physical activity, habit, and medication.
Periodontal parameters [Table 1]
Table 1.
Periodontal Parameters Pre and Post Treatment
| Baseline | 1 month | P | |
|---|---|---|---|
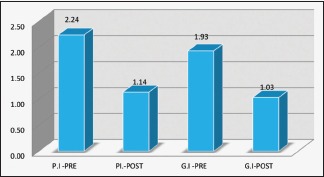
| Plaque Index | 2.24 | 1.14 | <0.001** |
| Gingival Index | 1.93 | 1.03 | <0.001** |
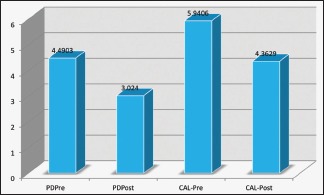
| Probing Depth (mm) | 4.4903 | 3.024 | <0.001** |
| Clinical Attachment Level (mm) | 5.9406 | 4.3629 | <0.001** |
Values expressed as means +/- SD, **P<0.001, Paired –t Test. ** highly significant
The mean baseline plaque score (PI) was 2.4 ± 0.32, and the gingival score (GI) was 1.93 ± 0.35 which showed marked improvement 1 month later – PI (1.14 ± 0.16) and GI (1.03 ± 0.07) (P < 0.0001, paired t-test) [Graph 1]. The PPD reduced from 4.49 ± 0.65 to 3.02 ± 0.8 and CAL improved from 5.94 ± 0.88 to 4.36 ± 0.9 (P < 0.0001, paired t-test) [Graph 2]. The patients had at least six teeth in each quadrant, and an average of 2 ± 1 tooth was extracted on the day of intense periodontal therapy.
Graph 1.
Plaque index and gingival index
Graph 2.
Probing depth and clinical attachment level
Serological parameters [Table 2]
Table 2.
CRP values and Blood Counts Before and After Periodontal Therapy
| Blood parameter | Baseline | 1 Day | 1 Week | 1 Month | P |
|---|---|---|---|---|---|
| CRP (mg/l) | 1.17 | 7.18 | 2.12 | 0.89 | <0.001** |
| TLC (109/l) | 7353.33 | 7376.67 | 7016.67 | 6666.67 | <0.001** |
| L (109/l) | 30.90 | 25.90 | 30.03 | 33.80 | 0.001** |
| N (109/l) | 63.63 | 68.33 | 64.70 | 60.97 | <0.001** |
| M (109/l) | 3.10 | 3.60 | 2.50 | 2.63 | 0.315(ns) |
| E (109/l) | 2.97 | 2.03 | 1.83 | 2.07 | <0.001** |
| RBC (1012/l) | 4.65 | 4.74 | 4.42 | 4.91 | <0.001** |
| PLT (109/l) | 2.44 | 2.33 | 2.38 | 2.14 | <0.001** |
CRP – C-reactive protein; E – eosinophils; L – lymphocytes; M – monocytes; N – neutrophils; PLT – platelets; RBC – red cell count; TLC – total leukocyte count. Friedman ANOVA *P<0.05, **P<0.01 Wilcoxon post-hoc rank-sum paired test vs. baseline
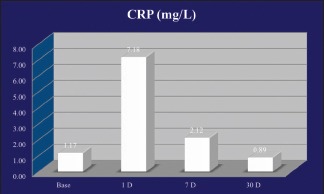
Substantial variations in concentrations of CRP were observed over baseline, and 1, 7, and 30 days post-therapy ([P < 0.001**], Friedman ANOVA). From baseline levels of 1.17 ± 0.96 mg/l, there was a significant increase in the value on day 1 Wilcoxon signed rank test. CRP levels stayed notably higher compared to baseline at 1-week interval (2.12 ± 2.08 mg/l) and decreased below baseline value 1 month (0.89 ± 0.9) after therapy [Graph 3].
Graph 3.
C-reactive protein levels
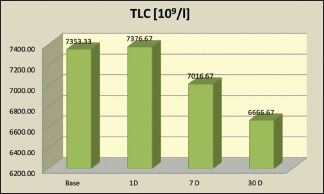
Hematological parameters [Table 2]: Initial variations such as the increase in total leukocyte count (TLC) was observed [Graph 4]. On day 1, there was a slight increase in the TLC numbers (P = 0.012*), a significant increase in the neutrophil numbers (P < 0.001**) and monocyte numbers (P < 0.001**) whereas a decrease was seen in the lymphocyte numbers (P < 0.001**) along with the eosinophil count (P = 0.001**). The total values of TLC and individual leukocyte count settled well below the baseline level at the end of 1 month (P < 0.0001, Wilcoxon signed rank sum test) [Graph 5].
Graph 4.
Total leukocyte count
Graph 5.
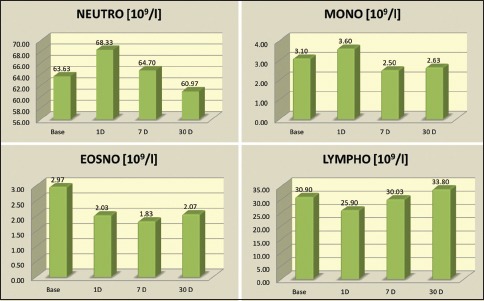
Differential leukocyte count
The erythrocyte numbers and hematocrit levels also showed variations. There is a slight increase in the total number of red blood cell (RBC) [Graph 6] along with the values of RBC indices of packed cell volume (PCV), hemoglobin (Hb), mean corpuscular Hb (MCH), mean corpuscular volume (MCV), MCH concentration (MCHC) on day 1 (P < 0.001**), followed by a significant drop by 1 week (P < 0.001**), and settling significantly above the baseline levels by 1 month (P = 0.003**/P < 0.001**) [Graph 7].
Graph 6.
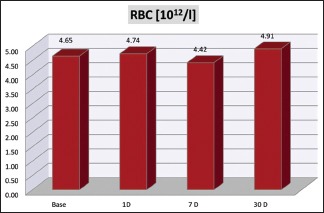
Red blood cell count
Graph 7.
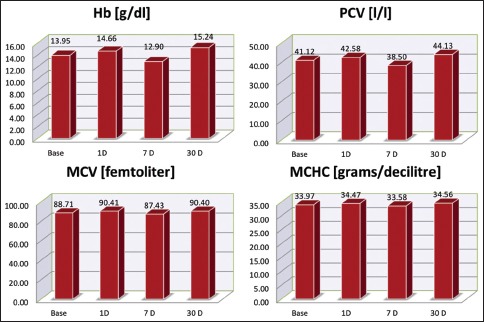
Red blood cell indices’ levels. RBC – Red blood cells, Hb – Haemoglobin, PCV – Packed cell volume, MCV – Mean corpuscular volume, MCHC – Mean corpuscular haemoglobin concentration
There is a slight decrease in the platelet count (PLT) on day 1 (P < 0.001**), followed by a slight rise by 1 week (P = 0.145 [ns]) and settling below the baseline levels by 1 month (P < 0.001**) [Graph 8].
Graph 8.
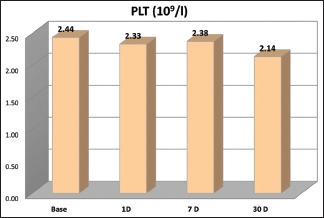
Platelet count
DISCUSSION
The current study was conducted to assess the consequence of a single session intensive periodontal treatment regimen in chronic periodontitis patients on the clinical, biochemical, and hematological parameters subsequent to nonsurgical periodontal therapy.[7]
The reduction in plaque scores can be attributed to good plaque control and maintenance of oral hygiene, which in turn resulted in the reduced gingival score.[13,14] The reduction in the PPD and improvements in CALs can be attributed to the diminished size of inflammatory component following intense periodontal therapy.[15,16,17]
CRP levels rose to about 10 times by 1 day and settled below baseline levels 30 days post-therapy. All these intense fluctuations obeyed the definitive pattern of the classic acute-phase marker escalating during 24 h and a declining subsequently. This pattern possibly coordinates with the rising and declining IL-6 concentration which is one of the main promoters of CRP production.[1,6,7,18,19]
Alterations in differential values of leukocyte were detected 1-day posttherapy. A substantial decrease in the neutrophil and monocyte counts was observed, while the lymphocytes and eosinophils increased slightly by 1 month. The granulocytes and platelets could be considered as the “positive” acute-phase reactants, whereas the red cells would be the “negative” reactants.[9,10]
The earliest changes observed in the TLC values during the first 24 h may well be related to the activation of TNF and IL-1, which are stated to stimulate the discharge of granulocyte monocyte colony-stimulating factor (GM-CSF) and/or granulocyte CSF (G-CSF). These factors are discharged from a variety of cells such as endothelial cells, peritoneal mesothelial and endothelial cells, fibroblasts, T-lymphocytes, cultured marrow stromal cells, and monocytes. Augmented production of GM-CSF and G-CSF results in myeloid hyperplasia inside the bone marrow and persistent upsurge in neutrophil production and also increase in the number of monocytes.[9,10]
Granulocytosis is commonly a primary and persistent outcome in situations accompanying with the acute-phase response. Endogenous glucocorticoids formed initially through the acute-phase response cause leukocytosis using this mechanism. Granulopoiesis and granulocytosis also contribute to the transient rise in TLC numbers. Hence, it can safely be assumed that our individuals also would be showing increased number of leukocytes at the baseline level which is in accordance to the phenomenon known as “dose response” that is an upsurge in the peripheral numbers of white blood cells (primarily neutrophils) which is directly proportional to the amount of bacteremia present.[7,9,10,11,20,21] The TLC number was found to reduce significantly after 1-month interval.[7,11] In an acute inflammatory response, the amount of circulating monocytes rises, and their production is controlled by humoral factor - factor increasing monocytopoiesis (FIM).[21,22] FIM is produced and released by macrophages. It is a monokine that acts as a long-range controller to beckon the bone marrow to produced additional monocytes during an acute demand for more monocytes and macrophages.[23]
There was a decrease in RBC counts along with the indices of PCV, Hb, MCV, and MCHC levels, indicating a transient mild normocytic, anemia, which resolved and the RBC counts and associated indices improved by 1 month. Anemia of chronic disease (ACD),[24,25,26,27] also termed anemia of inflammation (AI),[28] is portrayed by hypoferremia as a result of iron sequestration that ultimately causes iron-restricted erythropoiesis. Chronic periodontitis patients already show signs of ACD as compared to healthy controls.[29,30] The cytokine stimulated overproduction of the iron-regulatory hormone hepcidin results in iron sequestration. Hepcidin is produced by hepatocytes which perform a crucial part in regulating the iron balance and transport. IL-6, which is a pro-inflammatory cytokine, is a predominant inducer of hepcidin. The action of hepcidin is via binding with the cellular iron efflux channel ferroportin and provoking its internalization and degradation.[28] Hepcidin levels greatly increase within hours after an inflammatory stimulus, followed by the development of hypoferremia.[28] Hypoferremia curbs the iron supply for Hb synthesis, ultimately causing anemia. Cytokines and cells of the reticuloendothelial system alter the iron homeostasis, decrease erythropoietin (EPo) production and multiplication of erythroid progenitors, thus shortening the life span of red cell. In ordinary physiological circumstances, levels of EPo are inversely interconnected to Hb levels and tissue oxygenation. However, in conditions of chronic inflammation, the EPo reaction is dulled, resulting in insufficient levels of EPo for the amount of anemia, and this is believed to be facilitated via inflammatory cytokines such as (TNF-α) and IL-1.[27] The proliferation and differentiation of erythroid progenitor cells is reduced in ACD.[11] The erythrocytes are typically normocytic and normochromic but can appear slightly hypochromic and microcytic, particularly in AI of long period or in children, who consume extra iron for growth. In these situations, there is development of hypochromia and microcytosis, apparently since iron restriction becomes more severe with progressively depleting iron stores.[9]
The drop in RBC numbers and related RBC indices at 1 week can be explained that following acute inflammatory stimuli as in postprocedural distress, anemia results with the features of a functional iron deficiency.[7,31,32] This well-defined swing of iron from erythropoiesis and circulation to the reticuloendothelial system may characterize the pathogenetic mechanism.[26] IL-6 induced increased hepcidin production leads to the development of transient normocytic normochromic anemia.[7] The rise in the RBC numbers by 1-month duration is presumably due to inflammation resolution, as the differentiation and proliferation of erythroid progenitor cells is abridged due to inhibitory effects of inflammatory cytokines. The reduction in the levels of IL-6 by the end of 1 month results in the reversal of hepcidin secretion also resulting in improved RBC counts.[7]
The total number of platelets also showed a significant reduction by 1-month duration as compared to baseline. Thrombocytosis is normally appreciated in disorders associated with generation of the acute-phase response, such as acute and chronic infections, rheumatic diseases, and malignancy. The PLT is usually well beyond normal parameters but <1 × 10⁹/l, and in this, backdrop thrombocytosis is asymptomatic minus any complications of thrombosis or hemorrhage. Thrombocytosis can be primary and secondary. Primary thrombocytosis, or essential thrombocythemia, is a malady in which increase in platelets results due to abnormal cells in the bone marrow. The source is unidentified. Secondary (reactive) thrombocytosis is triggered by other illnesses of the patient such as anemia due to iron deficiency, inflammation or infection, surgery and cancer.[9,10]
There is mounting proof that the augmented platelet production is facilitated by the cytokines accompanying the acute-phase response.[9,10,33,34,35,36,37] Evidence suggests that the cytokines assumed to contribute in inflammatory events including IL-1, IL-6, TNFα, TGF-β, and IL-11 can impact megakaryocyte proliferation, differentiation and numbers.[9,10,33,34,35,36,37] Thus, the already present chronic periodontal infection resulting in increased pro-inflammatory cytokine production and ACD cause the increase in circulating thrombocyte numbers which finally reduce when the chronic infection and latent anemia is treated.
Chronic periodontitis is accompanied with anemia and possibility of cardiovascular ailment. The low levels of RBC and its associated parameters, high levels of leukocytes, platelets, and CRP at baseline are indicative of the bacterial etiology of periodontitis. Proficient mechanical debridement (Phase I therapy) results in a significant improvement in periodontal health as was evident from the improved clinical parameters. There was a substantial decline in the serum CRP level at 1-month interval which is an important cardiovascular risk marker. Timely management of chronic periodontitis could be one of the important aspects in the prevention of adverse systemic implication like cardiovascular events. The noteworthy reduction in TLC, neutrophils, and platelets thus improves blood rheology thereby decreasing the risk for thromboembolic events. The marked improvement in AI associated with chronic periodontal disease is also evident by the improved RBC count and associated indices by the end of 1 month. The major changes in all these values following nonsurgical periodontal therapy indicate resolution of inflammation.
CONCLUSION
Based on these outcomes, it can be summarized that intense periodontal mechanotherapy (Phase I) stimulates an acute systemic inflammatory reaction. Since the witnessed acute systemic inflammatory response appears to share numerous biochemical and hematological characters of the well-documented vaccination, endotoxin, and strenuous exercise models, which also are known to induce such acute systemic inflammatory response, intensive mechanotherapy done in Phase I periodontal treatment may represent a nontoxic, noninvasive, nonpharmacological stimulated model to study acute inflammation in humans as compared to the erstwhile recognized models (such as the endotoxin test) which may be unfeasible or unscrupulous. Further research encompassing a bigger sample size can be used to establish these findings. However, owing to the dearth of interpretations in the initial posttherapy hours, this study falls short in offering direct evidence during the peak inflammatory response generated postperiodontal therapy. Additional studies focusing on the immediate inflammatory responses (during the initial 6–8 h) are desired.
Financial support and sponsorship
Nil.
Conflicts of interest
There are no conflicts of interest.
REFERENCES
- 1.D’Aiuto F, Parkar M, Andreou G, Suvan J, Brett PM, Ready D, et al. Periodontitis and systemic inflammation: Control of the local infection is associated with a reduction in serum inflammatory markers. J Dent Res. 2004;83:156–60. doi: 10.1177/154405910408300214. [DOI] [PubMed] [Google Scholar]
- 2.American Academy of Periodontology. Ad hoc committee on the parameters of care: Phase I therapy. J Periodontol. 2000;71:856. [Google Scholar]
- 3.Perry DA, Schmid MO, Takei HN. Phase I periodontal therapy. In: Newman MG, Takei H, Klokkevoid P, Carranza FA, editors. Carranza's Clinical Periodontology. 10th ed. St Louis, Missouri: Saunders, Elsevier; 2006. pp. 722–27. [Google Scholar]
- 4.Lofthus JE, Waki MY, Jolkovsky DL, Otomo-Corgel J, Newman MG, Flemmig T, et al. Bacteremia following subgingival irrigation and scaling and root planing. J Periodontol. 1991;62:602–7. doi: 10.1902/jop.1991.62.10.602. [DOI] [PubMed] [Google Scholar]
- 5.Waki MY, Jolkovsky DL, Otomo-Corgel J, Lofthus JE, Nachnani S, Newman MG, et al. Effects of subgingival irrigation on bacteremia following scaling and root planing. J Periodontol. 1990;61:405–11. doi: 10.1902/jop.1990.61.7.405. [DOI] [PubMed] [Google Scholar]
- 6.Ebersole JL, Cappelli D. Acute-phase reactants in infections and inflammatory diseases. Periodontol 2000. 2000;23:19–49. doi: 10.1034/j.1600-0757.2000.2230103.x. [DOI] [PubMed] [Google Scholar]
- 7.D’Aiuto F, Nibali L, Mohamed-Ali V, Vallance P, Tonetti MS. Periodontal therapy: A novel non-drug-induced experimental model to study human inflammation. J Periodontal Res. 2004;39:294–9. doi: 10.1111/j.1600-0765.2004.00741.x. [DOI] [PubMed] [Google Scholar]
- 8.Graziani F, Cei S, Tonetti M, Paolantonio M, Serio R, Sammartino G, et al. Systemic inflammation following non-surgical and surgical periodontal therapy. J Clin Periodontol. 2010;37:848–54. doi: 10.1111/j.1600-051X.2010.01585.x. [DOI] [PubMed] [Google Scholar]
- 9.Trey JE, Kushner I. The acute phase response and the hematopoietic system: The role of cytokines. Crit Rev Oncol Hematol. 1995;21:1–8. doi: 10.1016/1040-8428(94)00141-3. [DOI] [PubMed] [Google Scholar]
- 10.Gabay C, Kushner I. Acute-phase proteins and other systemic responses to inflammation. N Engl J Med. 1999;340:448–54. doi: 10.1056/NEJM199902113400607. [DOI] [PubMed] [Google Scholar]
- 11.Rai B, Kharb S. Effect of scaling and root planning in periodontitis on peripheral blood. Int J Dent Sci. 2008;6:1–4. [Google Scholar]
- 12.Syrjänen J. Vascular diseases and oral infections. J Clin Periodontol. 1990;17:497–500. doi: 10.1111/j.1365-2710.1992.tb01222.x. [DOI] [PubMed] [Google Scholar]
- 13.Quirynen M, Mongardini C, Pauwels M, Bollen CM, Van Eldere J, van Steenberghe D. One stage full-versus partial-mouth disinfection in the treatment of chronic adult or generalized early-onset periodontitis. II. Long-term impact on microbial load. J Periodontol. 1999;70:646–56. doi: 10.1902/jop.1999.70.6.646. [DOI] [PubMed] [Google Scholar]
- 14.Cercek JF, Kiger RD, Garrett S, Egelberg J. Relative effects of plaque control and instrumentation on the clinical parameters of human periodontal disease. J Clin Periodontol. 1983;10:46–56. doi: 10.1111/j.1600-051x.1983.tb01266.x. [DOI] [PubMed] [Google Scholar]
- 15.Hämmerle CH, Joss A, Lang NP. Short-term effects of initial periodontal therapy (hygienic phase) J Clin Periodontol. 1991;18:233–9. doi: 10.1111/j.1600-051x.1991.tb00420.x. [DOI] [PubMed] [Google Scholar]
- 16.Hughes TP, Caffesse RG. Gingival changes following scaling, root planning and oral hygiene. A biometric evaluation. J Periodontol. 1978;49:245–52. doi: 10.1902/jop.1978.49.5.245. [DOI] [PubMed] [Google Scholar]
- 17.Cugini MA, Haffajee AD, Smith C, Kent RL, Jr, Socransky SS. The effect of scaling and root planing on the clinical and microbiological parameters of periodontal diseases: 12-month results. J Clin Periodontol. 2000;27:30–6. doi: 10.1034/j.1600-051x.2000.027001030.x. [DOI] [PubMed] [Google Scholar]
- 18.Ide M, McPartlin D, Coward PY, Crook M, Lumb P, Wilson RF. Effect of treatment of chronic periodontitis on levels of serum markers of acute-phase inflammatory and vascular responses. J Clin Periodontol. 2003;30:334–40. doi: 10.1034/j.1600-051x.2003.00282.x. [DOI] [PubMed] [Google Scholar]
- 19.Hussain Bokhari SA, Khan AA, Tatakis DN, Azhar M, Hanif M, Izhar M. Non-surgical periodontal therapy lowers serum inflammatory markers: A pilot study. J Periodontol. 2009;80:1574–80. doi: 10.1902/jop.2009.090001. [DOI] [PubMed] [Google Scholar]
- 20.Scannapieco FA. Position paper of the American Academy of Periodontology: Periodontal disease as a potential risk factor for systemic diseases. J Periodontol. 1998;69:841–50. [PubMed] [Google Scholar]
- 21.van Furth R. Monocyte production during inflammation. Comp Immunol Microbiol Infect Dis. 1985;8:205–11. doi: 10.1016/0147-9571(85)90045-1. [DOI] [PubMed] [Google Scholar]
- 22.Sluiter W, Hulsing-Hesselink E, Elzenga-Claasen I, van Hemsbergen-Oomens LW, van der Voort van der Kleij-van Andel A, van Furth R, et al. Macrophages as origin of factor increasing monocytopoiesis. J Exp Med. 1987;166:909–22. doi: 10.1084/jem.166.4.909. [DOI] [PMC free article] [PubMed] [Google Scholar]
- 23.Annema A, Sluiter W, van Furth R. Effect of interleukin 1, macrophage colony-stimulating factor, and factor increasing monocytopoiesis on the production of leukocytes in mice. Exp Hematol. 1992;20:69–74. [PubMed] [Google Scholar]
- 24.Lee GR. The anemia of chronic disease. Semin Hematol. 1983;20:61–80. [PubMed] [Google Scholar]
- 25.Means RT., Jr Advances in the anemia of chronic disease. Int J Hematol. 1999;70:7–12. [PubMed] [Google Scholar]
- 26.Weiss G. Pathogenesis and treatment of anaemia of chronic disease. Blood Rev. 2002;16:87–96. doi: 10.1054/blre.2002.0193. [DOI] [PubMed] [Google Scholar]
- 27.Cullis JO. Diagnosis and management of anaemia of chronic disease: Current status. Br J Haematol. 2011;154:289–300. doi: 10.1111/j.1365-2141.2011.08741.x. [DOI] [PubMed] [Google Scholar]
- 28.Ganz T, Nemeth E. Iron sequestration and anemia of inflammation. Semin Hematol. 2009;46:387–93. doi: 10.1053/j.seminhematol.2009.06.001. [DOI] [PMC free article] [PubMed] [Google Scholar]
- 29.Hutter JW, van der Velden U, Varoufaki A, Huffels RA, Hoek FJ, Loos BG. Lower numbers of erythrocytes and lower levels of hemoglobin in periodontitis patients compared to control subjects. J Clin Periodontol. 2001;28:930–6. doi: 10.1034/j.1600-051x.2001.028010930.x. [DOI] [PubMed] [Google Scholar]
- 30.Gokhale SR, Sumanth S, Padhye AM. Evaluation of blood parameters in patients with chronic periodontitis for signs of anemia. J Periodontol. 2010;81:1202–6. doi: 10.1902/jop.2010.100079. [DOI] [PubMed] [Google Scholar]
- 31.van Iperen CE, Kraaijenhagen RJ, Biesma DH, Beguin Y, Marx JJ, van de Wiel A. Iron metabolism and erythropoiesis after surgery. Br J Surg. 1998;85:41–5. doi: 10.1046/j.1365-2168.1998.00571.x. [DOI] [PubMed] [Google Scholar]
- 32.Fallon KE, Sivyer G, Sivyer K, Dare A. Changes in haematological parameters and iron metabolism associated with a 1600 kilometre ultramarathon. Br J Sports Med. 1999;33:27–31. doi: 10.1136/bjsm.33.1.27. [DOI] [PMC free article] [PubMed] [Google Scholar]
- 33.Kobayashi S, Teramura M, Sugawara I, Oshimi K, Mizoguchi H. Interleukin-11 acts as an autocrine growth factor for human megakaryoblastic cell lines. Blood. 1993;81:889–93. [PubMed] [Google Scholar]
- 34.Teramura M, Kobayashi S, Hoshino S, Oshimi K, Mizoguchi H. Interleukin-11 enhances human megakaryocytopoiesis in vitro . Blood. 1992;79:327–31. [PubMed] [Google Scholar]
- 35.Murphy M, Perussia B, Trinchieri G. Effects of recombinant tumor necrosis factor, lymphotoxin, and immune interferon on proliferation and differentiation of enriched hematopoietic precursor cells. Exp Hematol. 1988;16:131–8. [PubMed] [Google Scholar]
- 36.Abboud SL, Gerson SL, Berger NA. The effect of tumor necrosis factor on normal human hematopoietic progenitors. Cancer. 1987;60:2965–70. doi: 10.1002/1097-0142(19871215)60:12<2965::aid-cncr2820601219>3.0.co;2-o. [DOI] [PubMed] [Google Scholar]
- 37.Lotem J, Shabo Y, Sachs L. Regulation of megakaryocyte development by interleukin-6. Blood. 1989;74:1545–51. [PubMed] [Google Scholar]


