Abstract
In this study, the effect of different process conditions on the material properties of a single UV-cured layer of methacrylate resin, typically used in the stereolithography (SLA) process, is assessed. This simplified approach of the SLA process gives the opportunity to study the link between process conditions and mechanical properties without complicated interactions between different layers. Fourier-transform infrared analysis is performed to study the effect of light intensity, curing time, and initiator concentration on the monomer conversion. A model is developed based on the reaction kinetics of photopolymerization that describes and predicts the experimental data. The effect of curing time and light intensity on the glass-transition temperature is studied. A unique relation exists between conversion and glass-transition temperature, independent of the light intensity and curing time. Tensile tests on UV-cured resin show an increase in yield stress with increasing curing time and a linear relation between glass-transition temperature and yield stress. However, a lower light intensity leads to a different network structure characterized by a lower yield stress and glass-transition temperature. The correlations between process conditions and the mechanical properties of UV-cured methacrylate systems are established to better understand the role of the processing parameters involved in the SLA process.
1. Introduction
In recent years, the interest in additive manufacturing (AM) has increased enormously. The possibility to produce complex geometries without the need for postprocessing gives tremendous design freedom. This freedom makes AM suitable for numerous applications. One of the most important AM methods is stereolithography (SLA), which was already developed during the 1970s.1 SLA is a 3D printing method that uses ultraviolet (UV) light to solidify specific parts of a layer of photocurable polymers. The SLA technique results in products with a high spatial resolution and low porosity. Despite these advantages, high shrinkage and poor mechanical properties of the printed products limit the use of SLA for load-bearing applications. Optimization of product quality is often done based on trial and error because of the lack of understanding of the effect of process conditions on the mechanical properties. Research has been done to study the material properties of products produced using SLA and efforts have been made to improve the quality.2−7 These studies mainly focused on the curing characteristics, the effect of uncured monomer trapped in the network, and the shrinkage of cured products. Additionally, the photopolymerization process has been modeled to improve the understanding of the reaction kinetics.8−10 Nevertheless, improvements can be made by developing better understanding of the polymerization process and studying the effect of process conditions on the curing mechanism of the resin and its relation to mechanical properties. Capturing these relations in a model creates the possibility to incorporate the influence of processing to obtain ultimate mechanical properties, without the need for trial and error type of experiments.
In the printing process, several parameters influence the polymerization reactions and resulting mechanical properties, such as light intensity, irradiation time, and initiator concentration. Lovell et al.11 have studied the effect of light intensity on the rate of photopolymerization, reporting an increase in polymerization rate, and therefore ultimate conversion, with increasing intensity. Moreover, Nomoto et al.12 have shown that when the total dose is kept constant, the curing depth and evolution of monomer conversion are the same. Miyazaki at al.13 have found equivalent fracture toughness, flexural strength, and modulus values for light-cured materials when equivalent doses were applied. Others have reported a linear relationship between monomer conversion and glass-transition temperature for dimethacrylate systems.2,14
In this work, polymerization kinetics and mechanical properties of a methacrylate resin UV-cured under different process conditions are studied. Single layers of methacrylate resin are characterized to study how process conditions of resins used in the SLA process affect the mechanical properties, without complicated interactions between different layers. The effect of light intensity, curing time, and initiator concentration on the monomer conversion is studied. A model based on the reaction kinetics is developed to describe the monomer conversion. The effects of curing time and light intensity on the glass-transition temperature and mechanical properties are presented as well as relations between conversion and ultimate properties.
2. Modeling of Material Properties
The models used in this study describe the material properties of the methacrylate resin including monomer conversion, that is, kinetics of photopolymerization, as well as link the monomer conversion to the glass-transition temperature, and capture the yield kinetics.
2.1. Modeling Monomer Conversion
Modeling the monomer conversion is done by using the kinetics of the photopolymerization reaction.8−10,15−19
2.1.1. Reaction Scheme of Photopolymerization
The photopolymerization follows the reaction scheme shown in 1.18,20 The first step is the decomposition of an initiator molecule (In), creating two free radicals (R•). The rate constant of this decomposition is defined as kd.
| 1 |
The initiation of a polymer chain (P•) happens when a free radical reacts with a monomer (M). This polymer chain propagates by reacting with monomer molecules. The rate of these two reactions is assumed equal and is represented by kp, that is, the propagation rate constant.
| 2 |
| 3 |
Termination of the polymer chains occurs through either the reaction of a polymer chain with a free radical, combination, or disproportionation. For simplicity of the developed model, combination and disproportionation are modeled in one equation. This is allowed because the kinetics of cross-linked systems are not affected significantly by the termination mechanism, in contrast to linear systems for which the molecular weight is affected.15 The rate of these termination processes is assumed equal and is represented by kt, that is, the termination rate constant.
| 4 |
| 5 |
The evolution of species concentrations over time is derived from the reaction scheme, obtaining the set of differential equations shown in 6 to 10. In this set of equations, [In], [R•], [M], [P•], and [Pdead] are the concentrations of initiator, free radicals, monomer, growing polymer chains, and dead polymer chains, respectively.
| 6 |
| 7 |
| 8 |
| 9 |
| 10 |
in which f is the initiator efficiency that describes the fraction of radicals initiating a polymer chain. This set of ordinary differential equations can be solved if the initial conditions, the reaction rate constants, and the initiator efficiency are known.
2.1.2. Determination of Reaction Rate Constants
In order to solve this set of differential equations, the reaction rate constants kd, kp, and kt have to be determined. The initiator decomposition rate is determined using a modified Beer–Lambert law18 for penetration of light into a medium
| 11 |
with ϕ the quantum yield of the initiator, ε the molar absorptivity of the initiator, I0 the incident light intensity, z the depth into the material, λ the wavelength of the light, NA Avogadro’s constant, h Planck’s constant, and c the speed of light.
The propagation and termination rate constants are determined experimentally using Fourier transform infrared (FTIR) measurements. A setup is developed to enable in situ UV-curing of the resin on which FTIR measurements are carried out. Using this setup, the conversion is measured by intermittently illuminating the resin and performing FTIR scans, giving the possibility to obtain information about the reaction kinetics of the photopolymerization. From these experiments, the ratio kp0/kt00.5 is determined21
| 12 |
with Rp the initial rate of polymerization and IA the photon absorption rate. The rate of polymerization is defined as21
| 13 |
in which x is the monomer conversion determined by FTIR and [M]0 is the monomer concentration in the unreacted resin. The photon absorption rate is determined from the process conditions and the material properties of the photoinitiator, using22
| 14 |
2.1.3. Implementing Nonconstant Reaction Rates
The reaction rate constants kp and kt are a function of conversion because diffusion can become the limiting factor. At the start of the reaction, the medium consists of a monomer and a small amount of initiator. During the reaction, this composition changes as the monomer is converted into a polymer, which increases the viscosity of the medium, limiting the diffusion of the components to a point where the diffusion becomes the limiting step in the reaction. Additionally, in cross-linking polymers the network limits the diffusion of small molecules through the medium even more and prohibits the diffusion of large polymer chains that are connected to the network.
Anseth and Bowman23 describe a model which includes the diffusion effects on the reaction rates with a limited amount of adjustable parameters. This model describes the reaction rates in good agreement with experimental results.24 The model includes reaction diffusion, transition from reaction-controlled to diffusion-controlled reaction, and volume relaxation. The model expresses the reaction rate constants in terms of the resistances to reaction
| 15 |
with kr the true reaction rate constant and km the mass transfer limited reaction rate constant.
Using this approach, the propagation rate constant is described by23
| 16 |
in which kp0 is the initial propagation rate constant, B an adjustable parameter, vf the fractional free volume of the system, and vf,cp the critical free volume at which propagation becomes diffusion-controlled. The fractional free volume of the system is described by23
| 17 |
with v the specific volume, v∞ the equilibrium specific volume, and vf,eq the equilibrium free volume. The volume relaxation, described in the second term of eq 17, is neglected in the implementation of the reaction rates in the developed model; a consequence of this simplification is that eq 17 reduces to vf = vf,eq. The equilibrium free volume is defined as23
| 18 |
Here, α is the thermal expansion coefficient, Tg the glass-transition temperature, and ϕp the volume fraction of polymer. The subscripts m and p refer to the monomer and polymer, respectively. It is assumed that the fractional free volume at the glass-transition temperature is 0.025, the free volume of the monomer and polymer are ideally additive, and the free volume varies linearly with temperature above the glass-transition temperature. The volume fraction of the polymer is directly related to the conversion23
| 19 |
with x the monomer conversion and εv the volume contraction factor, which is defined by25
| 20 |
with ρm and ρp the density of the monomer and polymer, respectively.
The termination rate also includes the reaction diffusion limitation, which leads to the termination rate constant described as23
 |
21 |
in which kt0 is the initial termination rate constant, R a proportionality constant, A an adjustable parameter, and vf,ct the critical free volume at which termination becomes diffusion-controlled. The resistance to translational diffusion is neglected because in a cross-linking system, translational diffusion of the polymer chains is negligible from the start of the reaction.26
In order to solve the set of equations, the initiator efficiency f in eq 7 has to be determined. The efficiency decreases as a function of conversion because of the “cage effect”, resulting in more recombination of free radicals.26 The recombination reaction is shown in eq 22. The free radical pair reacts to form a nonreactive molecule, at the termination rate for recombination, ktr.
| 22 |
The recombination process involves the diffusion of small radical molecules in the reaction mixture. Rather than separately modeling this recombination process, it is taken into account via a reduction of the initiator efficiency. Therefore, the effect of conversion on the initiator efficiency is described similar to the propagation rate. Adapting eq 16 for the initiator efficiency in eq 7 leads to
| 23 |
in which the initiator efficiency at the beginning of the reaction is assumed to be 1, C is an adjustable parameter, and vf,cf is the critical free volume at which the initiator efficiency becomes diffusion-controlled. The adjustable parameters A, B, and C represent the rate at which the reaction rate constants and the initiator efficiency decrease with increasing conversion, which are used as fitting parameters by Anseth and Bowman.23 In the present work, these adjustable parameters are taken equal to 1 (A = B = C = 1) in the implementation of the model to study the predictive capabilities with respect to changing process conditions.
2.2. Modeling Glass-Transition Temperature
The glass-transition temperature Tg is linked to the monomer conversion x, using a model developed by Hale et al.27 The most important advantage of this approach is the use of only one adjustable parameter. This model was adapted from a model developed by Pascault and Williams28 and is based on DiBenedetto’s equation.29,30 DiBenedetto’s equation is derived using the principle of corresponding states with an uncross-linked polymer as a reference state and relates the shift in Tg to the extent of reaction for cross-linking polymers using29
 |
24 |
in which Tg0 is the glass-transition temperature of the uncross-linked polymer, for which we use the glass-transition temperature of the uncured resin,31 εx/εm is the ratio of lattice energies, and Fx/Fm is the ratio of segmental mobilities. The subscripts x and m denote the cross-linked and uncross-linked polymers, respectively. In the case of full conversion (x = 1), eq 24 gives
| 25 |
in which Tg∞ is the glass-transition temperature of the polymer at complete conversion. Introducing this in eq 24 and stating that Fx/Fm = λ leads to the model developed by Pascault and Williams28
| 26 |
Based on Couchman’s approach,32 using entropic considerations, the ratio λ can be considered as28
| 27 |
in which ΔCp∞ and ΔCp0 are the isobaric heat capacities of the polymer at complete conversion and of the uncured resin, respectively. For systems that do not reach a monomer conversion of 100% (x = 1), this model was adapted by Hale et al.,27 which describes the link between monomer conversion and Tg using
| 28 |
in which TgM is now the glass-transition temperature of the polymer at the maximum monomer conversion of the resin studied. The correction for incomplete conversion in x and λ is done using
| 29 |
respectively, where the subscript M denotes maximum conversion of the resin and subscript 0 denotes the uncured resin. The conversion as a function of glass-transition temperature is described using λ′ as a fitting parameter.
2.3. Yield Kinetics
To describe the rate and temperature dependence of the yield stress calculated from tensile measurements, Eyring’s activation flow theory is used.33 The yield stress as a function of temperature and strain rate is described by
| 30 |
where V* is the activation volume, ε̇0 the rate factor, ΔU the activation energy, R the universal gas constant, k the Boltzmann’s constant, and T the absolute temperature.
3. Materials and Methods
3.1. Materials
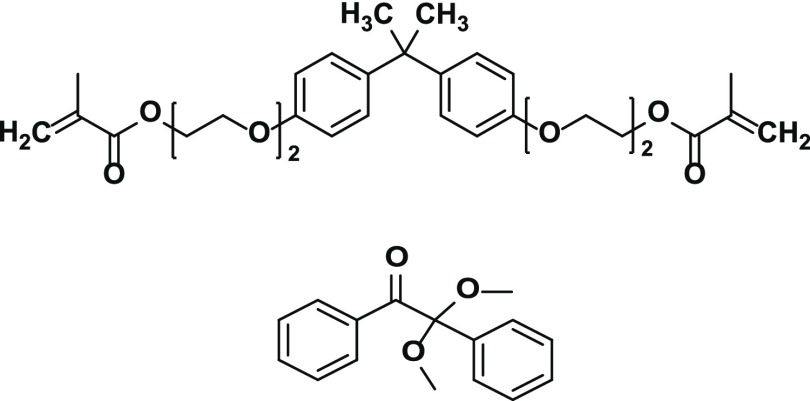
In this work, a methacrylate monomer, bisphenol-A-ethoxylated dimethacrylate (SR540, Mn = 572 g/mol), supplied by Sartomer, Arkema Group, and a photoinitiator, 2,2-dimethoxy-2-phenylacetophenone (Irgacure 651, Mn = 256 g/mol), are used. The chemical structures are shown in Figure 1. The photoinitiator is added in powder form in an amount of 0.3 and 3 wt % and dissolved into the monomer by sonication to create the UV-curing resin.
Figure 1.
Chemical structure of the SR540 monomer and of the Irgacure 651 photoinitiator.
3.2. Sample Preparation
The UV-curing resin is applied on a silicon wafer and a spin coater is used to obtain a homogeneous layer with a defined thickness. A spinning speed of 357 rpm for 30 s is used to obtain a layer thickness of approximately 100 μm. The resin is then UV-cured in an inert atmosphere to avoid oxygen inhibition as described in our previous study.34 A first irradiation of 1.5 s is done to obtain the desired dog-bone-shaped samples. The samples are cured under UV light intensities ranging from 2 to 8 mW/cm2 with an LED light (wavelength 365 nm, LED Cube 100, Hönle UV Technologies). The light intensity at the sample position is uniform as measured with a UV-meter. Next, the uncured resin is washed for 4 min with ethanol and dried with nitrogen. The dog-bone-shaped samples are successively UV and thermally post-cured. UV post-curing is performed at the same intensities in an inert atmosphere for different curing times. Thermal post-curing is eventually done in an oven at 150 °C for 30 min.
3.3. Material Characterization
The monomer conversion is determined using FTIR spectroscopy analysis (Spectrum Two FTIR Spectrometer, PerkinElmer), equipped with an attenuated total reflectance (ATR) module. FTIR measurements are performed in the range of wavenumbers from 4000 to 400 cm–1 while intermittently curing the resin in situ. A box has been fabricated to create the inert atmosphere needed during the photopolymerization reaction.34 A portable LED UV-lamp is connected to a controller (bluepoint LED eco, wavelength 365 nm, Hönle UV Technologies) and fixed on top of the box. The light intensity at the sample position is uniform as measured with a UV-meter. Tests are performed on samples 100 μm thick, which guarantees that no gradient in curing is present throughout the layer thickness. The layer of the liquid resin is placed on the ATR crystal and the box, equipped with an inlet tube and outflow hole, is positioned on the spectrometer and flushed with nitrogen for 3 min. The resin is then intermittently illuminated for the desired total time under UV light intensities ranging from 2 to 59 mW/cm2, and absorbance spectra are collected after each pulse of light. In particular, a pulse duration of 0.1 s is used to accurately follow the evolution in time of monomer consumption. The conversion, α(t), is determined using the second derivative method by35
 |
31 |
where [A1637″/A1608″]0 and [A1637″/A1608″]t represent the ratio of the second derivative of the methacrylate double-bond at 1637 cm–1 and the internal reference at 1608 cm–1,36 before and after UV exposure for time t. All the measurements are repeated at least two times and the average values are shown. Error bars are smaller than the symbols and therefore omitted.
The densities of the liquid resin and UV-cured sample are measured at room temperature by using a pycnometer (AccuPyc 1330, Micromeritics), from which the volume contraction factor, εv, is determined using eq 20.
Dynamic mechanical thermal analysis (DMTA) is employed to study the effect of process conditions on the glass-transition temperature, Tg. Dog-bone-shaped samples of about 100 μm thickness and 2.5 mm width are tested using a TA Instruments Q800 DMA, at a frequency of 1 Hz, in a temperature range from −50 to 150 °C with a heating rate of 3 °C/min. A strain amplitude of 0.1% and preload of 0.01 N are applied. The storage and loss modulus are recorded as functions of temperature, and the Tg is defined as the maximum in tan(δ).
Tensile tests are performed to study the effect of curing time and UV light intensity on the mechanical properties of the UV-cured methacrylate resin. Room temperature uniaxial tensile tests are performed on a microtensile stage (TST350 Linkam Scientific) equipped with a 200 N load cell. The dimensions of the tensile specimens (length 30 mm, thickness 0.1 mm, and width 2.5 mm), corresponding to the photomask design, are based on ASTM standard D638 type I. Tensile measurements at different temperatures, ranging from −10 to 80 °C, are performed using a Zwick/Roell testing machine, equipped with a 1 kN load cell and a temperature-controlled chamber. The tests are performed at strain rates in the range from 5.5 × 10⁻⁵ to 1.9 × 10⁻³ s–1 and repeated at least two times.
4. Results and Discussion
4.1. Monomer Conversion
The first step to characterize the UV-curing of the methacrylate resin is to investigate the effect of curing time on the monomer conversion. Additionally, the polymerization kinetics are described with the model presented in Section 2.1. The predictive capability of the model is further tested by studying the effect of UV light intensity and initiator concentration on the conversion.
4.1.1. Effect of Curing Time
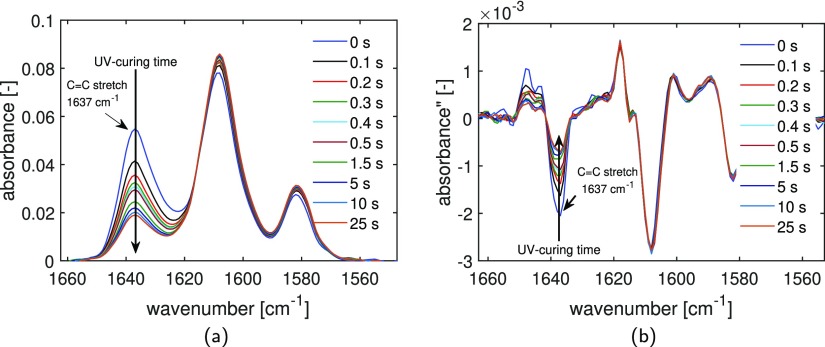
The monomer conversion is determined by using FTIR measurements in ATR mode, in which the absorbance as a function of wavenumber is recorded. In Figure 2a, the evolution of the C=C double-bond peak at 1637 cm–1 as a function of the wavenumber is reported for a selection of UV-curing times. It is clear that the number of double bonds decreases with increasing curing time. The monomer conversion is determined using the second derivative method (Figure 2b), as described in Section 3.3.
Figure 2.
Evolution of the C=C stretch peak at 1637 cm–1 during UV-curing of the methacrylate resin: absorbance spectra acquired in ATR mode (a) and second derivative of the absorbance (b) as a function of wavenumber.
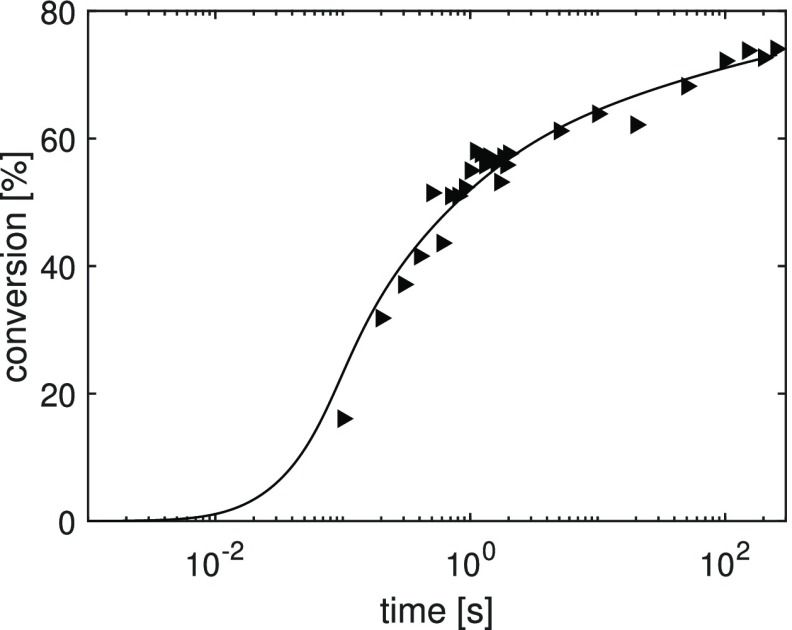
The monomer conversion as a function of curing time and the model fit are shown in Figure 3. The data refer to the curing that occurs at the bottom of a 100 μm thick layer. As the exposure time increases, the conversion of the double bonds increases to a final value of 73%. First, the ratio kp0/kt00.5 is calculated from the steepest slope of the initial rate of polymerization (eq 12) and the model is then fitted to the experimental data. Table 1 summarizes the parameters used in the model. Each fitting parameter represents a physical phenomenon during the photopolymerization. For instance, the critical conversion for termination, xcrt, is assumed to be equal to zero, because in cross-linked systems the termination rate is diffusion-controlled from the beginning of the polymerization reaction. Moreover, as expected, as the radical molecules are smaller in size as compared to the growing polymer chains, the critical conversion for initiator efficiency turns out to be higher than the one for propagation. The sensitivity of the model predictions to kp0/kt00.5 ratio, and the variation of kp, kt and efficiency f with the degree of conversion are shown in the Supporting Information, Figures S1 and S2. The conversion values at which the parameters start decreasing are determined by the critical conversion values. The curves in Figure 3 are in good agreement with theory and experimental results in literature.23,26
Figure 3.
Monomer conversion as a function of curing time for a resin with 3 wt % of photoinitiator irradiated at a light intensity of 8 mW/cm2. The markers represent the experimental results and the solid line the model fit.
Table 1. Model Parameters for Polymerization Kinetics.
| parameter | value | unit | references |
|---|---|---|---|
| kp0/kt00.5 | 2.9921 | [m1.5 mol–0.5 s–0.5] | determined experimentally |
| εv | 0.0523 | [-] | determined experimentally |
| A | 1 | [-] | fixed a priori |
| B | 1 | [-] | fixed a priori |
| C | 1 | [-] | fixed a priori |
| R | 0.02 | [-] | Anseth, Wang, and Bowman24 |
| αm | 5 × 10⁻⁴ | [°C–1] | Anseth and Bowman23 |
| αp | 75 × 10–6 | [°C–1] | Anseth and Bowman23 |
| Tg,m | –42 | [°C] | Stansbury37 |
| Tg,p | 108 | [°C] | determined experimentally |
| T | 25 | [°C] | process condition |
| λ | 365 × 10–9 | [m] | process condition |
| ϕ | 0.6 | [-] | Boddapati18 |
| ε | 15 | [m2 mol–1] | Boddapati18 |
| kt0 | 1 × 10⁵ | [m3 mol–1 s–1] | adjustable parameter |
| xcrp | 0.19 | [-] | adjustable parameter |
| xcrt | 0 | [-] | fixed a priori |
| xcrf | 0.58 | [-] | adjustable parameter |
4.1.2. Effect of Process Conditions
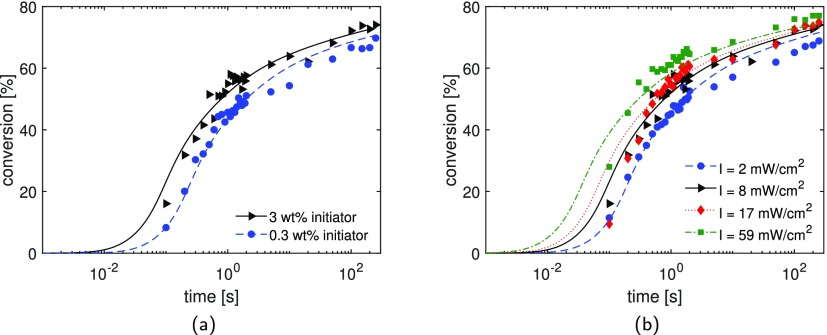
The rate of polymerization reactions is typically affected by different process conditions. The effect of initiator concentration and UV light intensity is studied and predicted with the developed model. To validate the monomer conversion predictions, FTIR measurements are carried out. The effect of the initiator concentration is shown in Figure 4a. The conversion is measured for formulations with 0.3 and 3 wt %, keeping all the other parameters constant. It is clear that a decrease in concentration of the initiator leads to a decrease in polymerization rate. The model is fitted for the 3 wt % composition and the prediction for the formulation with 0.3 wt % initiator is made by changing only the initial concentration. The experimental results are in quantitative agreement with the prediction. The monomer conversion at long curing times is slightly overpredicted. This small deviation from the experimental data may indicate that the vitrification behavior changes with initiator concentration. The different vitrification mechanism would change the critical conversion at which propagation and initiator efficiency (xcrp and xcrf, respectively) become diffusion-controlled. For instance, a lower concentration of initiator in the network could lower both xcrp and xcrf, thereby decreasing the propagation rate and leading to a lower final conversion value. The effect of changing xcrp and xcrf on the prediction of monomer conversion is shown in the Supporting Information, Figure S3.
Figure 4.
Effect of process conditions on polymerization kinetics: (a) model fit for formulations with 3 wt % of the initiator and prediction for 0.3 wt % of the initiator for the resin irradiated at a light intensity of 8 mW/cm2; (b) polymerization kinetics for several UV light intensities. Model fit is shown for an intensity of 8 mW/cm2, and model predictions are shown for intensities of 2, 17, and 59 mW/cm2. The markers represent the measurements and the lines the model descriptions.
The effect of light intensity is shown in Figure 4b. The conversion is measured for light intensities of 2, 8, 17, and 59 mW/cm2. A composition with 3 wt % of the initiator is used and all the other process conditions are kept constant. As expected, increasing the light intensity increases the monomer conversion. Similar to the effect of the initiator concentration, the light intensity clearly affects the polymerization rate at short curing times, as also observed in literature.2 Moreover, the final conversion slightly increases with increasing light intensity. The conversion increases from a final value of 67–77% for intensities of 2 and 59 mW/cm2, respectively. The model is fitted to the light intensity of 8 mW/cm2 and the conversion is predicted for the other intensities. The trend of increasing monomer conversion for higher intensities is also captured by the model predictions. However, the experimental data deviates from the predictions around a curing time of 0.1 s. This inaccuracy may be caused by the presence of molecular oxygen in the liquid resin, which leads to a delay in the polymerization. Moreover, for the highest intensity, the model starts levelling off slightly earlier than the experimental results. A possible reason for this small discrepancy is that the critical conversions at which the propagation rate constant and initiator efficiency start decreasing can be higher for a higher intensity. This phenomenon might be caused by the creation of excess free volume during the faster reaction, which makes it easier for the molecules to diffuse in the network.38 Moreover, higher intensity causes an increase of temperature in the reacting environment.39−42 Suzuki et al.42 have demonstrated that the temperature increases dramatically (40 °C) during the polymerization of methyl methacrylate resins. Tripathy et al.41 have studied the effect of light intensity on the photopolymerization of (meth)acrylate systems. They observed an increase in both polymerization rate and temperature with an increase in UV light intensity. Therefore, the higher experimental conversion values could be explained by the higher local temperature, which has not been taken into account in the model. Previous research39 shows that increasing the local temperature increases the mobility of the reacting species, leading to an increase in the maximum polymerization rate, and therefore higher final conversions. In case of low intensity, increasing the exposure time does not increase the conversion any further. In these systems, the lower mobility diffusion is more the limiting factor, which leads to incomplete conversion. Therefore, in each system the monomer conversion is probably caused by a combination of both photo and thermal effects.
4.2. Glass-Transition Temperature
4.2.1. Effect of Process Conditions
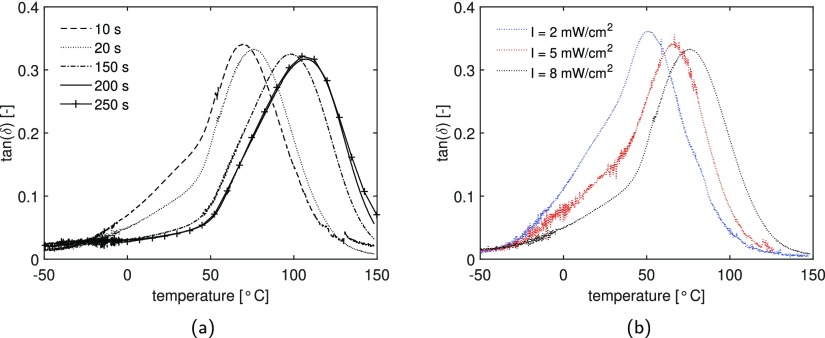
The DMTA curves for the methacrylate resin UV postcured at various times and intensities are shown in Figure 5. All the samples are first UV-cured for 1.5 s and successively UV postcured, as explained in Section 3.2. Figure 5a shows tan(δ) as a function of temperature for a selection of UV postcured samples cured at an intensity of 8 mW/cm2. The maximum of the peak shifts to higher temperatures, and therefore a higher glass-transition temperature is reached with increasing irradiation time. The results show that there is an increase in Tg with postcuring times and after 200 s a maximum is reached. A similar behavior has been seen for acrylate systems.34Figure 5b shows the DMTA results for samples UV postcured for 20 s under light intensities of 2, 5, and 8 mW/cm2. It is clear that an increase of intensity leads to an increase in Tg. Moreover, Figure 5 shows the presence of a small shoulder in the tan(δ) of samples cured with a low curing time and low light intensity, which disappears when further curing is performed. It is caused by the heterogeneous nature of the polymer network at low degrees of conversion.
Figure 5.
(a) tan(δ) as a function of temperature for a resin (with 3 wt % of the initiator) cured at a light intensity of 8 mW/cm2 for a selection of UV postcuring times and (b) effect of light intensity on samples UV postcured for 20 s.
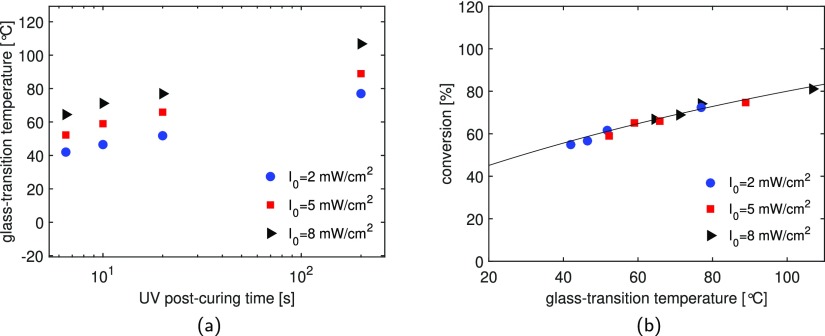
Figure 6a presents the results of the glass-transition temperature as a function of UV postcuring time (6.5, 10, 20, and 200 s) of the three systems studied. Clearly, the overall trend does not change with changes in light intensity. However, in accordance with the monomer conversion, when the resin is cured at a lower intensity, a lower Tg is observed. A similar behavior has been reported by Unterbrink and Muessner.43 They studied the effect of light intensity on the mechanical properties, and they observed a reduction of strength and modulus with decreasing intensity, for the same exposure time. Previous studies have also shown that the mechanical properties do not change if the material is irradiated with the same dose (intensity multiplied by curing time).13 Interestingly, the behavior seems to be different in our systems. For instance, to obtain a polymer with a Tg of approximately 65 °C, the sample has to be cured for 6.5 s at a light intensity of 8 mW/cm2 or for 20 s at 5 mW/cm2, corresponding to a total energy level of 52 and 100 mJ/cm2, respectively (see Figure 6b). Therefore, in order to obtain the same ultimate properties, a higher energy level is required if the resin is irradiated at lower light intensity. A reason for this behavior might be that the increase in intensity increases the maximum temperature reached during polymerization, which provides more molecular mobility, higher conversion, and therefore a higher glass-transition temperature.11,40
Figure 6.
Effect of UV light intensity: glass-transition temperature as a function of irradiation time for samples cured under different light intensities (a) and monomer conversion as a function of glass-transition temperature for samples UV postcured for 6.5, 10, 20, and 200 s. The markers are the experimental results and the line is the prediction based on the Hale model (b).
Figure 6a shows that the glass-transition temperature as a function of UV postcuring times has a strong similarity to the monomer conversion, which also shows an increase to a maximum at long curing times. The similarity in trends indicates that there is a strong connection between conversion and Tg. Figure 6b shows the conversion as a function of the glass-transition temperature, including a fit of the model described in Section 2.2. The figure shows an increase in Tg with increasing conversion, which is captured very well by the model developed by Hale et al.27 and seems independent of the light intensity. The model parameters used for the fit are stated in Table 2. A similar observation has been shown in the work of Lovell et al.14 for a common dimethacrylate dental resin formulation (75/25 wt % bis-GMA/TEGDMA), in which a unique fit describes the glass-transition temperature as a function of conversion for samples cured under different light intensities and light sources.
Table 2. Model Parameters (Eq 28) for Glass-Transition Temperature.
| parameter | value | unit | references |
|---|---|---|---|
| Tg0 | –42 | [°C] | Stansbury37 |
| TgM | 108 | [°C] | determined experimentally |
| xM | 82 | [%] | determined experimentally |
| λ′ | 0.59 | [-] | adjustable parameter |
4.3. Mechanical Properties
4.3.1. Effect of Curing Time
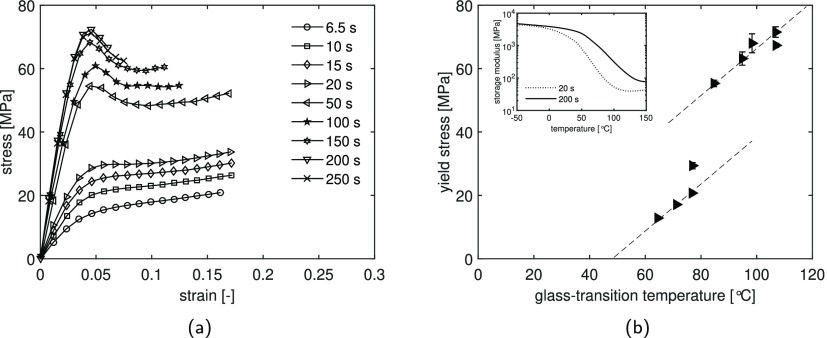
The effect of UV postcuring time on the tensile behavior of the methacrylate resin is shown in Figure 7. All the samples are UV-cured for 1.5 s and successively postcured for different times as described in Section 3.2. Figure 7a shows the stress–strain response of a selection of cured samples tested at room temperature at a constant strain rate of 1.9 × 10⁻³ s–1. As expected, the overall stress level increases as the UV postcuring time increases. The mechanical response follows a similar trend as the glass-transition temperature (Figure 5a): the yield stress strongly increases with curing time. At 200 s of UV postcuring time, the yield stress reaches a maximum value of approximately 70 MPa. Figure 7b presents the evolution of yield stress as a function of glass-transition temperature. Within a specific Tg range, the data show a linear relation between yield stress and Tg, similar to that observed in literature for epoxy and methacrylate resins.44,45 However, samples having a glass-transition temperature of around 80 °C present a jump in the yield stress, which can be explained by the fact that the samples, having different network structures because of the difference in curing time, are tested at the same temperature.
Figure 7.
(a) Stress–strain response for UV postcured samples measured at a strain rate of 1.9 × 10⁻³ s–1 at 23 °C. (b) Yield stress as a function of glass-transition temperature. The storage modulus as a function of temperature for samples UV postcured for 20 and 200 s is shown in the inset. All the samples, having 3 wt % of the initiator, are cured at a light intensity of 8 mW/cm2.
Figure 7a shows that samples UV postcured for less than 20 s have a mechanical response in which no visible yield stress is present. This behavior is because for low curing times, the samples are characterized by low glass-transition temperatures, which are close to the tensile testing temperature. On the other hand, samples cured for longer times have a Tg far above the testing temperature; therefore, the mechanical response is not affected. This can be observed in the inset of Figure 7b, in which the evolution of the storage modulus as a function of temperature is shown for samples UV postcured for 20 and 200 s. It is clear that at room temperature, the sample cured for 20 s is in the glass-transition region starting from 60 °C below Tg; therefore, the tensile response of the same sample tested at room temperature shows a rubber-like behavior. On the other hand, the sample UV postcured for 200 s is still in the glassy region at the testing temperature. This observation explains the jump in mechanical response observed for the samples UV postcured for longer than 20 s (Figure 7a) and the two different linear relations presented in Figure 7b.
4.3.2. Effect of Light Intensity
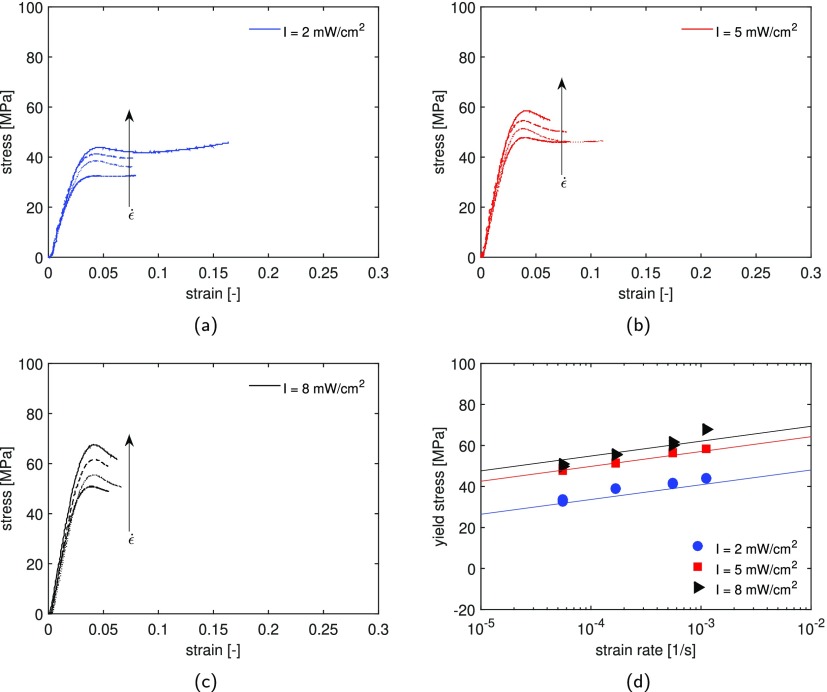
To study the effect of light intensity on the ultimate mechanical properties, tensile tests are carried out on samples maximally UV-cured for 200 s at different intensities. This ensures that all samples are in the glassy region at room temperature. The tests are performed at room temperature with constant strain rates ranging from 5.5 × 10⁻⁵ to 1.1 × 10⁻³ s–1. Stress as a function of strain for these experiments is plotted in Figure 8a–c. After the initial linear elastic region, with increasing strain, the system becomes more mobile, causing a deviation from the linear behavior. At the yield point, the mobility is so high that the plastic deformation rate equals the applied strain rate.46 At higher strain rates, this balance is achieved at higher stress, as observed in the strain-rate dependence of the mechanical response, see Figure 8a–c. After yielding, depending on the cross-linked network, strain softening is observed. The amount of softening varies depending on the process conditions applied during the sample preparation. It can be observed that the strain softening is less for samples cured at low light intensity, see Figure 8a. Therefore, in these systems, the segmental chain mobility is higher, leading to a lower resistance against deformation.
Figure 8.
Effect of intensity on the mechanical properties for formulations with 3 wt % of the initiator: stress–strain response for samples UV postcured for 200 s at a light intensity of (a) 2, (b) 5, and (c) 8 mW/cm2. The samples are measured at room temperature, for constant strain rates ranging from 5.5 × 10⁻⁵ to 1.1 × 10⁻³ s–1. (d) Yield stress vs applied strain rate for samples cured under different light intensities; the markers are the experimental results and the lines the fitting based on the Eyring equation (eq 30).
The yield stress as a function of the applied strain rate for the three studied systems is plotted in Figure 8d, in which the lines are the results of the Eyring equation. In order to describe the experimental results, the set of parameters shown in Table 3 is employed. The activation energy, ΔU, and activation volume, V*, are the same for the three systems. The rate factor ε̇0 decreases with increasing light intensity, and therefore with increasing glass-transition temperature. Samples cured at a lower light intensity display a lower yield stress, which is in accordance with the monomer conversion and glass-transition temperature evolutions reported in Figures 4b and 6a, respectively. An attempt has been made to predict the deformation kinetics for samples cured under different light intensities using the approach proposed by Parodi et al. for polyamides.47 This approach is based on the hypothesis that the distance to Tg determines the mechanical response. The decrease in glass-transition temperature for samples cured at a lower intensity can be seen as an apparent increase in the testing temperature. Therefore, the temperature T in the Eyring equation (eq 30) can be modified as
| 32 |
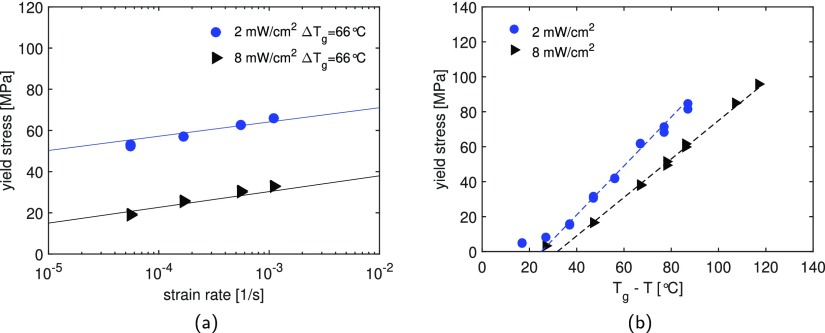
where T̃ is the apparent temperature, Tg,8mW/cm2 and Tg,Ix are the glass-transition temperatures of the sample cured at 8 mW/cm2 and at lower intensity Ix, respectively. Hence, the mechanical response of samples UV-cured under different intensities would be the same if tensile tests are performed at a temperature so as to keep the distance to Tg constant. The deformation kinetics for samples cured for 200 s at 2 and 8 mW/cm2 are shown in Figure 9a. For these specimens, tensile tests are performed at 10 and 40 °C, respectively, to keep the distance to Tg (ΔTg = Tg – T = 66 °C) constant. The lines are the results of the original Eyring prediction (eq 30), using the model parameters shown in Table 3 at testing temperatures of 10 and 40 °C. The results shown in Figure 9a seem to disagree with the hypothesis previously made. It is clear that the lower-intensity samples show a higher-yield stress compared to samples cured at 8 mW/cm2 when tested at a fixed temperature difference from Tg. Therefore, the influence of testing temperature is studied and the results are shown in Figure 9b. Tensile tests are performed at a constant strain rate, 5.5 × 10⁻⁵ s–1 and at different temperatures ranging from −20 to 80 °C. At very high temperatures, the temperature dependence of the yield stress flattens; this is due to the close proximity to Tg. When the yield stress is plotted versus Tg – T (Figure 9b), the data show a clearly different temperature dependence for the two systems studied. In particular, for a defined distance to Tg, the samples cured at a lower intensity always present a higher mechanical response.
Table 3. Eyring Parameters.
| I [mW/cm2] | V* [nm3] | ε̇0 [s–1] | ΔU [kJ/mol] |
|---|---|---|---|
| 2 | 13 | 10 × 1076 | 482 |
| 5 | 13 | 30 × 1073 | 482 |
| 8 | 13 | 60 × 1072 | 482 |
Figure 9.
(a) Strain rate dependence for samples maximally UV-cured at light intensities of 2 and 8 mW/cm2. Tensile tests are performed at 10 and 40 °C, respectively, to keep the distance from Tg (Tg – T = ΔTg = 66 °C) constant, illustrating a clear temperature dependence of the yield stress. The markers are experimental results and the lines are the model predictions. (b) Yield stress as a function of ΔTg with testing temperature ranging from −20 to 80 °C, tested at a constant strain rate of 5.5 × 10⁻⁴ s–1.
The yield stress data follow an engineering rule
| 33 |
where a [MPa/K] is the slope which is equal to 1.4 and 1.1 for samples UV-cured at intensities of 2 and 8 mW/cm2, respectively. These slopes are similar to those found in literature for thermoset polymers.48,49 Moreover, similar to our findings, Cook et al.48 have shown that uncross-linked polymers have a higher yield stress than the corresponding cross-linked material, suggesting that the systems have different molecular mobilities. Therefore, because of a different network structure, a unique correlation between Tg and mechanical properties cannot be found for the studied systems.
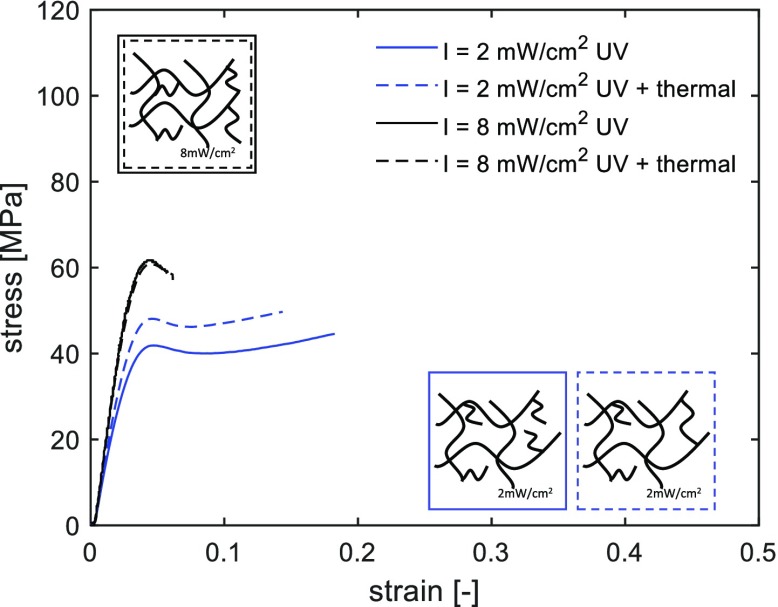
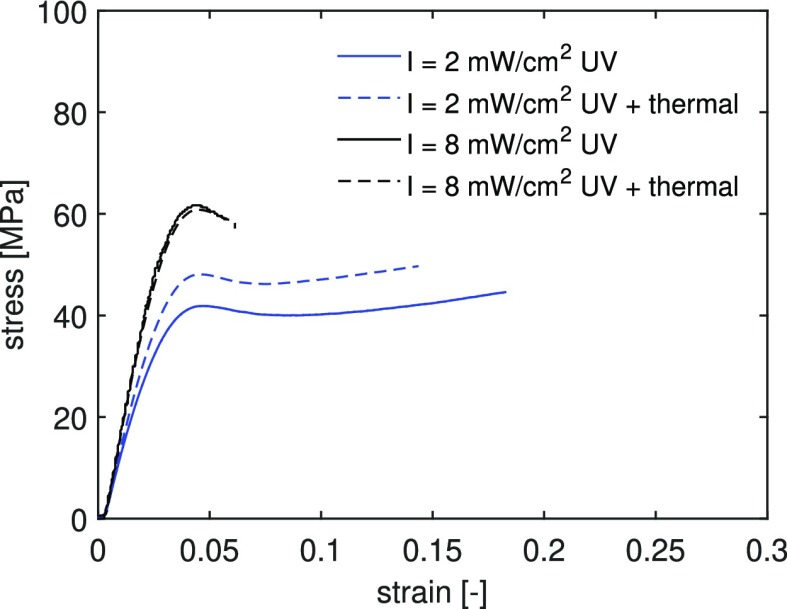
To study how the light intensity affects the cured network, a thermal postcuring treatment is performed on samples previously UV postcured for 200 s. In our previous work,34 we have shown that thermal postcuring leads to an increase in mechanical response because of the continued reaction of trapped radicals next to a thermodynamically more stable structure. The effect of thermal postcuring is shown in Figure 10. Samples cured at 8 mW/cm2 are not affected by the thermal treatment, whereas those cured at a lower intensity, 2 mW/cm2, show an increase in yield stress. This effect can be explained by the presence of dangling and uncured chains in the network of samples cured at a low intensity. These can further react when the network mobility is increased during thermal postcuring. This is in accordance with the lower Tg measured for these systems, see Figure 6a. On the other hand, samples cured at a high intensity have a denser network in which further polymerization cannot occur. Faster polymerization at a higher intensity produces shorter and more cross-linked polymers because of premature initiation in more points and faster termination of reactions.13
Figure 10.
Effect of thermal postcuring (150 °C for 30 min) on the mechanical response of samples UV-cured for 200 s under different UV light intensities. Tensile tests are performed at room temperature and at a constant strain rate of 5.5 × 10⁻⁴ s–1.
5. Conclusions
In this study, the effects of process conditions on the photopolymerization and mechanical properties of a UV-cured methacrylate resin are investigated. First, the effects of curing time, light intensity, and initiator concentration on the monomer conversion are presented. The monomer conversion shows an increase with increasing curing time, reaching a plateau value after 200 s of irradiation. The influence on the polymerization kinetics of light intensity and initiator concentration is similar: an increase in polymerization rate is observed with increasing intensity and initiator concentration. A model is developed based on the reaction kinetics of photopolymerization that describes the experimental data. The effects of light intensity and initiator concentration are predicted within reasonable accuracy. To investigate the influence of process conditions on the mechanical properties, dynamic mechanical analysis and tensile tests are performed. A similar trend as for the monomer conversion is found: the glass-transition temperature increases with increasing curing time and UV light intensity. A unique correlation exists between the glass-transition temperature and the conversion, irrespective of the light intensity and curing time. Similarly, the yield stress increases with curing time until maximum conversion is reached. However, the UV light intensity causes structural changes that affect the yield stress. Low intensity causes the presence of unconverted and dangling chains in the UV-cured networks, which lower the glass-transition temperature and yield stress to a different extent. Therefore, the mechanical response is not determined by the distance to Tg, as common in other systems.47 As a matter of fact, the resins UV-cured at various intensities show different evolutions of yield stress as a function of temperature. Finally, thermal postcuring treatments are performed on maximally cured samples. The results show an increase in yield stress only in samples UV-cured at a low intensity. This characteristic confirms the presence of dangling chains in the network that can further react when the network mobility is increased during thermal postcuring treatments. Therefore, the light intensity at which the resin is cured strongly affects the network structure, consequently affecting the ultimate mechanical properties. This work provides a complete characterization of UV-cured methacrylate systems. It reveals that no direct correlation exists between reaction kinetics and mechanical properties because of the dependence of the microstructure on the processing conditions. Hence, microstructural information is required to relate mechanical properties to processing conditions. However, experimentally determining the relevant microstructural characteristics is not trivial.
Acknowledgments
This work forms part of the research programme of the Brightlands Materials Center (BMC). The authors thank the groups of Macromolecular and Organic Chemistry for the use of the FTIR equipment.
Supporting Information Available
The Supporting Information is available free of charge at https://pubs.acs.org/doi/10.1021/acs.macromol.9b01439. .
Sensitivity study for the model (PDF)
Author Contributions
§ R.A. and W.P. contributed equally to this work.
The authors declare no competing financial interest.
Supplementary Material
References
- Bártolo P. J.Stereolithography; Springer, 2011. [Google Scholar]
- Lecamp L.; Youssef B.; Bunel C.; Lebaudy P. Photoinitiated polymerization of a dimethacrylate oligomer: 1. Influence of photoinitiator concentration, temperature and light intensity. Polymer 1997, 38, 6089–6096. 10.1016/s0032-3861(97)00184-5. [DOI] [Google Scholar]
- Fuh J. Y. H.; Lu L.; Tan C. C.; Shen Z. X.; Chew S. Processing and characterising photo-sensitive polymer in the rapid prototyping process. J. Mater. Process. Technol. 1999, 89–90, 211–217. 10.1016/s0924-0136(99)00073-4. [DOI] [Google Scholar]
- Fuh J. Y. H.; Chew S. Curing characteristics of acrylic photopolymer used in stereolithography process. Rapid Prototyp. J. 1999, 5, 27–34. 10.1108/13552549910251855. [DOI] [Google Scholar]
- Ang B. Y.; Chua C. K.; Du Z. H. Study of trapped material in rapid prototyping parts. Int. J. Adv. Manuf. Technol. 2000, 16, 120–130. 10.1007/s001700050017. [DOI] [Google Scholar]
- Onuh S. O.; Hon K. K. B. Improving stereolithography part accuracy for industrial applications. Int. J. Adv. Manuf. Technol. 2001, 17, 61–68. 10.1007/s001700170210. [DOI] [Google Scholar]
- Lu L.; Fuh J. Y. H.; Nee A. Y. C.; Kang E. T.; Miyazawa T.; Cheah C. M. Origin of shrinkage, distortion and fracture of photopolymerized material. Mater. Res. Bull. 1995, 30, 1561–1569. 10.1016/0025-5408(95)00118-2. [DOI] [Google Scholar]
- Achilias D. S.; Kipasissides C. Development of a General Mathematical Framework for Modeling Diffusion-Controlled Free-Radical Polymerization Reactions. Macromolecules 1992, 25, 3739–3750. 10.1021/ma00040a021. [DOI] [Google Scholar]
- Andrzejewska E. Photopolymerization kinetics of multifunctional monomers. Prog. Polym. Sci. 2001, 26, 605–665. 10.1016/s0079-6700(01)00004-1. [DOI] [Google Scholar]
- Bowman C. N.; Kloxin C. J. Toward an enhanced understanding and implementation of photopolymerization reactions. AIChE J. 2008, 54, 2775–2795. 10.1002/aic.11678. [DOI] [Google Scholar]
- Lovell L. G.; Newman S. M.; Donaldson M. M.; Bowman C. N. The effect of light intensity on double bond conversion and flexural strength of a model, unfilled dental resin. Dent. Mater. 2003, 19, 458–465. 10.1016/s0109-5641(02)00090-8. [DOI] [PubMed] [Google Scholar]
- Nomoto R.; Uchida K.; Hirasawa T. Effect of light intensity on polymerization of light-cured composite resins. Dent. Mater. J. 1994, 13, 198–205. 10.4012/dmj.13.198. [DOI] [PubMed] [Google Scholar]
- Miyazaki M.; Oshida Y.; Keith Moore B.; Onose H. Effect of light exposure on fracture toughness and flexural strength of light-cured composites. Dent. Mater. 1996, 12, 328–332. 10.1016/s0109-5641(96)80042-x. [DOI] [PubMed] [Google Scholar]
- Lovell L. G.; Lu H.; Elliott J. E.; Stansbury J. W.; Bowman C. N. The effect of cure rate on the mechanical properties of dental resins. Dent. Mater. 2001, 17, 504–511. 10.1016/s0109-5641(01)00010-0. [DOI] [PubMed] [Google Scholar]
- Goodner M. D.; Bowman C. N. Development of a comprehensive free radical photopolymerization model incorporating heat and mass transfer effects in thick films. Chem. Eng. Sci. 2002, 57, 887–900. 10.1016/s0009-2509(01)00287-1. [DOI] [Google Scholar]
- Keramopoulos A.; Kiparissides C. Development of a comprehensive model for diffusion-controlled free-radical copolymerization reactions. Macromolecules 2002, 35, 4155–4166. 10.1021/ma010999q. [DOI] [Google Scholar]
- Gleeson M. R.; Liu S.; Guo J.; Sheridan J. T. Non-local photo-polymerization kinetics including multiple termination mechanisms and dark reactions: Part III Primary radical generation and inhibition. J. Opt. Soc. Am. B 2010, 27, 1804. 10.1364/josab.27.001804. [DOI] [Google Scholar]
- Boddapati A.Modeling Cure Depth During Photopolymerization of Multifunctional Acrylates. M.Sc. Thesis, Georgia Institute of Technology, May, 2010. [Google Scholar]
- Jariwala A. S.; Ding F.; Boddapati A.; Breedveld V.; Grover M. A.; Henderson C. L.; Rosen D. W. Modeling effects of oxygen inhibition in mask-based stereolithography. Rapid Prototyp. J. 2011, 17, 168–175. 10.1108/13552541111124734. [DOI] [Google Scholar]
- Young R. J.; Lovell P. A.. Introduction to Polymers; Chapman and Hall, 2011; Vol. 3. [Google Scholar]
- Decker C.Kinetic Analysis and Performance of UV-Curable Coatings. Radiation Curing; Springer, 1992; pp 135–179. [Google Scholar]
- Chatani S.; Kloxin C. J.; Bowman C. N. The power of light in polymer science: photochemical processes to manipulate polymer formation, structure, and properties. Polym. Chem. 2014, 5, 2187–2201. 10.1039/c3py01334k. [DOI] [Google Scholar]
- Anseth K. S.; Bowman C. N. Reaction diffusion enhanced termination in polymerizations of multifunctional monomers. Polym. React. Eng. 1993, 1, 499–520. 10.1080/10543414.1992.10744442. [DOI] [Google Scholar]
- Anseth K. S.; Wang C. M.; Bowman C. N. Kinetic Evidence of Reaction Diffusion during the Polymerization of Multi(meth)acrylate Monomers. Macromolecules 1994, 27, 650–655. 10.1021/ma00081a004. [DOI] [Google Scholar]
- Arlman E. J.; Wagner W. M. Volume contraction and conversion in the bulk polymerization of vinylidene chloride and vinyl chloride. Trans. Faraday Soc. 1953, 49, 832. 10.1039/tf9534900832. [DOI] [Google Scholar]
- Achilias D. S. A review of modeling of diffusion controlled polymerization reactions. Macromol. Theory Simul. 2007, 16, 319–347. 10.1002/mats.200700003. [DOI] [Google Scholar]
- Hale A.; Macosko C. W.; Bair H. E. Glass transition temperature as a function of conversion in thermosetting polymers. Macromolecules 1991, 24, 2610–2621. 10.1021/ma00009a072. [DOI] [Google Scholar]
- Pascault J. P.; Williams R. J. J. Glass transition temperature versus conversion relationships for thermosetting polymers. J. Polym. Sci., Part B: Polym. Phys. 1990, 28, 85–95. 10.1002/polb.1990.090280107. [DOI] [Google Scholar]
- Nielsen L. E. Cross-Linking-Effect on Physical Properties of Polymers. J. Macromol. Sci., Part C: Polym. Rev. 1969, 3, 69–103. 10.1080/15583726908545897. [DOI] [Google Scholar]
- DiBenedetto A. T. Prediction of the glass transition temperature of polymers: A model based on the principle of corresponding states. J. Polym. Sci., Part B: Polym. Phys. 1987, 25, 1949–1969. 10.1002/polb.1987.090250914. [DOI] [Google Scholar]
- Adabbo H. E.; Williams R. J. J. The evolution of thermosetting polymers in a conversion-temperature phase diagram. J. Appl. Polym. Sci. 1982, 27, 1327–1334. 10.1002/app.1982.070270422. [DOI] [Google Scholar]
- Couchman P. R. Thermodynamics and the Compositional Variation of Glass Transition Temperatures. Macromolecules 1987, 20, 1712–1717. 10.1021/ma00173a045. [DOI] [Google Scholar]
- Eyring H. Viscosity, plasticity, and diffusion as examples of absolute reaction rates. J. Chem. Phys. 1936, 4, 283–291. 10.1063/1.1749836. [DOI] [Google Scholar]
- Anastasio R.; Maassen E. E. L.; Cardinaels R.; Peters G. W. M.; van Breemen L. C. A. Thin film mechanical characterization of uv-curing acrylate systems. Polymer 2018, 150, 84–94. 10.1016/j.polymer.2018.07.015. [DOI] [Google Scholar]
- Whitbeck M. R. Second Derivative Infrared Spectroscopy. Appl. Spectrosc. 1981, 35, 93–95. 10.1366/0003702814731851. [DOI] [Google Scholar]
- Collares F. M.; Portella F. F.; Leitune V. C. B.; Samuel S. M. W. Discrepancies in degree of conversion measurements by FTIR. Braz. Oral Res. 2014, 28, 9–15. 10.1590/s1806-83242013000600002. [DOI] [PubMed] [Google Scholar]
- Stansbury J. W. Dimethacrylate network formation and polymer property evolution as determined by the selection of monomers and curing conditions. Dent. Mater. 2012, 28, 13–22. 10.1016/j.dental.2011.09.005. [DOI] [PMC free article] [PubMed] [Google Scholar]
- Gupta V. B.; Brahatheeswaran C. Molecular packing and free volume in crosslinked epoxy networks. Polymer 1991, 32, 1875–1884. 10.1016/0032-3861(91)90379-w. [DOI] [Google Scholar]
- Lovelh L. G.; Newman S. M.; Bowman C. N. The effects of light intensity, temperature, and comonomer composition on the polymerization behavior of dimethacrylate dental resins. J. Dent. Res. 1999, 78, 1469–1476. 10.1177/00220345990780081301. [DOI] [PubMed] [Google Scholar]
- Decker C. The use of UV irradiation in polymerization. Polym. Int. 1998, 45, 133–141. . [DOI] [Google Scholar]
- Tripathy R.; Crivello J. V.; Faust R. Photoinitiated polymerization of acrylate, methacrylate, and vinyl ether end-functional polyisobutylene macromonomers. J. Polym. Sci., Part A: Polym. Chem. 2013, 51, 305–317. 10.1002/pola.26379. [DOI] [Google Scholar]
- Suzuki Y.; Cousins D.; Wassgren J.; Kappes B. B.; Dorgan J.; Stebner A. P. Kinetics and temperature evolution during the bulk polymerization of methyl methacrylate for vacuum-assisted resin transfer molding. Composites, Part A 2018, 104, 60–67. 10.1016/j.compositesa.2017.10.022. [DOI] [Google Scholar]
- Unterbrink G. L.; Muessner R. Influence of light intensity on two restorative systems. J. Dent. 1995, 23, 183–189. 10.1016/0300-5712(95)93577-o. [DOI] [PubMed] [Google Scholar]
- Li C.; Strachan A. Evolution of network topology of bifunctional epoxy thermosets during cure and its relationship to thermo-mechanical properties: A molecular dynamics study. Polymer 2015, 75, 151–160. 10.1016/j.polymer.2015.08.037. [DOI] [Google Scholar]
- Steyrer B.; Neubauer P.; Liska R.; Stampfl J. Visible light photoinitiator for 3D-printing of tough methacrylate resins. Materials 2017, 10, 1445. 10.3390/ma10121445. [DOI] [PMC free article] [PubMed] [Google Scholar]
- Caelers H. J. M.; Parodi E.; Cavallo D.; Peters G. W. M.; Govaert L. E. Deformation and failure kinetics of ipp polymorphs. J. Polym. Sci., Part B: Polym. Phys. 2017, 55, 729–747. 10.1002/polb.24325. [DOI] [Google Scholar]
- Parodi E.; Peters G. W. M.; Govaert L. E. Prediction of plasticity-controlled failure in polyamide 6: influence of temperature and relative humidity. J. Appl. Polym. Sci. 2018, 135, 45942. 10.1002/app.45942. [DOI] [Google Scholar]
- Cook W. D.; Mayr A. E.; Edward G. H. Yielding behaviour in model epoxy thermosets—II. Temperature dependence. Polymer 1998, 39, 3725–3733. 10.1016/s0032-3861(97)10335-4. [DOI] [Google Scholar]
- Tcharkhtchi A.; Faivre S.; Roy L. E.; Trotignon J. P.; Verdu J. Mechanical properties of thermosets. J. Mater. Sci. 1996, 31, 2687–2692. 10.1007/bf00687301. [DOI] [Google Scholar]
Associated Data
This section collects any data citations, data availability statements, or supplementary materials included in this article.


