

Abstract
Fluorescence imaging in the second near-infrared (NIR-II) window holds impressive advantages of enhanced penetration depth and improved signal-to-noise ratio. Bright NIR-II fluorophores with renal excretion ability and low tissue accumulation are favorable for in vivo molecular imaging applications as they can render the target-mediated molecular imaging process easily distinguishable. Here, a probe (anti-PD-L1-BGP6) comprising a fluorophore (IR-BGP6) covalently bonded to the programmed cell death ligand-1 monoclonal antibody (PD-L1 mAb) for molecular imaging of immune checkpoint PD-L1 (a targeting site upregulated in various tumors for cancer imaging) in the NIR-II window is reported. Through molecular optimization, the bright NIR-II fluorophore IR-BGP6 with fast renal excretion (≈91% excretion in general through urine within the first 10 h postinjection) is developed. The conjugate anti-PD-L1-BGP6 succeeds in profiling PD-L1 expression and realizes efficient noninvasive molecular imaging in vivo, achieving a tumor to normal tissue (T/NT) signal ratio as high as ≈9.5. Compared with the NIR-II fluorophore with high nonspecific tissue accumulation, IR-BGP6 derived PD-L1 imaging significantly enhances the molecular imaging performance, serving as a strong tool for potentially studying underlying mechanism of immunotherapy. The work provides rationales to design renal-excreted NIR-II fluorophores and illustrate their advantages for in vivo molecular imaging.
Keywords: molecular imaging, NIR-II fluorophore, PD-L1, renal excretion
1. Introduction
Immune checkpoints are essential for maintaining self-tolerance and modulating the duration and amplitude of immune responses.[1] Programmed cell death ligand-1 (PD-L1), a 290 amino acid type I transmembrane glycoprotein overexpressed in various tumors, is the primary ligand of programmed death-1 (PD-1).[2] Experimental evidence suggests that PD-L1 against tumor antigen-specific T cells constitutes a major mechanism of immune resistance.[3] Antibodies targeting PD-L1 (MPDL3280A, MEDI4736 and BMS- 936559) have demonstrated antitumor activities in diverse tumor types, suggesting that expression of PD-L1 in tissue biopsies is a valuable biomarker for immune checkpoint therapies.[4] In this regard, there is a growing need to develop in vivo imaging modalities for PD-L1.[5] In vivo imaging based on fluorescence in the second near-infrared window (NIR-II, 1000–1700 nm) has attracted increasing attentions owing to the advantages of low tissue scattering and minimal autofluorescence, affording high contrast ratio and deep tissue penetration.[6] Thus far, organic and inorganic materials such as small molecules,[7] polymers,[8] carbon nanotubes,[9] quantum dots,[10] and rare earth particles,[11] have been developed as NIR-II fluorophores. However, most of the currently available NIR-II fluorophores might raise critical safety concerns due to their long-term retention and accumulation in the body postimaging. In addition, they are not optimal for in vivo molecular imaging in consideration of the high nonspecific accumulation within tissues overtime, which would make the target-mediated molecular imaging process hardly distinguished from nontargeted imaging behaviors.[12] In this regard, NIR-II fluorophores with superior excretion feature and low tissue accumulation appear to be favorable candidates for in vivo molecular imaging and could potentially facilitate clinical translation of NIR-II imaging. So far, very few NIR-II fluorophores demonstrate renal excretion with low tissue accumulation, and successful examples include small molecules CH1055-PEG[13] and IR-E1.[14] However, these molecular fluorophores exhibited relatively low fluorescence quantum yield (QY) in aqueous solutions (≈0.3% and ≈0.7% for CH1055-PEG and IR-E1, respectively) with room for further improving excretion kinetics (≈90% and ≈83% renal excretion within the first 24 h postinjection for CH1055-PEG and IR-E1, respectively).[13,14]
Herein, we employed a probe consisting of the programmed cell death ligand-1 monoclonal antibody (PD-L1 mAb) and a NIR-II molecular fluorophore (IR-BGP6) with fast renal excretion for molecular imaging of immune checkpoint PD-L1. Based on the shielding unit-donor-acceptor-donor-shielding unit (S–D–A–D–S) backbone,[7a] we developed a series of molecular fluorophores emitting in the NIR-II window with QY of 0.9–3.0% through tuning the side chains on the shielding unit. IR-BGP6 with C6 side chains was identified as the optimized fluorophore demonstrating fast renal excretion (≈91% excretion in general through urine within the first 10 h postinjection) and relatively high QY (≈1.5%). With IR-BGP6 in hand, we conjugated it with PD-L1 mAb to afford a probe (anti-PD-L1-BGP6) specific to PD-L1. When applied for in vivo applications, anti-PD-L1-BGP6 succeeded in targeting PD-L1 expressed on MC38 tumors with a high signal ratio of tumors to normal tissues (T/NT ≈9.5), and also efficiently discriminated PD-L1 expression discrepancy between MC38 and 4T1 tumors. Molecular imaging of PD-L1 was more distinguishable from nontargeting imaging behaviors based on renal-excreted IR-BGP6 compared with that based on the NIR-II fluorophore IR-FEP with slow excretion kinetics, demonstrating the superiority of IR-BGP6 for the in vivo molecular imaging application.
2. Results and Discussion
2.1. Optimization of Molecular Fluorophores Beneficial for Improved Renal Excretion and QY
Bright NIR-II fluorophores with renal excretion ability are preferred for in vivo molecular imaging applications. Especially, fast excretion kinetics and low nonspecific accumulation within tissues of fluorophores can maximize the target-mediated imaging signal to be easily distinguished from nontargeted imaging behaviors.[12] For the optimization of molecular structures beneficial for renal excretion and fluorescence emission, a series of molecular fluorophores with similar building units were developed based on the shielding unit–donor–acceptor–donor–shielding unit (S–D–A–D–S) structure[7a,b,8b] (Figure 1a). Considering the superior renal excretion ability of IR-E1 to IR-FEP based on our previous studies,[7a,14] we adopted substituted benzene with alkoxyl chains anchored on the 2,6 positions as the shielding unit. Compared with the thiophene-3,4-ethylenedioxythiophene donor in IR-E1, removal of thiophene is beneficial for improving QY[7c] and TEG substituted thiophene can afford better aqueous solubility, appearing to be more reliable for renal excretion. [7a,b] Besides above designs, the length of alkoxy chain on the shielding unit was varied to afford the fluorophores IR-BGP3, IR-BGP6, and IR-BGP11 with 3 carbons, 6 carbons, and 11 carbons on the alkoxy chains, respectively. The length increase of the extended alkoxy chain can lead to better protection of the conjugated backbone, which would reduce nonradioactive decay.[7c] The synthetic procedures and structural characterizations of these fluorophores are provided in Figures S1–S4 and Table S1 of the Supporting Information. These fluorophores exhibit similar absorption with peaks ranging from 714 to 763 nm in aqueous solution (Figure 1b; Table S1, Supporting Information). Under the excitation of an 808 nm laser, the fluorophores emitted fluorescence ranging from 900 to 1400 nm with peaks at around 1047 nm. The relative QY was measured to be 0.9%, 1.5%, and 3% for IR-BGP3, IR-BGP6, and IR-BGP11, respectively, based on the reference fluorophore of HiPCO carbon nanotube with QY of 0.4%,[7a] suggesting the longer alkoxyl chain in shielding unit could benefit the maintenance of QY in aqueous solutions.
Figure 1.
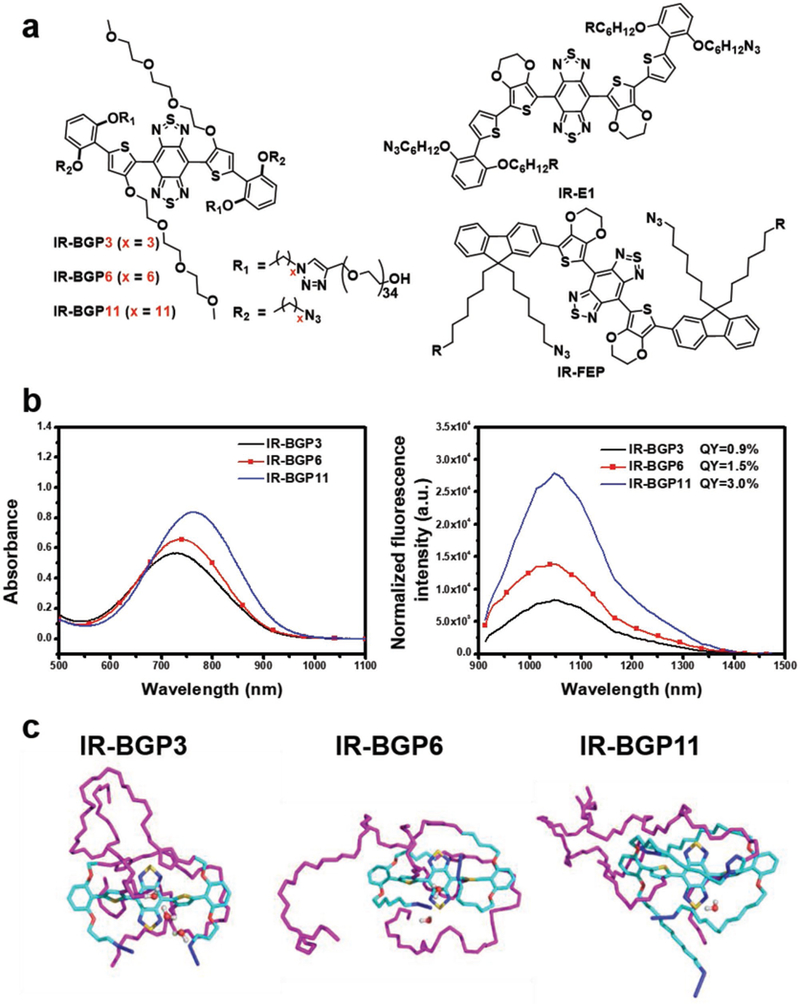
Structures, optical characterizations, and molecular dynamics simulations of the NIR-II molecular fluorophores. a) Chemical structures of the designed NIR-II molecular fluorophores. b) Absorption (left) and emission (right) spectra of the corresponding NIR-II molecular fluorophores in aqueous environment. An 808 nm laser was used for excitation with exposure time of 50 ms. The fluorescence intensity was normalized with the optical density of sample solution at 808 nm. c) Molecular dynamics (MD) simulations of the NIR-II molecular fluorophores in aqueous environment (front view). PEG chain: purple; carbon atom: cyan; oxygen atom: red; sulfur atom: yellow; nitrogen: blue. The concentration of IR-BGP3, IR-BGP6, and IR-BGP11 used for measurement was 10 × 10−6 m. The buffer for dispersing fluorophores was 1X PBS with pH = 7.4.
Molecular dynamics (MD) simulations were performed to understand underlying mechanism regarding the influence of length of alkoxy chains (Figure 1c; Figure S5a, Supporting Information). It has been found that interactions with water molecules are proposed as a major factor lowering the QY of NIR-II fluorophores in aqueous solutions.[7a,c] The optimized geometry of fluorophore molecule was initially solvated in a water cubic box with side length of 10 Å and equilibration ran for 60 ns. As shown in Figure 1c, the C3 alkoxyl chain on IR-BGP3 only covers the donor unit next to the shielding unit. As the length of alkoxyl chain increases, the C6 alkoxyl chain on IR-BGP6 reaches the acceptor unit and C11 alkoxyl chain even covers the whole D–A–D unit on IR-BGP11 (Figure 1c). The alkoxyl chains extending on the conjugated backbone can reduce the possibility of water interactions due to their hydrophobicity and steric hindrance. As a result, the probability of water molecules existing around the acceptor core is reflected by the radial distribution function (RDF) (Figure S5b, Supporting Information). It is clear that IR-BGP11 possesses the smallest RDF value, which represents the fewest surrounding water molecules and the water molecules can only exist at a farther distance from the acceptor core compared with IR-BGP3 and IR-BGP6. It is in line with the trend in QY, indicating that IR-BGP11 affords the lowest water interactions and the acceptor core is well protected by the long C11 alkoxyl chain.
2.2. Excretion Behaviors of the Designed NIR-II Molecular Fluorophores
We initially conducted the excretion study of the designed NIR-II fluorophores. After intravenous administration of fluorophore aqueous solutions, shaved mice in the supine position were imaged in the NIR-II window over 1100 nm as a function of time (Figure 2a). In mice injected with IR-BGP6 or IR-BGP3, fluorescence signals were mainly located in bladder at 10 min postinjection (p.i.), and gradually declined with most signals gone at 24 h p.i. On the sharp contrast, most fluorescence signals were located in liver at ≈10 min p.i. for mice injected with IR-BGP11. The signals kept increasing to 3 h p.i. and then slowly declined. By quantifying fluorescence signals in bladder and liver as a function of time (Figure 2b,c), it was clearly observed that IR-BGP6 and IR-BGP3 demonstrated the superior renal excretion ability and accumulated negligibly in liver. Whilst IR-BGP11 was largely retained in liver and partially in other normal tissues and excreted slowly similar to most previously reported fluorophores.[7a,8b]
Figure 2.

Excretion behaviors of the NIR-II molecular fluorophores. a) Wide-field fluorescence imaging of mice injected with IR-BGP3, IR-BGP6, or IR-BGP11 as a function of time. b) Representative background subtracted fluorescence signal of the bladder as a function of time for mice injected with IR-BGP3, IR-BGP6, and IR-BGP11, respectively. c) Long-term monitoring (up to 24 h) of liver fluorescence signals of mice injected with IR-BGP3, IR-BGP6, and IR-BGP11, respectively. All the fluorescence imaging was taken in the NIR-II window (>1100 nm).
To further understand the discrepancy of excretion behaviors, physiochemical properties of the screened fluorophores were investigated. The hydrodynamic diameter of IR-BGP3, IR-BGP6 and IR-BGP11 determined by dynamic light scattering analysis was ≈2.7, ≈3.5, and ≈40 nm, respectively (Figure S6a and Table S3, Supporting Information). The size information was also confirmed by TEM images, revealing the aggregated state of IR-BGP11 in aqueous environment which is consistent with the red-shifted absorption (Figure S6b, Supporting Information). It is suggested that the size cutoff for renal excretion is ≈5.5 nm,[12a] which makes IR-BGP11 difficult to be renally excreted. MD simulations mentioned above also provides insights into the different excretion behaviors among these three fluorophores (Figure 1c). The IR-BGP3 and IR-BGP6 molecules are fully covered with antifouling chains of poly (ethylene glycol). By contrast, the IR-BGP11 molecules expose certain hydrophobic part to surrounding aqueous environment due to the long alkoxy chains. This could cause the hydrophobic aggregation in aqueous solutions to exceed the size cutoff of renal excretion and nonspecific interaction with biomolecules in vivo. NIR-II molecular fluorophores with the fluorene as the shielding unit (such as IR-FEP[7a]) also suffer a similar problem as the hydrophobic conjugated backbone is exposed for possible biomolecule binding (Figure S7, Supporting Information). Overall, IR-BGP6 achieved a balance of optimal QY and renal excretion ability, demonstrating to be the best candidate for following molecular imaging applications.
2.3. Pharmacokinetics and Biocompatibility of IR-BGP6
After confirming the optimized fluorophore for biological imaging studies, we further systematically evaluated the pharmacokinetics and biocompatibility of IR-BGP6. IR-BGP6 revealed superior photostability compared with clinically available fluorophores (ICG/IRDye800) in aqueous environment, which is favorable for repeated imaging events and long-term monitoring (Figure S8, Supporting Information). Mice were intravenously injected with IR-BGP6 at the same dose used for subsequent biological imaging. Renal excretion kinetics was obtained through collecting urine over the course of 24 h. The collected urine emitted fluorescence in the NIR-II window (>1000 nm) owing to the existence of IR-BGP6 (Figure 3a; For the better observation, fluorescence images of urine were obtained using capillary tubes). ≈91% of IR-BGP6 was excreted through urine from most mice within the first 10 h p.i. (Figure 3b; Figure S9, Supporting Information), faster than that of other renal-excreted NIR-II fluorophores reported by us recently (≈90% and ≈83% renal excretion within the first 24 h p.i. for CH1055-PEG and IR-E1, respectively).[13,14] As shown in Figure 3c, the percentage of IR-BGP6 in blood was ≈84.3% ID g–1 at 6 min p.i. and declined to ≈15.8% ID g−1 at 1 h p.i., showing a blood half-life time of ≈24 min, in consistent with the fast renal excretion kinetics. Biodistribution at 24 h p.i. showed very low fluorescence signal remained within all major organs taken from mice injected with IR-BGP6, in striking contrast to the high nonspecific accumulation of other fluorophores, i.e., IR-BGP11 and IR-FEP[7a] within organs (Figure 3d; Figure S10, Supporting Information). The trapping of fluorophores within organs would confuse the targeted imaging process with non-targeted imaging behaviors, making IR-BGP11 and IR-FEP not optimal for in vivo molecular imaging applications.
Figure 3.

Pharmacokinetics and biocompatibility of IR-BGP6. a) Collections of urine of mice injected with IR-BGP6 and their corresponding fluorescence images. b) Quantification of renal excretion of IR-BGP6 by calculation of its amount in urine. ≈91% IR-BGP6 can be renally excreted within the first 10 h p.i. c) The blood circulation behavior of IR-BGP6. The fast renal excretion of IR-BGP6 corresponded to the short blood circulation half-life time (≈24 min). d) Comparison of the biodistribution among different NIR-II molecular fluorophores at 24 h p.i. e) Variation of body weight of mice injected with PBS buffer (control, red spots) and IR-BGP6. (black spots), respectively.
In vivo toxicity of IR-BGP6 was examined at 1 and 21 days p.i. Body weight showed no significant difference between PBS and IR-BGP6 treated groups (Figure 3e). Pathology analysis by H&E staining indicated no morphological changes in all the tested organs (Figure S11, Supporting Information). Both blood cell subtypes and serum biochemistry results showed that all the indicators were within the normal range (Table S4, Supporting Information). Collectively, all the evaluations revealed the high biocompatibility of IR-BGP6.
2.4. In Vitro Profiling of PD-L1
Molecular imaging in the NIR-II window with better signal-to-noise ratio could provide a more holistic view of PD-L1 expression to guide the therapeutic management.[15] With IR-BGP6 in hand, we conjugated it with the PD-L1 mAb to afford anti- PD-L1-BGP6 under mild conjugation conditions based on the copper-free click chemistry, avoiding the loss of protein activity (Figure 4a).[7b] Before in vivo applications, we first tested the ability of anti-PD-L1-BGP6 in recognizing PD-L1 using MC38 cancer cells, on which PD-L1 is over-expressed.[16] Unlabeled free IR-BGP6 was applied as the negative control. To avoid the endocytosis effect as much as possible, cell experiments were performed at 4 °C for 30 min based on previous studies.[17] After incubation with anti-PD-L1-BGP6 and IR-BGP6, respectively, cells were fixed for nucleus staining, followed by imaging under our home-built NIR-II confocal setup. Strong NIR-II fluorescence signal was detected within anti-PD-L1-BGP6 treated MC38 cells while free IR-BGP6 incubated cells showed negligible signal. After overlaying with nucleus, it was clearly observed that most signal distributed on the outer cell membrane, suggesting the selective binding of PD-L1 (Figure 4b).
Figure 4.

In vitro profiling of PD-L1. a) Scheme of the conjugation of PD-L1 mAb with IR-BGP6. b) Comparison of the in vitro targeting ability of anti-PD-L1-BGP6 and IR-BGP6 using PD-L1 positive cancer cell line MC38. c) In vitro profiling of PD-L1 using anti-PD-L1-BGP6. PD-L1 expression level: MC38 > 4T1 > HEK293. Fluorescence emitting from anti-PD-L1-BGP6 and IR-BGP6 was collected beyond 1000 nm. Fluorescence emitting form nucleus was collected within 650–800 nm
Then, we continued to profile PD-L1 expression level in various cell lines. For comparison, we chose MC38, 4T1, and HEK293 cell lines to incubate with anti-PD-L1-BGP6, on which the PD-L1 expression level is MC38 > 4T1 > HEK293 in sequence.[16] Under the same incubation conditions, highest fluorescence signal emitting from anti-PD-L1-BGP6 was found in MC38 cells, followed by moderate signal in 4T1 cells and low signal in HEK293 cells. Through statistical analyses of fluorescence signals, significant difference of PD-L1 expression level was found among these cell lines (p <0.01), confirming the specificity of anti-PD-L1-BGP6 toward PD-L1 (Figure 4c). These in vitro experiments validated the ability of anti-PD-L1-BGP6 for profiling PD-L1.
2.5. In Vivo Molecular Imaging of Immune Checkpoint PD-L1
Inspired by the in vitro results, we moved forward to apply anti-PD-L1-BGP6 for noninvasive molecular imaging of immune checkpoint PD-L1 in vivo. Mice inoculated with MC38 tumors were divided into three groups, including anti-PD-L1-BGP6 treated group (anti-PD-L1-BGP6-G, positive group), IR-BGP6 treated group (BGP6-G, negative control group), and PD-L1 mAb blocked group (anti-PD-L1-BGP6-BLG, negative control group; detailed information was given in the Experimental Section). The signal ratio of tumors to normal tissues (T/NT) was monitored as a function of time through collection of fluorescence emitting beyond 1200 nm after intravenous injection of corresponding materials (Figure 5b). For anti-PD-L1-BGP6-G, the T/NT ratio increased overtime and reached the peak value of ≈9.5 at 24 h p.i., much higher than that of PD-L1 molecular imaging based on NIR-I fluorophores (T/NT: ≈2–3),[4a,5a] confirming the advantages of in vivo imaging in the NIR-II window. On the contrary, the T/NT ratio kept remaining low within the monitored time period for BGP6-G and anti-PD-L1-BGP6-BLG and the corresponding peak T/NT value was ≈2.6 and 3.2 at 3 and 9 h p.i., respectively, substantially lower than that of anti-PD-L1-BGP6-G. Through statistical analyses, significant difference of the T/NT ratio was found between the positive group and negative control groups (p < 0.01, Figure 5a–c). More specifically, fast renal excretion of IR-BGP6 in BGP6-G sacrificed the gradual nonspecific accumulation of fluorophores within tumors through the enhanced permeability and retention (EPR) effect.[8b] And saturation of PD-L1 binding sites with free PD-L1 mAb in anti-PD-L1-BGP6-BLG blocked the interaction of PD-L1 with anti-PD-L1-BGP6. These resulted in lower T/NT ratios at all the monitored time points in BGP6-G and anti-PD-L1-BGP6-BLG, rendering PD-L1-mediated molecular imaging process in anti-PD-L1- BGP6-G more unambiguous. Ex vivo imaging of organs taken from mice in anti-PD-L1-BGP6-G further confirmed that most anti-PD-L1-BGP6 accumulated within tumors in contrast to the relatively low remaining within other major organs (Figure S12, Supporting Information).
Figure 5.

Noninvasive molecular imaging of immune checkpoint PD-L1 in vivo. a) Molecular imaging of PD-L1 expressed on tumors as a function of time in the NIR-II window (>1200 nm). Anti-PD-L1-BGP6-G refers to the group of mice injected with anti-PD-L1-BGP6; BGP6-G refers to the group of mice injected with free IR-BGP6. Anti-PD-L1-BGP6-BLG refers to the group of mice blocked with free PD-L1 mAb, followed by injection of anti-PD-L1- BGP6-BLG. b,c) Quantitative evaluation of the in vivo targeting ability of anti-PD-L1-BGP6 toward immune checkpoint PD-L1.
Then we progressed to evaluate the ability of anti-PD-L1-BGP6 for in vivo profiling of PD-L1 expression. 4T1 tumors, which expressed less PD-L1 than MC38 tumors, were inoculated onto C57 mice under the similar conditions for MC38 tumors. And same amount of anti-PD-L1-BGP6 was intravenously injected, followed by monitoring how the T/NT ratio varied as a function of time. On the whole, the T/NT variation was similar to that in the case of MC38 tumors, but with lower value at each monitored time point (p < 0.01, Figure 5a–c), which was consistent with the in vitro results, suggesting the efficient discrimination of PD-L1 expression level between different tumor models in vivo.
To reveal the superiority of IR-BGP6 with fast renal excretion and low tissue accumulation in in vivo molecular imaging more intuitively, we in parallel compared the in vivo PD-L1 imaging performance between anti-PD-L1-BGP6 and anti-PD-L1-FEP (conjugation method for anti-PD-L1-FEP was similar to that for anti-PD-L1-BGP6). In terms of the high nonspecific accumulation of IR-FEP within tumors through the EPR effect,[7a] the T/NT ratio could reach as high as ≈4.5 in mice injected with free IR-FEP, which was not much different from that in mice injected with anti-PD-L1-FEP (T/NT ≈7.2), resulting in two times lower ratio of PD-L1-mediated T/NT to nontargeting T/NT than that based on IR-BGP6 (Figure S13, Supporting Information).
The attachment of IR-BGP6 onto PD-L1 mAb sacrificed its renal excretion ability possibly due to the increase of size (Figure S14, Supporting Information). We assumed the gradual digestion of mAb in vivo[18] may still hold a chance to release IR-BGP6 from anti-PD-L1-BGP6 for relatively fast excretion. To test this, we injected anti-PD-L1-BGP6 or anti-PD-L1-FEP in mice and monitored the fluorescence signal variation within the body over one month. Obviously, the fluorescence signal declined much faster in mice injected with anti-PD-L1-BGP6 than those injected with anti-PD-L1-FEP (Figure S15, Supporting Information), further reflecting the advantages of IR-BGP6 for in vivo imaging applications. The superior in vivo NIR-II molecular imaging ability combined with relatively fast excretion encouraged us to explore potential clinical applications of anti-PD-L1-BGP6. We then performed proof-of-concept NIR-II image-guided tumor excision surgery using anti-PD-L1-BGP6 at 24 h p.i. The high T/NT ratio resulting from in vivo molecular imaging in the NIR-II window allowed us to precisely locate the MC38 tumor to avoid from damaging other normal tissues. The completely disappeared red signal after surgery proved the successful tumor excision (Figure S16, Supporting Information).
3. Conclusion
In summary, we explored the design of bright renal-excreted NIR-II fluorophores through the molecular engineering of building units, which was further illustrated by MD simulations, providing insights into the development of other renal-excreted fluorophores in the future. With all the efforts, an NIR-II molecular fluorophore (IR-BGP6), achieving a balance of relatively high QY and superior renal excretion was obtained. The fast excretion kinetics and low tissue accumulation of IR-BGP6 are beneficial for in vivo molecular imaging. We modified IR-BGP6 with PD-L1 mAb (anti-PD-L1-BGP6) and performed the first molecular imaging of immune checkpoint PD-L1 in the NIR-II window with the anti-PD-L1-BGP6 conjugate. Anti-PD-L1-BGP6 could efficiently differentiate the PD-L1 expression level among different cell lines in vitro. Benefiting from advantages of imaging in the NIR-II window and relatively fast excretion, anti-PD-L1-BGP6 realized efficient molecular imaging of PD-L1 in vivo with a high T/NT ratio of ≈9.5 to precisely locate the tumors. In paralleled comparison with the fluorophore (IR-FEP) possessing high tissue accumulation revealed the distinct advantage of IR-BGP6 in better discrimination of PD-L1-mediated targeting from nontargeting behaviors, affording a potential probe for future in-depth study of underlying mechanism of immunotherapy. Our study also highlights the superiority of NIR-II fluorophores with fast renal excretion and low tissue accumulation for in vivo molecular imaging.
4. Experimental Section
Conjugating IR-BGP6 or IR-FEP with PD-L1 mAb:
Briefly, the molar ratio of PD-L1 mAb:fluorophore:linker was 1:5:10 to afford the conjugate with 2–3 dyes per protein. For a typical reaction, 200 μL PD-L1 mAb (13.6 × 10⁻⁶ M) and 8.9 μL DBCO-PEG4-NHS linker (3.08 × 10⁻³ M in DMSO) were added in 100 μL PBS sequentially. The mixture was vortexed a bit and reacted by shaking or stirring for 2 h at room temperature. After the reaction, the product was washed by centrifugal filter with molecular weight cutoff (MWCO) of 30 kDa for four times against PBS buffer to remove excess free linker. Then, 47 μL IR-BGP6 or IR-FEP (292 × 10–6 M) was added into the above solution. The mixture was vortexed a bit and reacted by shaking or stirring for 3 h. The resulting product was subjected to washing with PBS buffer for four times by centrifugal filter with MWCO of 100 kDa to remove excess free fluorophore.
In Vitro Profiling of PD-L1:
To confirm anti-PD-L1-BGP6 can bind to PD-L1 expressed on cells, MC38 cancer cells (positively expressing PD-L1) were seeded at a number of 5 × 10³ per well in chambered slides as two groups with 400 μL DMEM cell media. After cells were incubated in a humidified atmosphere of 5% CO2 at 37 °C for 12 h, the cells were washed twice with 400 μL cold PBS buffer (4°C). Anti-PD-L1-BGP6 or IR-BGP6 was subsequently added into each group, respectively, at the same O.D. (808 nm) and interacted with the cells for 30 min at 4°C, followed by twice wash with cold PBS buffer. The MC38 cells were then fixed with 4% paraformaldehyde for 30 min at room temperature and nucleus were stained using 100 μL DRAQ5 (1 × 10⁻⁶ M). In the end, the fixed cells were imaged under a home-built NIR-II confocal microscope with both NIR-I and NIR-II channels.
To demonstrate the ability of anti-PD-L1-BGP6 in profiling PD-L1 level expressed on different cell lines, cells with different expression extents of PD-L1 (PD-L1 positive level: MC38 > 4T1 > HEK293) were seeded at a number of 5 × 10⁴ per well in chambered slides as three groups with corresponding cell media for 12 h incubation. After that, cells were washed with cold PBS buffer twice and applied with anti-PD-L1-BGP6 for 30 min incubation at 4°C, followed by twice wash with cold PBS buffer. The cells were then fixed with 4% paraformaldehyde for 30 min at room temperature and nucleus were stained using 100 μL of 1 × 10⁻⁶ M DRAQ5. In the end, the fixed cells were imaged under a home- built NIR-II confocal microscope. For anti-PD-L1-BGP6 and IR-BGP6 channel, the excitation laser was 785 and 1000 nm long-pass emission filter was used. For nucleus channel, the excitation laser was 658 and 690 nm long-pass with 750 nm short-pass emission filters were used.
Noninvasive Molecular Imaging of Immune Checkpoint PD-L1 In Vivo:
Unless otherwise noted, all NIR-II wide-field fluorescence images were recorded using a 2D liquid-nitrogen cooled InGaAs camera (Princeton Instruments 2D OMA-V, USA) under the excitation of an 808 nm laser (RPMC Lasers, USA). C57 mice inoculated with MC38 or 4T1 tumors were placed on an imaging stage positioned in front of the InGaAs camera. An 808 nm fiber-coupled diode laser (RPMC Lasers, USA) was used as the excitation source at the laser power of 70 mW cm–2 and an excitation filter set (850 and 1000 nm short-pass filter) was used to filter the excitation light. Fluorescence images were plotted and analyzed using MATLAB software. Mice inoculated with tumors were divided into four groups to evaluate the molecular imaging ability of anti-PD-L1-BGP6. In detail, for the positive experimental group, mice with MC38 tumors were injected with anti-PD-L1-BGP6 (anti-PD-L1-BGP6-G). For the negative control group 1, mice with MC38 tumors were injected with free IR-BGP6 (BGP6-BG). For the negative control group 2, mice with MC38 tumors were first injected with 400 μg free PD-L1 mAb to saturate the binding sites on tumors, followed by another injection of anti-PD-L1-BGP6 (anti-PD-L1-BGP6-BG). For the negative control group 3, mice with 4T1 tumors were injected with anti-PD-L1-BGP6. The used amount of materials is on the basis of IR-BGP6 with O.D. = 0.5 at 808 nm. The signal ratio of tumors to nearby normal tissues was monitored as a function of time. Ex vivo NIR-II imaging of organs taken from mice injected with anti-PD-L1-BGP6 was performed at 24 h p.i. All fluorescence signal was collected beyond 1200 nm and the exposure time was 500 ms.
Evaluation of Pharmacokinetics and Biocompatibility of IR-BGP6:
5–16 mice were used for pharmacokinetics, excretion, and biodistribution studies for each experiment group. All mice were intravenously injected with IR-BGP6 at a dose of 2 mg kg–1. The blood was collected at needed time points using a capillary tube from the retro-orbital sinus, and then diluted with EDTA-Na2 solution (0.5 M). The concentration of IR-BGP6 in blood was estimated by the fluorescence intensity using a fluorescence imaging system (Maestro systems) at 800–900 nm, under the excitation of 750 nm light. And collected blood was imaged ex vivo. The percentage of IR-BGP6 in blood was calculated with subtracting the background from the blood of healthy mice. Main organs including intestine, liver, heart, spleen, lung, kidney, brain, and stomach were collected for fluorescence imaging. In this study we used organ homogenate instead of intact tissues to precisely quantify the biodistribution of IR-BGP6. The homogenate solution was obtained by complete ultrasonication of tissues (IKA, T18, ULTRA-TURRAX) in saline. Afterward, all samples were placed for hours to facilitate the residue sedimentation, followed by twice centrifugation. The biodistribution was quantified by the fluorescence signal in organ homogenate. Background was subtracted based on corresponding organ homogenate from mice without fluorophore injection. For excretion experiments, urine was collected for 24 h. All processed samples were tested by fluorescence spectrophotometer and imaged by fluorescence imaging system. The amount of excretion was calculated as follow
| (1) |
V = injected volume, and I = fluorescence intensity.
C57 mice (7–8 weeks) were employed for toxicity experiments and randomly divided into two groups (n = 5), which were labeled as control and treated groups for 10 days. After intravenous injection of the C57 mice at the same dose of 5 mg kg–1, mice were weighed every day and sacrificed at 24 h p.i. for hematology, serum biochemistry, and pathology studies. Blood of each mouse was collected and analyzed by the NIH Blood Center. The rest of the blood samples were maintained at 4 °C overnight, then centrifuged at 6000 rpm for 8 min. The supernatant serum was separated for biochemistry testing. For pathology evaluation, all mice were sacrificed by anesthesia and exsanguination. Main organs including heart, liver, spleen, lung, kidney, etc. were fixed in 10% formalin for 48 h and made into paraffin sections. All slides were processed according to a standard H&E staining protocol and checked by an optical microscope (Olympus).
Mouse Handling:
Mouse handling was approved by Stanford University’s administrative panel on Laboratory Animal Care. All experiments were performed in accordance with the National Institutes of Health Guide for the Care and Use of Laboratory Animals. C57 and CD1 mice were purchased from Charles River. Bedding, nesting material, food, and water were provided. The surrounding relative humidity level was 55–65% and temperature was around 25 °C. 6-week-old C57 mice were shaved and inoculated with ≈1 million MC38 colon cancer cells on the right side for tumor growth. All experiments relating to mice were replicated within 3–6 times. The sample sizes of mice were selected based on previously reported studies. Mice were randomly selected from cages for all experiments. No blinding was performed. All relevant data are available from authors.
Statistical Analyses:
Results were presented as mean ± SD. Statistical significance was determined by a two-tailed Student’s t test. A p-value of less than 0.05 was considered significant.
MD Simulations:
For each fluorophore molecule, its structure was initially optimized with Gaussian 09 program at the HF/6–31G* level, and then restrained electrostatic potential charges and the General Amber Force Field were assigned for the optimized structure. The initial structure was immersed in the center of a truncated octahedral box of TIP3P water molecules, and all of the peptide atoms were no less than 1 nm from the boundary of the water box. Counterions were added to neutralize the system. To remove bad contacts before the simulation, 8000 steps of steepest descent followed by 2000 steps of conjugate gradient energy minimizations were carried out. The relaxed structure was then gently heated from 0 to 300 K in 50 ps and equilibrated for 50 ps with weak restraints on each molecule, which was equilibrated for another 500 ps at constant pressure without restraint. Production simulations were extended to 60 ns for each molecule and trajectories were saved every 2 ps. All bonds with hydrogen atoms were fixed using the SHAKE algorithm. The particle mesh Ewald method with an 8 Å cutoff in real space was used to calculate electrostatic interaction. A Langevin thermostat with a collision frequency of 1.0 ps–1 was used to regulate temperature. Isotropic pressure coupling with a relaxation time of 2 ps was used to maintain the pressure to 1 atm.
Supplementary Material
Acknowledgements
H.W., H.M., and S.Z. contributed equally to this work. Y.L. acknowledges financial supports from the National Science Foundation of China (21772084). H.S. thanks the National Science Foundation of China (21603074 and 11774094), “Chenguang Program” by Shanghai Education Development Foundation and Shanghai Municipal Education Commission (16CG25) for funding support. H.S. acknowledge the ECNU IT Research Computing Team for providing computational and storage resources. This study was also supported by the National Institutes of Health (DP1-NS-105737), the Calbrain program, and the Shenzhen Peacock Program Grant (KQTD20140630160825828).
Footnotes
Supporting Information
Supporting Information is available from the Wiley Online Library or from the author.
Conflict of Interest
The authors declare no conflict of interest.
Contributor Information
Hao Wan, Department of Chemistry, Stanford University, Stanford, CA 94305, USA.
Huilong Ma, Department of Materials Science and Engineering, South University of Science and Technology of China, Shenzhen 518055, China.
Shoujun Zhu, Department of Chemistry, Stanford University, Stanford, CA 94305, USA.
FeiFei Wang, Department of Chemistry, Stanford University, Stanford, CA 94305, USA.
Ye Tian, Department of Chemistry, Stanford University, Stanford, CA 94305, USA.
Rui Ma, Department of Materials Science and Engineering, South University of Science and Technology of China, Shenzhen 518055, China.
Qinglai Yang, Department of Materials Science and Engineering, South University of Science and Technology of China, Shenzhen 518055, China.
Zhubin Hu, State Key Laboratory of Precision Spectroscopy, School of Physics and Materials Science, East China Normal University Shanghai 200062, China.
Tong Zhu, School of Chemistry and Molecular Engineering, East China Normal University, Shanghai 200062, China.
Weizhi Wang, Department of Chemistry, Stanford University, Stanford, CA 94305, USA.
Zhuoran Ma, Department of Chemistry, Stanford University, Stanford, CA 94305, USA.
Mingxi Zhang, Department of Chemistry, Stanford University, Stanford, CA 94305, USA.
Yeteng Zhong, Department of Chemistry, Stanford University, Stanford, CA 94305, USA.
Haitao Sun, State Key Laboratory of Precision Spectroscopy, School of Physics and Materials Science, East China Normal University Shanghai 200062, China; Collaborative Innovation Center of Extreme Optics, Shanxi University Taiyuan, Shanxi 030006, P. R. China.
Yongye Liang, Department of Materials Science and Engineering, South University of Science and Technology of China, Shenzhen 518055, China.
Hongjie Dai, Department of Chemistry, Stanford University, Stanford, CA 94305, USA.
References
- [1].a) Dai L, Li K, Li M, Zhao X, Luo Z, Lu L, Luo Y, Cai K, Adv. Funct. Mater. 2018, 28, 1077249; [Google Scholar]; b) Acharya A, Sinha M, Ratay M, Ding X, Balmert S, Workman C, Wang Y, Vignali D, Little S, Adv. Funct. Mater. 2017, 27, 1604366; [Google Scholar]; c) Bose CK, Contemp. Oncol. 2017, 21, 189; [DOI] [PMC free article] [PubMed] [Google Scholar]; d) Kim HJ, Evoli A, Neurology 2017, 89, 1101; [DOI] [PubMed] [Google Scholar]; e) Pardoll DM, Nat. Rev. Cancer 2012, 12, 252; [DOI] [PMC free article] [PubMed] [Google Scholar]; f) Zhang X, Wang C, Wang J, Hu Q, Langworthy B, Ye Y, Sun W, Lin J, Wang T, Fine J, Cheng H, Dotti G, Huang P, Gu Z, Adv. Mater. 2018, 30, 1707112. [DOI] [PubMed] [Google Scholar]
- [2].a) Li K, Tian H, J. Drug Target. 2018, 7, 1; [Google Scholar]; b) Zhu X, Lang J, 2017, 28, e64. [DOI] [PMC free article] [PubMed] [Google Scholar]
- [3].a) Gajewski TF, Schreiber H, Fu YX, Nat. Immunol. 2013, 14, 1014; [DOI] [PMC free article] [PubMed] [Google Scholar]; b) Maleki Vareki S, Garrigos C, I. Duran, Crit. Rev Oncol./Hematol. 2017, 116, 116. [DOI] [PubMed] [Google Scholar]
- [4].a) Chatterjee S, Lesniak WG, Gabrielson M, Lisok A, Wharram B, Sysa-Shah P, Azad BB, Pomper MG, Nimmagadda S, Onco-target 2016, 7, 10215; [DOI] [PMC free article] [PubMed] [Google Scholar]; b) Tsai KK, Zarzoso I, Daud AI, Hum. Vaccines Immunother. 2014, 10, 3111; [DOI] [PMC free article] [PubMed] [Google Scholar]; c) Philips GK, Atkins M, Int. Immunol. 2015, 27, 39. [DOI] [PubMed] [Google Scholar]
- [5].a) Chatterjee S, Lesniak WG, Nimmagadda S, Mol. Imaging 2017, 16, 1; [DOI] [PMC free article] [PubMed] [Google Scholar]; b) Shields BD, Mahmoud F, Taylor EM, Byrum SD, Sengupta D, Koss B, Baldini G, Ransom S, Cline K, Mackintosh SG, Edmondson RD, Shalin S, Tackett AJ, Sci. Rep. 2017, 7, 807; [DOI] [PMC free article] [PubMed] [Google Scholar]; c) Masucci GV, Cesano A, Hawtin R, Janetzki S, Zhang J, Kirsch I, Dobbin KK, Alvarez J, Robbins PB, Selvan SR, Streicher HZ, Butterfield LH, Thurin M,Immunother J. Cancer 2016, 4, 76. [DOI] [PMC free article] [PubMed] [Google Scholar]
- [6].a) Hong G, Antaris AL, Dai H, Nat. Biomed. Eng. 2017, 1, 0010; [Google Scholar]; b) Qi J, Sun C, Zebibula A, Zhang H, Kwok Ryan TK, Zhao X, Xi W, Lam Jacky WY, Qian J, Tang Ben Z, Adv. Mater. 2018, 30, 1706856; [DOI] [PubMed] [Google Scholar]; c) Sun Y, Ding M, Zeng X, Xiao Y, Wu H, Zhou H, Ding B, Qu C, Hou W, Er-bu AGA, Zhang Y, Cheng Z, Hong X, Chem. Sci. 2017, 8, 3489. [DOI] [PMC free article] [PubMed] [Google Scholar]
- [7].a) Yang Q, Ma Z, Wang H, Zhou B, Zhu S, Zhong Y, Wang J, Wan H, Antaris A, Ma R, Zhang X, Yang J, Zhang X, Sun H, Liu W, Liang Y, Dai H, Adv. Mater. 2017, 29, 1605497; [DOI] [PubMed] [Google Scholar]; b) Zhu S, Yang Q, Antaris AL, Yue J, Ma Z, Wang H, Huang W, Wan H, Wang J, Diao S, Zhang B, Li X, Zhong Y, Yu K, Hong G, Luo J, Liang Y, Dai H, Proc. Natl. Acad. Sci. USA 2017, 114, 962; [DOI] [PMC free article] [PubMed] [Google Scholar]; c) Yang Q, Hu Z, Zhu S, Ma R, Ma H, Ma Z, Wan H, Zhu T, Jiang Z, Liu W, Jiao L, Sun H, Liang Y, Dai H, J. Am. Chem. Soc. 2018, 140, 1715. [DOI] [PubMed] [Google Scholar]
- [8].a) Hong G, Zou Y, Antaris AL, Diao S, Wu D, Cheng K, Zhang X, Chen C, Liu B, He Y, Wu JZ, Yuan J, Zhang B, Tao Z, Fukunaga C, Dai H, Nat. Commun. 2014, 5, 4206; [DOI] [PubMed] [Google Scholar]; b) Wan H, Yue J, Zhu S, Uno T, Zhang X, Yang Q, Yu K, Hong G, Wang J, Li L, Ma Z, Gao H, Zhong Y, Su J, Antaris AL, Xia Y, Luo J, Liang Y, Dai H, Nat. Commun. 2018, 9, 1171. [DOI] [PMC free article] [PubMed] [Google Scholar]
- [9].a) Diao S, Blackburn Jeffrey L, Hong G, Antaris Alexander L, Chang J, Wu Justin Z, Zhang B, Cheng K, Kuo Calvin J, Dai H, Angew. Chem., Int. Ed. 2015, 54, 14758; [DOI] [PubMed] [Google Scholar]; b) Welsher K, Liu Z, Sherlock SP, Robinson JT, Chen Z, Daranciang D, Dai H, Nat. Nanotechnol. 2009, 4, 773. [DOI] [PMC free article] [PubMed] [Google Scholar]
- [10].a) Bruns OT, Bischof TS, Harris DK, Franke D, Shi Y, Riedemann L, Bartelt A, Jaworski FB, Carr JA, Rowlands CJ, Wilson MWB, Chen O, Wei H, Hwang GW, Montana DM, Coropceanu I, Achorn OB, Kloepper J, Heeren J, So PTC, Fukumura D, Jensen KF, Jain RK, Bawendi MG, Nat. Biomed. Eng. 2017, 1, 0056; [DOI] [PMC free article] [PubMed] [Google Scholar]; b) Hong G, Robinson Joshua T, Zhang Y, Diao S, Antaris Alexander L, Wang Q, Dai H, Angew. Chem., Int. Ed. 2012, 51, 9818. [DOI] [PubMed] [Google Scholar]
- [11].a) Liu L, Wang S, Zhao B, Pei P, Fan Y, Li X, Zhang F, 2018, 57, 7518; [DOI] [PubMed] [Google Scholar]; b) Zhong Y, Ma Z, Zhu S, Yue J, Zhang M, Antaris AL, Yuan J, Cui R, Wan H, Zhou Y, Wang W, Huang NF, Luo J, Hu Z, Dai H, Nat. Commun. 2017, 8, 737. [DOI] [PMC free article] [PubMed] [Google Scholar]
- [12].a) Soo Choi H, Liu W, Misra P, Tanaka E, Zimmer JP, Ittylpe B, Bawendi MG, Frangioni JV, Nat. Biotechnol. 2007, 25, 1165; [DOI] [PMC free article] [PubMed] [Google Scholar]; b) Hilderbrand SA, Weissleder R, Curr. Opin. Chem. Biol. 2010, 14, 71; [DOI] [PubMed] [Google Scholar]; c) Gambhir SS, Nat. Rev. Cancer 2002, 2, 683. [DOI] [PubMed] [Google Scholar]
- [13].Antaris AL, Chen H, Cheng K, Sun Y, Hong G, Qu C, Diao S, Deng Z, Hu X, Zhang B, Zhang X, Yaghi OK, Alamparambil ZR, Hong X, Cheng Z, Dai H, Nat. Mater. 2016, 15, 235. [DOI] [PubMed] [Google Scholar]
- [14].Zhang X-D, Wang H, Antaris Alexander L, Li L, Diao S, Ma R, Nguyen A, Hong G, Ma Z, Wang J, Zhu S, Castellano Joseph M, Wyss-Coray T, Liang Y, Luo J, Dai H, Adv. Mater. 2016, 28, 6872. [DOI] [PMC free article] [PubMed] [Google Scholar]
- [15].Truillet C, Oh HLJ, Yeo SP, Lee CY, Huynh LT, Wei J, Parker MFL, Blakely C, Sevillano N, Wang YH, Shen YS, Olivas V, Jami KM, Moroz A, Jego B, Jaumain E, Fong L, Craik CS, Bioconjugate Chem. 2018, 29, 96. [DOI] [PMC free article] [PubMed] [Google Scholar]
- [16].Tang H, Wang Y, Chlewicki LK, Zhang Y, Guo J, Liang W, Wang J, Wang X, Fu YX, Cancer Cell 2016, 29, 285. [DOI] [PMC free article] [PubMed] [Google Scholar]
- [17].a) Chang C-C, Wu M, Yuan F, Mol. Therapy – Methods Clin. Dev. 2014, 1, 14058; [DOI] [PMC free article] [PubMed] [Google Scholar]; b) Wolkers WF, Looper SA, Fontanilla RA, Tsvetkova NM, Tablin F, Crowe JH, Biochim. Biophys. Acta, Biomembr. 2003, 1612, 154. [DOI] [PubMed] [Google Scholar]
- [18].Wright A, Sato Y, Okada T, Chang KH, Endo T, Morrison SL, Glycobiology 2000, 10, 1347. [DOI] [PubMed] [Google Scholar]
Associated Data
This section collects any data citations, data availability statements, or supplementary materials included in this article.