Abstract
We describe an imunoassay based on fluorescence resonance energy transfer (FRET). The antigen was human serum albumin (HSA), which was labeled with a ruthenium-ligand complex, [Ru(bpy)2(phen-ITC)]2+. The antibody (IgG) to HSA was labeled with a nonfluorescent absorber, Reactive Blue 4. Association of the Ru-labeled HSA with the antibody was detected by three spectral parameters, a decreased quantum yield of Ru-HSA, a decrease in its fluorescence lifetime, and an increase in its fluorescence anisotropy. The steady-state anisotropy of Ru-HSA increased approximately eightfold upon binding to the antibody. These spectral effects were observed both in the direct association of the Ru-HSA with Reactive Blue 4-labeled antibody, and in a competitive assay format wherein unlabeled HSA competed with Ru-HSA for the binding sites on the antibody. Some nonspecific interactions of HSA may have occurred with Reactive Blue 4-labeled AHA, a difficulty which can be avoided with a different acceptor. The use of FRET provides a reliable means to alter the spectral properties upon antigen-antibody binding. The advantages of a ruthenium-ligand fluorophore include its long-wavelength absorption and emission, long fluorescence lifetime, and high photostability. Long wavelengths minimize problems of autofluorescence from biological samples, and long lifetimes allow off-gating of the prompt autofluorescence.
Immunoassays have been widely used for the detection of drugs, antigens, and other biological molecules since the introduction of radioimmune assays (RIAs)1 by R. Yalow and co-workers (1). Because of the difficulties and expense of handling radioactive isotopes, the RIAs have been progressively replaced with optical immunoassays primarily based on fluorescence detection (2–4). Fluorescence immunoassays have been based on a number of spectral properties, including the use of fluorogenic substrates in the ELISA assays (3), the long-lived emission from lanthanides (5), chemiluminescence (6), the use of fluorescence resonance energy transfer (FRET) to detect antigen-antibody association (7–9), fluorescence polarization to measure changes in the rotational correlation time, and fluorescence quenching or enhancement (10–14). In all of these methods the assays are based on the use of organic fluorophores which display fluorescence lifetimes in the range of 1–10 ns. Typically fluorophores like fluorescein require excitation with green or shorter wavelengths. The use of fluorophores with nanosecond decay times does not provide the opportunity to reject the interfering autofluorescence, which usually decays on a similar timescale. The sensitivity of fluorescence immunoassays is typically limited by autofluorescence rather than by the low fluorescence intensities from dilute samples.
Among the mechanisms described above, FRET is perhaps the most versatile because it is a through-space interaction which occurs over distances of 20–70 Å (15,16), which are comparable to the size of typical antigens and antibodies. In the present report we describe a FRET immunoassay based on the use of a ruthenium (Ru) metal-ligand complex as the donor. We chose to use a Ru complex because these probes display long luminescence lifetimes (17,18) and are chemically and photochemically stable (19). The long lifetimes will allow off-gating of the interfering autofluorescence, an approach which has increased the sensitivity in the so-called “time-resolved” immunoassays based on lanthanide luminescence (5,20).
An additional advantage of the long lifetimes of the Ru complexes is the possibility of lifetime-based sensing with simple instrumentation. In recent years it has been recognized that there are advantages to measuring lifetimes rather than fluorescence intensities (21,22). Lifetime-based sensing schemes have been developed for a number of analytes (22). The use of a metal-ligand complex allows lifetime-based sensing with simple instrumentation, as has been shown using an electroluminescent sheet as the light source for phase angle lifetime measurements of [Ru(Ph2phen)3]2+ (23). A further advantage of the Ru complex is that the long lifetimes allow the measurement of rotational correlation times up to 1 μs (19,24,25), and thus detection of high-molecular-weight analytes (19).
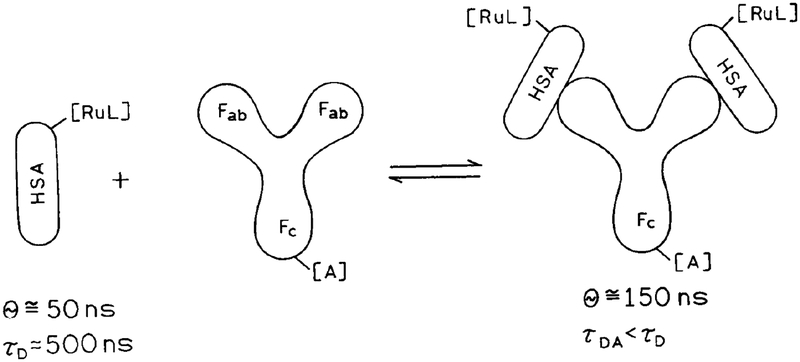
Because of the numerous potential applications of immunoassays based on metal-ligand complexes, we developed the present assay based on fluorescence resonance energy transfer. This immunoassay is illustrated in Scheme I. As an antigen we used human serum albumin (HSA) covalently labeled with the donor [Ru(bpy)2(phen-ITC)]2+. The antibody (anti-human serum albumin, AHA) was labeled with the acceptor Reactive Blue 4. Chemical structures of the donor and acceptor are shown in Scheme II. We found that the intensity and decay time of the Ru-labeled antigen decreased upon binding to acceptor-labeled antibody, and the anisotropy increased. Given the possibility of measuring lifetimes in scattering media (26), it should be possible to develop practical homogeneous immunoassays based on FRET and lifetime measurements of metal-ligand complexes.
Scheme I.
Schematic of the energy transfer immunoassay based on Ru-labeled HSA as the donor-antigen and RB4-AHA as acceptor-antibody.
Scheme II.
Ruthenium metal-ligand donor (left) and Reactive Blue 4 acceptor (right) used in the energy transfer immunoassay.
MATERIALS AND METHODS
Polyclonal IgG specific for HSA (anti-HSA) from chicken was purchased from O. M. E. Concepts. Nonspecific human IgG and HSA were purchased from Sigma Chemical Co., and used without further purification. All other chemicals were purchased from the Aldrich Chemical Co., and used without further purification. The chemical structures of the Ru complex and the acceptor Reactive Blue 4 (RB4) are shown in Scheme II.
Synthesis of [Ru(bpy)2(phen-NH2)]2+
A total of 0.97 g (2 mmol) of Ru(bpy)2Cl2 and 0.4 g 9-amino-1,10-phenanthroline were refluxed in 30 ml MeOH/water (1:2) for several hours. After cooling to room temperature, the MeOH was removed by rotary evaporation and the complex was precipitated by adding an excess of NH4PF6 to the remaining water solution. Purification was achieved by column chromatography on alumina using toluene:acetonitrile (1:2) as eluent. The first band was collected. The yield was 1.46 g.
Synthesis of [Ru(bpy)2(phen-ITC)2+
A total of 0.224 g (0.25 mmol) of Ru(bpy)2(phen-NH2) was dissolved in 3 ml dry acetone. Finely crushed CaCO3 powder (0.09 g, 0.9 mmol) and 22 μl (0.14 mmol) of thiophosgene were added to this solution and the mixture was stirred for 1 h at room temperature, followed by 2.5 h of heating under reflux. After cooling to room temperature, the CaCO3 was filtered and the acetone was removed under reduced pressure to yield 0.205 g of product (27).
Labeling of HSA with [Ru(bpy)2(phen-ITC)]2+
HSA was labeled by adding 10 μl aliquots of [Ru(bpy)2(phen-ITC)]2+ in DMSO up to a 5- to 20-fold molar excess to a stirred solution of 3.4 mg HSA in 1.6 ml NaHCO3 (500 mM, 0.85% NaCl, pH 9.0) followed by a 2.5-h incubation at room temperature. The reaction was stopped by adding 150 μl of NH2OH·HCl dissolved in 0.5 M NaHCO3 including 0.85% NaCl. Free MLC was separated from the Ru-labeled antigen by gel filtration chromatography on Sephadex G-25, using 10 mm MOPS, pH 7.4, including 0.85% NaCl. The dye/protein ratio of the Ru-HSA conjugate was estimated by measuring the absorbance of the Ru conjugate at 450 nm (ϵ450 = 15,000 m−1 cm−1) and a separate determination of the protein concentration by the Lowry method. The molar dye:protein ratio of the conjugate was found to be 6:1 with an estimated protein concentration of 0.4 mg/ml.
Preparation of the RB4-Antibody Conjugate
Aliquots of 58 μl of aqueous RB4 solution (7.1 mg/ml) were added to a stirred mixture of 1.5 ml anti-HSA (1 mg/ml) stock solution and 1 ml of 500 mmNaHCO3, pH 9.0, with 0.85% NaCl (for pH adjustment) up to a 30-fold molar excess of RB4 versus antibody. After 2.5 h incubation at room temperature the reaction was stopped by addition of 150 μl of NH2OH·HCl and the mixture was allowed to stir for 0.5 h. Then the solution was applied to a small gel filtration column (1.7 × 4.2 cm, packed with Sephadex G-25) and eluted with 10 mm MOPS buffer, pH 7.4. The majority of free dye was separated from the dye-conjugate by this procedure. Further purification of the dye-conjugate was achieved by a second gel fltration column using same conditions as above followed by dialysis in MOPS buffer (10 mm, pH 7.4) for 18 h. The estimated protein concentration in the dye-conjugate was 0.13 mg/ml with an estimated dye:protein ratio of 12:1 (Lowry method).
Fluorescence Measurements
Fluorescence emission spectra were recorded on a SLM Model 8000 spectrofluorometer under magic angle polarization conditions. The excitation and emission bandpass were 16 nm, unless otherwise stated. For steady-state anisotropy measurements the sample was excited at 485 nm, which was the maximum of the excitation anisotropy spectrum. Fluorescence intensity and anisotropy decays were measured by time-correlated single photon counting (TCSPC). The primary light source was a cavity-dumped (1 MHz) pyridine 1 dye laser, frequency doubled to 360 nm. This dye laser was pumped by a mode-locked Nd:YAG laser. For time-resolved intensity decays we used 360 nm as the excitation wavelength for our Ru complex. The emission was isolated using either a monochromator centered at 600 nm for steady-state anisotropy measurements, or a 600-nm interference filter with a 10-nm bandpass for time-resolved measurements using magic angle conditions.
HSA Immunoassay
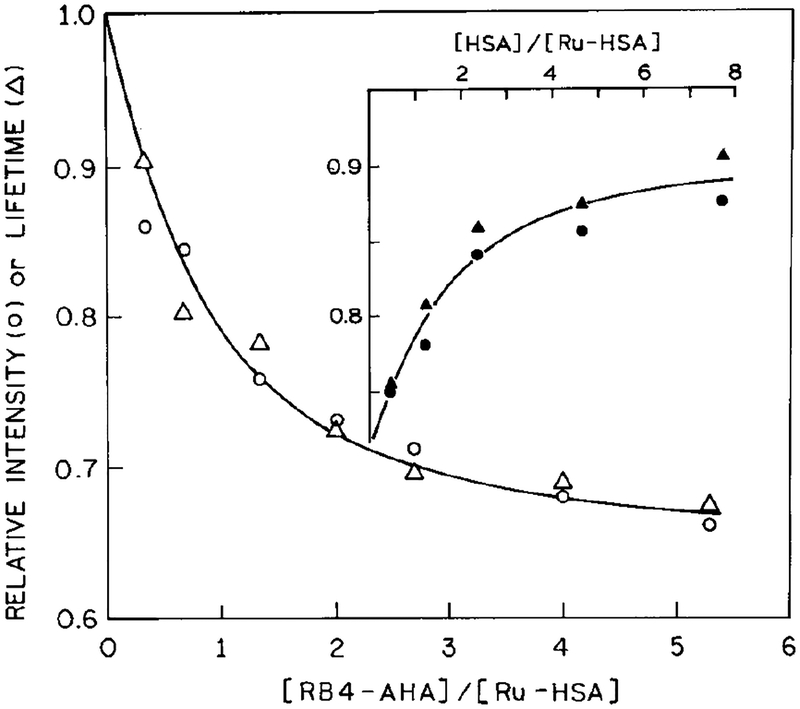
For the immunoassay (Fig. 3) we mixed Ru-labeled HSA with various amounts of RB4-AHA. The Ru-HSA concentration in all experiments was 100 nm. The samples were incubated for 40 min at 20°C prior to measurement. For the sequential competitive immunoassay (Fig. 3, inset), unlabeled HSA was mixed with RB4-AHA and incubated for 30 min at 20°C, prior to addition of Ru-HSA.
FIG. 3.
Effect of RB4-AHA binding on the relative intensities (◯) and lifetimes (Δ) of Ru-HSA. (Inset) Sequential competitive immunoassay of HSA showing the increase of fluorescence intensity (⚫) or lifetime (▲) in the presence of unlabeled HSA.
RESULTS
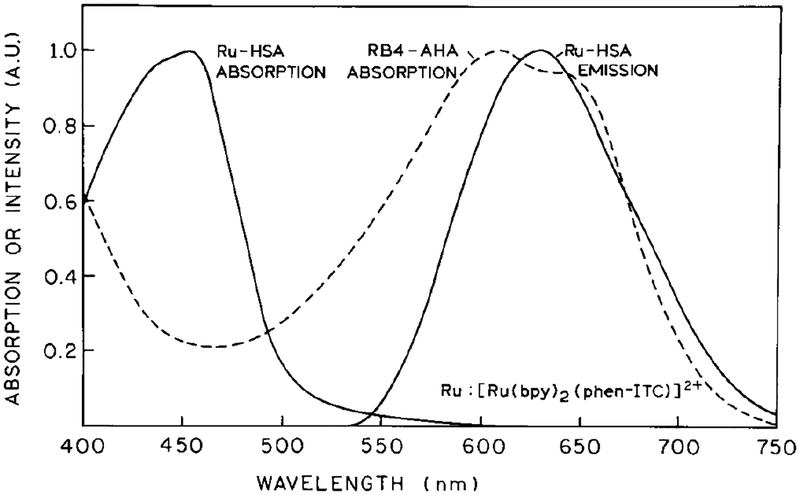
Absorption and emission spectra of the Ru-labeled HSA and the absorption spectrum of the RB4 acceptor-labeled antibody (RB4-AHA) are shown in Fig. 1. There is sufficient spectral overlap between the donor emission and long wavelength absorption of the acceptor. The Förster distance (R0) for energy transfer (15) from the Ru complex to RB4 was calculated to be 30.1 Å, using a quantum yield of 0.054 for the donor, an extinction coefficient of 5890 m−1 cm−1 at 595 nm for RB4 (28), and an orientation factor 〈κ2〉 = 0.667. The quantum yield of the donor was estimated by comparison of its integral emission with that of [Ru(bpy)3]2+ with a quantum yield of 0.042 (29).
FIG. 1.
Absorption spectra of Ru-HSA (——) and RB4-AHA (- - -) and emission spectrum of Ru-HSA.
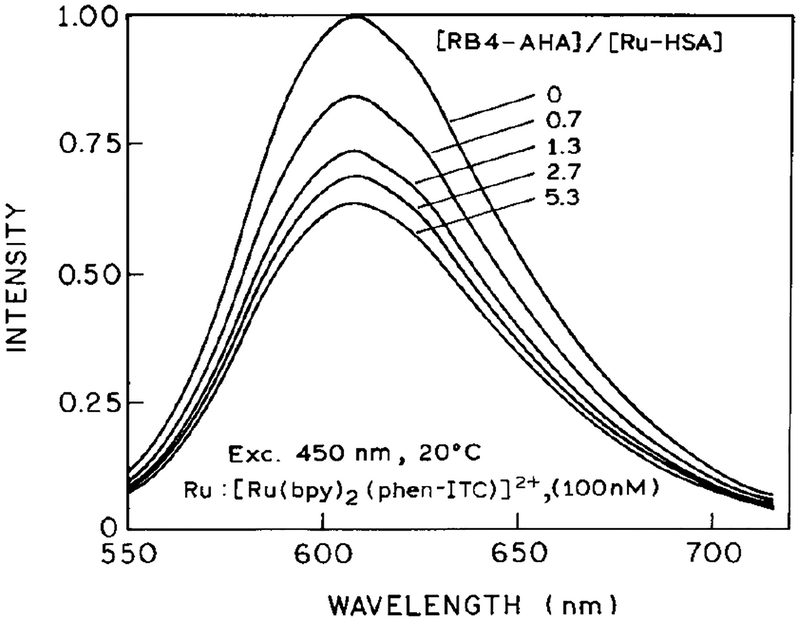
Emission spectra of Ru-HSA are shown in Fig. 2. Additions of RB4-AHA led to a progressive decrease in the steady-state intensity. This quenching effect shows evidence of saturation (Fig. 3, ◯), with a maximum of about 35% quenching at a RB4-AHA to Ru-HSA molar ratio of 5.3:1. The effect of RB4-AHA on the intensity of Ru-HSA can be reversed (⚫) by addition of unlabeled HSA (Fig. 3, inset), which suggests that the quenching effect is specific for antigenic sites on HSA. However, we did notice that a titration of Ru-HSA with free RB4 showed evidence of Ru quenching at low acceptor concentrations, which might be caused by hydrophobic interactions of the dye with HSA. Therefore, extra steps were taken to free the conjugates from any loosely attached dyes (see Materials and Methods). Even though we were able to remove free RB4 from the labeled antibody, we believe that additional effort is needed to identify a different acceptor for the Ru label, one which is not prone to hydrophobic interactions. Such interactions may be less problematic with other antigens than HSA, which is known to have high affinity for hydrophobic anions (30,31).
FIG. 2.
Emission spectra of [Ru(bpy)2(phen-ITC)]-labeled HSA in presence of 0, 0.7, 1.3, 2.7, and 5.3 molar equivalents of RB4-AHA. Excitation wavelength, 450 nm, 20°C in MOPS buffer.
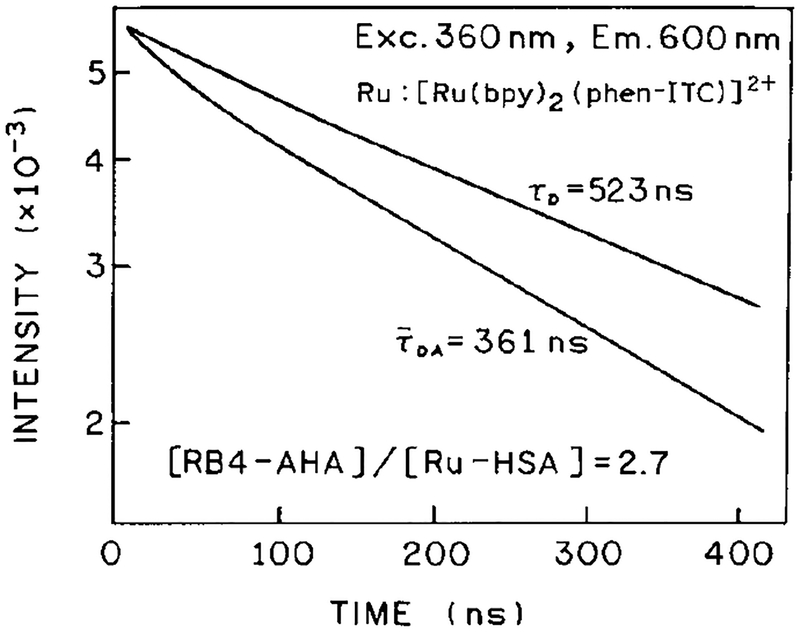
To further confirm the occurrence of FRET in the antigen-antibody mixtures we measured the Ru-HSA intensity decays (Fig. 4). Energy transfer is expected to decrease the decay time of the donor. In the absence of acceptor, the intensity decay was a double exponential with a dominant long component of 523 ns (Table 1). In the presence of acceptor we observed a third, shorter component (about 3–4 ns) which was associated with RB4-AHA complex (not shown). To minimize the influence of the fluorescence from RB4-AHA impurities, the decay times were calculated for TCSPC data 20 ns after the maximum counts. The intensity decays for Ru-HSA without (τD) and with RB4-AHA () are presented in Fig. 4. In the presence of acceptor the mean decay time decreased to 361 ns for an antibody-to-antigen ratio of 2.7:1. Close examination of Fig. 4 reveals that the intensity decay of Ru-HSA became more heterogeneous in the presence of RB4-AHA. This result is consistent with a range of donor-to-acceptor distances (16) which is expected for these randomly labeled proteins. A more detailed analysis of the intensity decays of Ru-HSA are in Table 1. An increased antibody-to-antigen ratio from 0 to 5.3 resulted in elevated value of for the one component fit as compared to the double-exponential fit. The mean lifetime (△) decreased in a manner similar to the intensity (Fig. 3, ◯), and increased in the presence of unlabeled HSA (▲). The similar changes in the intensity and decay times support our assumption that the intensity changes were due to FRET, and not due to unknown quenching mechanisms upon antigen-antibody interaction. The changes in lifetime of Ru-HSA upon association with antibody suggest that the metal-ligand complexes are suitable for lifetime-based immunoassays, which can potentially be performed in a homogeneous format in scattering or absorbing media (26).
FIG. 4.
Intensity decay of Ru-HSA in the absence (τD) and presence (τDA) RB4-AHA.
TABLE 1.
Intensity Decay Analysis of Ru-HSA Quenched by RB4-AHAa
| b | τic (ns) | αi | fi | d | |
|---|---|---|---|---|---|
| 0 | 441 | 1 | 1 | – | 1.66 |
| 21.3 | 0.107 | 0.005 | |||
| 523 | 0.893 | 0.995 | 520 | 1.56 | |
| 0.67 | 291 | 1 | 1 | – | 2.24 |
| 34.5 | 0.175 | 0.018 | |||
| 425 | 0.825 | 0.982 | 418 | 1.75 | |
| 2.0 | 273 | 1 | 1 | – | 2.60 |
| 26.5 | 0.236 | 0.021 | |||
| 385 | 0.764 | 0.979 | 378 | 1.57 | |
| 5.3 | 246 | 1 | 1 | – | 2.44 |
| 17.8 | 0.484 | 0.044 | |||
| 361 | 0.516 | 0.956 | 346 | 1.26 |
Excitation 360 nm, emission 600 nm with bandpass 10 nm, 20°C, PBS buffer pH 7.4.
Molar ratio.
Calculated from the TCSPC data 20 ns after the peak channel.
Calculated using .
The effect of donor:antigen and acceptor:antibody ratios on energy transfer has been investigated by Ullman and co-workers (7). An increased density of acceptor molecules on the antibody can significantly improve the energy transfer, while an increased density of donor molecules on the antigen can decrease the energy tansfer efficiency. Donor:antigen ratios up to 20:1 and acceptor:antibody ratios up to 15:1 have been used in energy transfer studies from fluorescein to rhodamine (7). In consideration of these early results (7) a 33% decrease of the fluorescence lifetime which we observed on addition of a 5.3 molar excess of RB4-AHA can be regarded as a reasonable result since the Förster distance for the donor-acceptor pair (Ru-RB4) is relatively short (30.1 Å). In order to increase the energy transfer efficiency, we used a polyclonal antibody since more acceptor molecules are expected to be near the donor molecules upon formation of higher antibody/antigen aggregates. It should be noted that the Ru-RB4 system is not an optimal choice for an energy transfer pair for immunoassays of high-molecular-weight antigens based on FRET. A significant improvement in Ru fluorescence quenching could be achieved using an acceptor with a higher extinction coefficient (higher Förster distance) than RB4 (5890 m−1 cm−1). Our purpose was to demonstrate the use of a MLC as a donor system in energy transfer based immunoassays, but further work is needed to optimize this method.
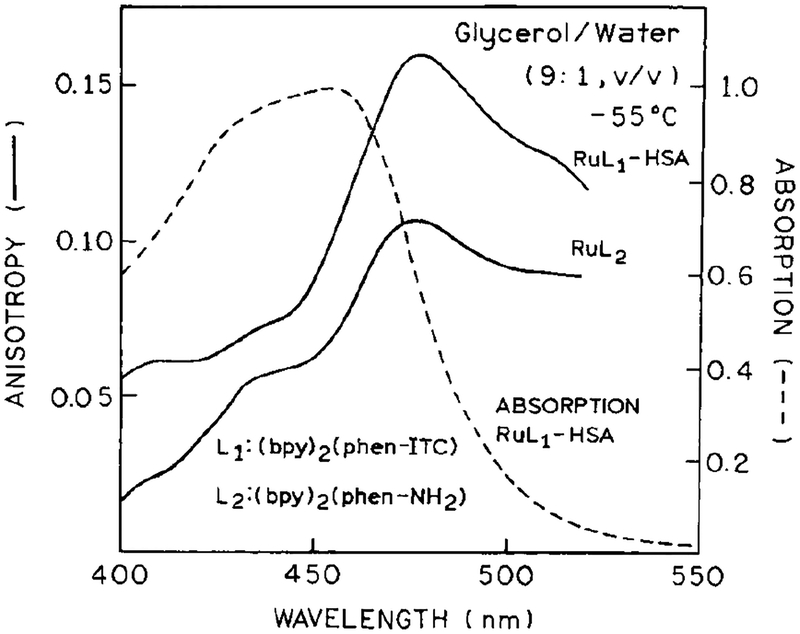
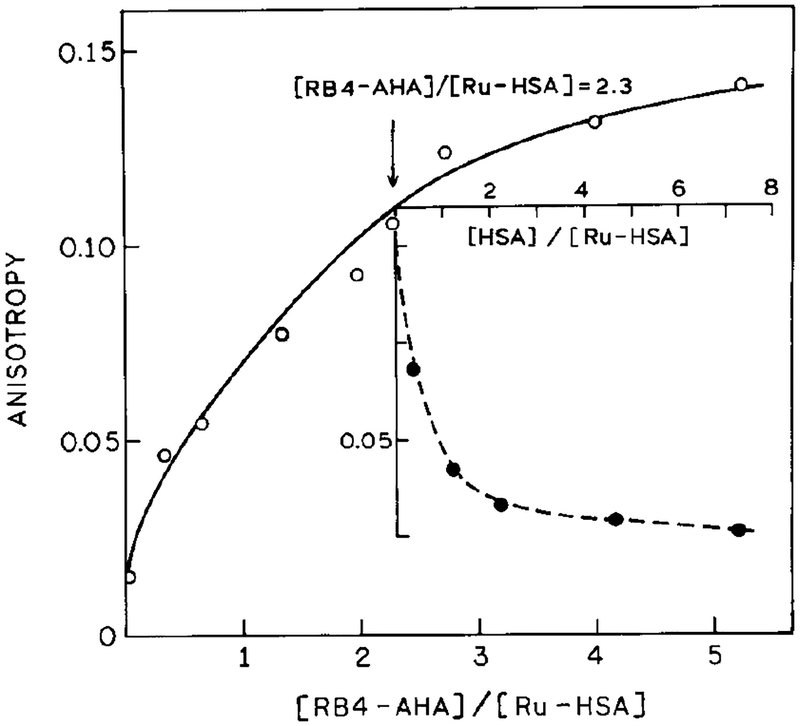
In a recent publication we reported the use of a different Ru metal-ligand complex [Ru(bpy)2(dcbpy)] for a fluorescence polarization immunoassay for the same high-molecular-weight antigen HSA (19). Hence, it was of interest to determine whether the present Ru complex [Ru(bpy)2(phen-ITC)]2+ would also be useful as a polarization probe. The excitation anisotropy spectra of this ligand in vitrified solution, and when bound to HSA, are shown in Fig. 5. The somewhat higher anisotropy when bound to HSA compared to free Ru-complex could be due to altered spectral properties upon reaction of the isothiocyanate group. The maximum anisotropy of the present probe (0.16) is less than that found for [Ru(bpy)2(dcbpy)]2+, which was 0.25 (19). However, we were pleasantly surprised by the eightfold increase in anisotropy found for titration with RB4-HSA (Fig. 6, ◯) compared with the twofold changes found for [Ru(bpy)2(dcbpy)]2+ (19). This increase in steady-state anisotropy could be almost completely reversed by competition with unlabeled HSA (⚫). One possible explanation for the large increase in anisotropy is our use of polyclonal antibodies in the present experiments compared to the monoclonal antibodies used previously (19). It is possible that the multiple specificities present in the polyclonal antibodies resulted in higher levels of association and larger complexes. Additional experimentation is required to clarify this point. Nonetheless, the present complex [Ru(bpy)2(phen-ITC)]2+ appears to be well suited for fluorescence polarization immunoassay of high-molecular-weight antigens.
FIG. 5.
Absorption (- - -) of Ru-labeled HSA and excitation anisotropy spectra (——) at [Ru(bpy)2(phen-NH2)]2+ and [Ru(bpy)2(phen-ITC)]2+ conjugated to HSA. Absorption spectrum is in aqueous buffer at 20°C, and the anisotropy spectra are in glycerol:buffer (9:1, v/v) at −055°C. The emission wavelength was 600 nm, with bandpass 8nm.
FIG. 6.
Steady-state fluorescence anisotropy of Ru-HSA at various concentrations of RB4-AHA. The excitation wavelength was 485 nm, observation 600 nm with bandpass of 10 nm at 20°C. (Inset) Effect of unlabeled HSA on the steady-state fluorescence anisotropy of Ru-HSA. The Ru-HSA was added to preincubated mixtures of RB4-AHA with increasing amounts of free HSA.
We measured the anisotropy decays for Ru-HSA in absence and presence of RB4-AHA (antibody-to-antigen ratio of 5.3:1, 360 nm excitation) and found correlation times of 54 and 274 ns, respectively (not shown). The approximate values of steady-state anisotropy can also be calculated based on Where r0 is anisotropy, observed in absence of rotational diffusion (0.16), is the mean lifetime (Table 1), and θR is the correlation time. In the absence of RB4-AHA the calculated value is 0.015 which agrees with that from steady-state measurements (0.015). While the decrease in lifetime due to FRET is expected to increase the steady-state anisotropy, the decreased lifetime is too small to account for the nearly eightfold increase in anisotropy. For instance, in the presence of a 5.3 molar excess of antibody vs antigen, the calculated value of the anisotropy based on an estimated correlation time of 274 ns and a decay time of 346 ns is 0.071, compared to 0.135 from steady-state measurements. This discrepancy can be explained by an underestimation of the correlation time. For a sample containing Ru-HSA and Ru-HSA bound to anti-HSA (AHA) one can expect two or more rotational correlation times. However, the resolution of the present time resolved data was not adequate to recover multiple correlation times. Thus the value for the correlation time (274 ns) is an average of that for Ru-HSA (about 54 ns) and the (Ru-HSA)-(RB4-AHA) aggregates. The large increase in steady-state anisotropy (Fig. 6) suggests the formation of aggregates larger than two antigens per IgG with corelation times possibly longer than 1 μs. Such long components are not well resolved in our timedomain measurements which were limited to a 400-ns time frame.
DISCUSSION
What are the advantages of using fluorescence resonance energy transfer in conjunction with metal-ligand complexes? One important advantage is a reliable means to alter the emission decay time upon antigen-antibody binding. The phenomena of FRET is a through-space interaction which can be reliably predicted based on proximity of the donor and acceptor. Given the molecular sizes of macromolecular donors and acceptors one can expect partial energy transfer from the donors. Consequently, the donors with nearby acceptors will contribute to the intensity decay, resulting in decreased mean lifetimes. It is now recognized that lifetime measurements provide a reliable basis for sensing because the decay times are mostly independent of the overall intensity of the emission. Additionally, for decay times of even nanoseconds fluorophores can be measured in highly scattering media (26, 32). In fact, decay times have been measured by the phase method through two layers of chicken skin (33), which dramatically attenuated the intensity but had no effect on the phase angle.
Additional advantages of lifetime-based sensing using metal-ligand complexes result from the long decay times. The main limitations to high sensitivity detection is the background emission or autofluorescence of the sample. The autofluorescence typically decays within several nanoseconds, and thus does not interfere with detection of the Ru complex emission at longer times. The detector may be gated on following pulsed excitation, and thereby measure the integral intensity and/or decay time of the Ru complex uncorrupted by the autofluorescence. The long decay time of the Ru complex allows decay time measurements with simple instrumentation, as is essential for biomedical applications. The instrumentation can be further simplified by the use of MLC based on Os, which absorb at longer wavelengths and can be excited with red laser diodes (34).
The combination of advantages described above suggest the possibility of homogeneous immunoassays or noninvasive transdermal sensing. Homogeneous immunoassays seems possible, even in whole blood, because selection of the metal complexes allows excitation beyond the absorptive bands of hemoglobin and tissues. Light scattering and/or absorption will prevent intensity or polarization measurements, but should not prevent lifetime measurements. Similarly, red light penetrates tissues, and could be used to excite subdermal sensing particles which contain the luminescent sensing systems. In conclusion, metal-ligand complex energy transfer immunoassays could have wide-ranging applications in chemical sensing and health care.
ACKNOWLEDGMENTS
This work was supported by grants from the National Institutes of Health, (RR-08119), with support for instrumentation from the NIH (RR-10416) and National Science Foundation (DIR-87610401). J.R.L. also expresses appreciation for support from the Medical Biotechnology Center at the University of Maryland.
Footnotes
Abbreviations used: AHA, anti-human serum albumin; Ru-HSA, HSA covalently labeled with [Ru(bpy)2(phen-ITC)]2+, bpy, 2,2′-bipyridine; dcbpy, 4,4′-dicarboxy-2,2′-bipyridine; HSA, human serum albumin; IgG, immunoglobulin G, human; MLC, metal-ligand complex; TCSPC, time-correlated single photon counting; ITC, isothiocyanate; phen, 1,10-phenanthroline; phen-NH2, 9-amino-1,10-phenanthroline; phen-ITC, 1,10-phenanthroline-9-isothiocyanate; FRET, fluorescence resonance energy transfer; RB4, Reactive Blue 4; RIAs, radioimmune assays.
REFERENCES
- 1.Berson SA, and Yalow RS (1959) J. Clin. Invest 38, 1996–2016. [DOI] [PMC free article] [PubMed] [Google Scholar]
- 2.Van Dyke K, and Van Dyke R (Eds.) (1990) Luminescence Immunoassay and Molecular Applications, CRC Press, Boca Raton, FL. [Google Scholar]
- 3.Karnes HT, O’Neal JS, and Schulman SG (1985) in Molecular Luminescence Spectroscopy: Methods and Applications, Part 1 (Schulman SG, Ed.), pp. 717–779, Wiley, New York. [Google Scholar]
- 4.Ozinskas AJ (1994) in Topics in Fluorescence Spectroscopy: Probe Design and Chemical Sensing (Lakowicz JR, Ed.), Vol. 4, pp. 449–496, Plenum, New York. [Google Scholar]
- 5.Diamandis EP (1988) Clin. Biochem 21, 139–150. [DOI] [PubMed] [Google Scholar]
- 6.Kricka LJ (1991) Clin. Chem 37(9), 1472–1481. [PubMed] [Google Scholar]
- 7.Ullman EF, Schwarzberg M, and Rubenstein KE (1976) J. Biol. Chem 251(14), 4172–4178. [PubMed] [Google Scholar]
- 8.Kronick MN, and Grossman PD (1983) Clin. Chem 29(9), 1582–1586. [PubMed] [Google Scholar]
- 9.Miller WG, and Anderson FP (1989) Anal. Chim. Acta 227,135–143. [Google Scholar]
- 10.Dandliker WB, and de Saussure VA (1970) Immunochemistry 7, 799–828. [DOI] [PubMed] [Google Scholar]
- 11.Levinson SA (1975) in Biochemical Fluorescence: Concepts (Chen RF and Edelhoch H, Eds.), Vol. 1, pp. 375–408, Dekker, New York. [Google Scholar]
- 12.Popelka SR, Miller DM, Holen JT, and Kelso DM (1981) Clin. Chem 27(7), 1198–1201. [PubMed] [Google Scholar]
- 13.Winkler M, Schumann G, Petersen D, Oellerich M, and Wonigeit K (1992) Clin. Chem 38(1), 123–126. [PubMed] [Google Scholar]
- 14.Ozinskas AO, Malak H, Joshi J, Szmacinski H, Britz J, Thompson RB, Koen PA, and Lakowicz JR (1993) Anal. Biochem. 213, 264–270. [DOI] [PubMed] [Google Scholar]
- 15.Forster Th. (1948) Ann. Phys 2, 55–75. [Translated by R. S.Knox] [Google Scholar]
- 16.Cheung HC (1991) in Topics in Fluorescence Spectroscopy: Principles (Lakowicz JR, Ed.), Vol. 2, pp. 127–176, Plenum Press, New York. [Google Scholar]
- 17.Demas JN, and DeGraff BA (1994) in Topics in Fluorescence Spectroscopy: Probe Design and Chemical Sensing (Lakowicz JR Ed.), Vol. 4, pp. 71–107, Plenum Press, New York. [Google Scholar]
- 18.Demas JN, and DeGraff BA (1992) Macromol. Chem. Macromol. Symp. 59, 35–51. [Google Scholar]
- 19.Terpetschnig E, Szmacinski H, and Lakowicz JR (1995) Anal. Biochem 227, 140–147. [DOI] [PMC free article] [PubMed] [Google Scholar]
- 20.Lovgren T, Hemmila I, Pettersson K and Halonen P (1985) Time-Resolved Fluorometry in Immunoassay, Alternative Immunoassays, Chap. 12, pp. 203–217, Wiley, New York. [Google Scholar]
- 21.Lakowicz JR, Koen PA, Szmacinski H, Gryczynski I, and Kusba J (1994) J. Fluoresc 4, 117–136. [DOI] [PubMed] [Google Scholar]
- 22.Szmacinski H, and Lakowicz JR (1994) in Topics in Fluorescence Spectroscopy: Probe Design and Chemical Sensing (Lakowicz JR, Ed.), Vol. 4, pp. 295–334, Plenum Press, New York. [Google Scholar]
- 23.Berndt KW, and Lakowicz JR (1992) Anal. Biochem 201,319–325. [DOI] [PubMed] [Google Scholar]
- 24.Terpetschnig E, Szmacinski H Malak, H., and Lakowicz, J. R. (1995). Biophys. J 68, 342–350. [DOI] [PMC free article] [PubMed] [Google Scholar]
- 25.DeGraff BA, and Demas JN (1994) J. Phys. Chem 98,12478–12480. [Google Scholar]
- 26.Szmacinski H, and Lakowicz JR (1995) Sens. Actuators B, in press [Google Scholar]
- 27.Terpetschnig E, Szmacinski H, and Lakowicz JR (1995)
- 28.Greer FJ (1990) The Sigma Aldrich Handbook of Stains, Dyes, and Indicators, p. 614. [Google Scholar]
- 29.Kalyanasundaram K, Nazeeruddin Md.K., Gratzel M, Viscardi G, Savarino P, and Barni E (1992) Inorg. Chim. Acta 198–200, 831–839. [Google Scholar]
- 30.Daniel E, and Weber G (1966) Cooperative Effects in Binding by Albumin. 5(6): 1893–1900. [DOI] [PubMed] [Google Scholar]
- 31.Anderson SR, and Weber G (1969) Biochemistry 8, 371–377. [DOI] [PubMed] [Google Scholar]
- 32.Szmacinski H, and Lakowicz JR (1995) in Advances in Fluorescence Sensing Technology, II (Lakowicz JR, Ed.), Vol. 2388, pp. 159–170, SPIE Int. Soc. Opt. Eng., Bellingham, WA. [Google Scholar]
- 33.Bambot SB, Romauld M, Sipior J, Carter GM, Terpetschnig E, Lakowicz JR, and Rao G (1995) Biosens. Bioelectr 10(6/7), 643–652. [DOI] [PMC free article] [PubMed] [Google Scholar]
- 34.Terpetschnig E, Szmacinski H, and Lakowicz JR (1995) In preparation. [Google Scholar]


