Abstract
Background
Wheat straw is a rich resource worldwide. Straw return is an effective strategy to alleviate soil-borne diseases on monoculture watermelon. Previous studies focus on soil structure, physical and chemical properties; however, little is known about the molecular responses on host plant.
Results
No significant difference on the population of Fusarium oxysporum f.sp. niveum race 1(Fon1) in rhizosphere soil was found between control (no addition of wheat straw) and the treated groups (addition of 1% (T1) or 2% (T2) wheat straw). RNA-Seq analysis showed that 3419 differentially expressed genes were clustered into 8 profiles. KEGG analysis revealed that phenylpropanoid biosynthesis and plant hormone signal transduction were involved in wheat straw induced response in monoculture watermelon. Genes in lignin biosynthesis were found to be upregulated, and the lignin and auxin contents were higher in T1 and T2 compared to the control. Lignin was also enriched and the Fon1 population decreased in watermelon roots treated with wheat straw. The enzyme activities of phenylalanine ammonia-lyase and peroxidase were increased.
Conclusions
Our data suggest that the addition of wheat straw enhances the defense response to Fon1 infection in watermelon through increasing lignin and auxin biosynthesis.
Keywords: RNA-Seq, Wheat straw, Lignin, Auxin, Fusarium wilt, Watermelon, Fusarium oxysporum f.sp. niveum
Background
The watermelon (Citrullus lanatus (Thunb.) Matsum. & Nakai var. lanatus) is a major economical crop worldwide. According the Food and Agriculture Organization of the United Nations, about 117 million tons of watermelon were harvested in 2016 (http://www.fao.org/faostat/en). In recent years, however, long-term monoculture has led to widespread of Fusarium wilt [1], which is primarily caused by Fusarium oxysporum, a soil-borne fungus that causes approximately 30–50% watermelon yield losses worldwide [2]. Fusarium wilt has previously been controlled mainly by soil fumigation [3], fungicides [4], and the use of resistant cultivars [5]. However, these control measures are not desirable and can directly increase environmental pollution. Recently, biological control, which uses natural antagonists, instead of chemicals, to reduce pest populations, has become a popular alternative for plant disease control [6, 7].
Crop straw is used extensively in modern agriculture worldwide and is also the oldest and most economical management practice to relieve monoculture problems and increase crop yields and quality. It has been widely observed that crop straw is beneficial for reducing soil-borne pathogens. Previous studies showed that root and stem rot of cucumber could be controlled by lettuce incorporation into the soil; grape residue and garlic straw were proven inhibiting Fusarium wilt and root-knot nematodes in tomato, respectively [8–10].
According to the plant-microbe interaction principles, there are two ways to suppressing soil-borne diseases: to enhance pathogen resistance of the host, or reduce the pathogen attack [11, 12]. Therefore, the analysis of the response on gene expression and physiology of the watermelon was important to perform. Different defense mechanisms have been developed in plants to protect themselves against microbial infections. Some plants have physical barriers to prevent the entry of potential pathogens [13]; and some produce plant hormones and defense-related proteins in response to infection [14]. Previous reports showed significant increases of pathogenesis-related proteins, defense enzymes and lignin synthesis in host plants during intercropping and/or companion cropping compared to monoculture [15–17]. However, little is known about the mechanism on how crop straw addition reinforces the resistance to soil-borne disease by host plants in straw-return systems.
In recent years, transcriptional and physiological conject analysis has been used broadly to fathom pathophysiologic and genes changes in response to pathogen infections. For many plants, RNA-Seq transcriptome profiling analyses were a breakthrough point for understanding mechanism of plant disease resistance. Transcriptional and physiological analyses revealed that lignin metabolism was involved in Botrytis-induced response in tomato [18]. RNA-Seq analysis elucidated the molecular mechanisms in the resistance response to Ralstonia solanacearum in tomato [19]. RNA-Seq analysis also revealed that many photosynthesis-related genes were differentially transcribed in the presence of pathogen in both chrysanthemum and mango [20, 21].
To date, little is known regarding the molecular mechanism on wheat straw induced disease resistance in host plants. In the present study, the widely cultivated watermelon cultivar Zaojia 84–24, which is sensitive to Fusarium wilt, and the wheat straw D125 were used to investigate the origination of disease resistance by RNA-Seq technology and physiological test. Our results provide important insights into the underlying molecular response of the wheat straw induced enhancement of watermelon resistance to Fusarium wilt. Our findings serve as a basis for further research on mechanism of plant disease resistance.
Results
Effects of wheat straw on the incidence, disease severity and plant growth of monoculture watermelon
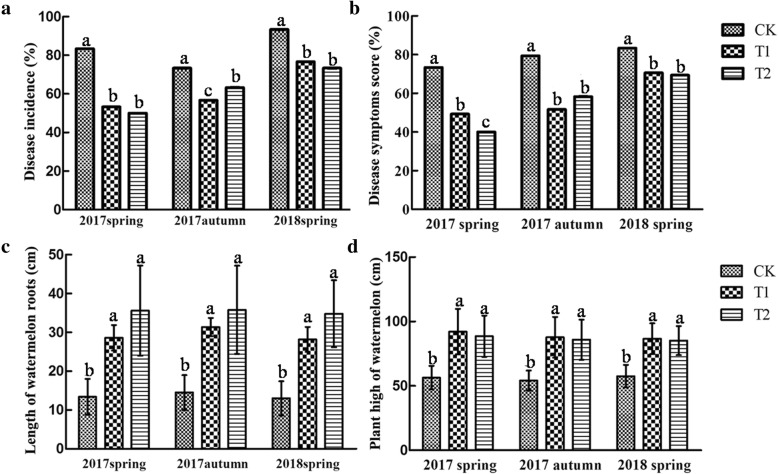
In the pot experiments, the effects of the three treatments (CK, without adding wheat straw; T1, adding 1% wheat straw; T2, adding 2% wheat straw) on the disease incidence and plant growth of monoculture watermelon were assessed. The disease incidences in T1 and T2 were all significantly lower than in CK at different time points, and that in T1 was significantly lower than in T2 and CK in the autumn of 2017 experiment. However, no significant differences occurred between T1 and T2 in the spring of 2017 and spring of 2018 (Fig. 1a). The trend of the disease index was similar to that of the disease incidence (Fig. 1b). In addition, the root length was longer and plant height was taller in T1 and T2 than that in CK at each time point, while the root length and plant height in T1 and T2 were similar (Fig. 1c, d). These results showed that wheat straw reduced the disease incidence of monoculture watermelon, and promoted watermelon growth, and it was no correlated with the amount of wheat straw addition.
Fig. 1.
Effects of wheat straw addition on the disease incidence (a), disease symptoms score (b), root length (c) and plant height (d) of monoculture watermelon at different times points. The data are the means of 20 replicates, with standard errors shown by the vertical bars. The letters above the bars (a, b, or c) represent the different groups according to Tukey’s test at the p = 0.05 level. CK, without adding wheat straw; T1, addition of 1% wheat straw; T2, addition of 2% wheat straw
Effects of wheat straw addition on Fon1 population in rhizosphere soil
DNA was collected from the watermelon rhizosphere soil of different treatments and the copy number of Fon1 was determined by real-time PCR. No significant difference was observed in Fon1 population among the three treatments (Fig. 2). Furthermore, wheat straw decomposing had no effect on Fon1 mycelia growth and spore germination (Additional file 1: Figure S1A and B, Table S1). These results indicated that wheat straw had no inhibitory effect to pathogens in monoculture watermelon soil and that the wheat straw decomposing had no effect on Fon1 growth and germination.
Fig. 2.
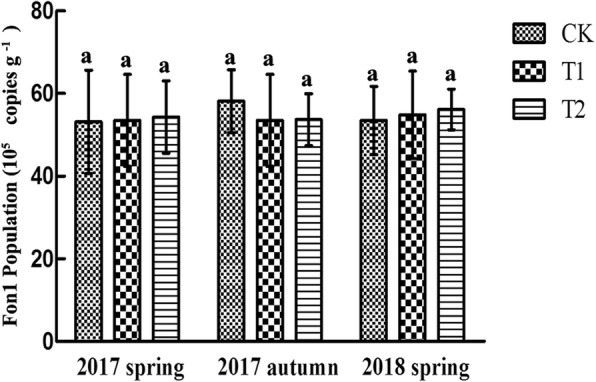
Effects of wheat straw addition on the abundance of Fusarium oxysporum f. sp. niveum in the rhizosphere of monoculture watermelon at different times points. The data are the means of three replicates, with standard errors shown by the vertical bars. The letters above the bars represent the different groups according to Tukey’s test at the p = 0.05 level. CK, without adding wheat straw; T1, addition of 1% wheat straw; T2, addition of 2% wheat straw
RNA-Seq analysis and alignment to the reference genome
As shown in Fig. 1a, the biggest difference of disease incidence between the CK group and the T1/T2 group was observed in the spring of 2017 experiment. Therefore, the watermelon roots in spring of 2017 were selected for RNA-Seq analysis.
Nine RNA-Seq libraries, including three in CK group (CK-1, CK-2 and CK-3), three in T1 group (T1–1, T1–2 and T1–3), and three in T2 group (T2–1, T2–2 and T2–3), were sequenced. After quality control and data filtering of the raw sequences, a total of 495 million clean paired-end reads (≥ 150 bp) were selected for further analysis. These clean reads were deposited in the Sequence Read Archive Database (Accession SRP158956) of the National Center for Biotechnology Information (NCBI). The reads of all samples were mapped to the high-quality watermelon reference genome (Additional file 2: Figure S2). The mapping percentage is 98.55% and a standard deviation is 1.1% (Table 1).
Table 1.
Number of clean reads that were generated from each sample and that were sequenced and mapped to the 97,103 genome
| Sample name | Total No. clean reads | Reads mapped | Percentage of mapped reads (%) |
|---|---|---|---|
| CK-1 | 56,270,632 | 56,270,632 | 98.65% |
| CK-2 | 51,565,100 | 51,565,100 | 98.65% |
| CK-3 | 47,408,908 | 47,408,908 | 98.63% |
| T1–1 | 48,991,374 | 48,991,374 | 98.61% |
| T1–2 | 58,394,970 | 58,394,970 | 98.51% |
| T1–3 | 46,693,738 | 46,693,738 | 98.57% |
| T2–1 | 62,248,678 | 62,248,678 | 98.57% |
| T2–2 | 62,655,134 | 62,655,134 | 98.33% |
| T2–3 | 60,669,156 | 60,669,156 | 98.41% |
Verification of the RNA-Seq results
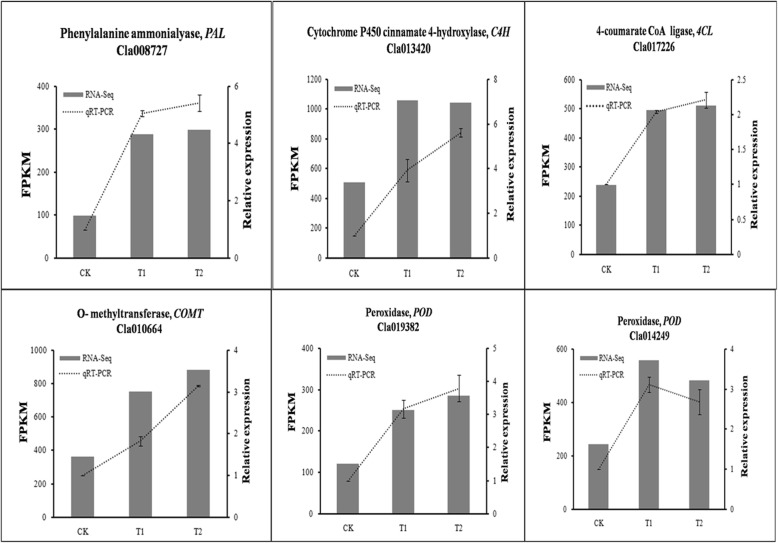
Quantitative real-time PCR (qRT-PCR) was used to verify the reliability of the transcriptome analysis, using 17 gene-specific primers, including 11 phenylpropanoid metabolite pathway genes, 1 SAUR gene and 5 other downregulated genes (Additional file 3: Table S2). Our results showed that the expression patterns of PAL (Cla008727), C4H (Cla013420), 4CL (Cla017226), COMT (Cla010664), POD (Cla016012 and Cla014249) were consistent with the sequencing results (Fig. 3). A significant strong positive correlation between the qRT-PCR and RNA-Seq data was observed (R2 = 0.9203) (Fig. 4, Additional file 4: Figure S3).
Fig. 3.
Effects of wheat straw addition on the expression levels of lignin biosynthesis in watermelon roots. Y-axis (left) indicates RNA-Seq data; Y-axis (right) indicates qRT-PCR data. Data from qRT-PCR are means of three replicates and bars represent SE. Data from RNA-seq are means of the replicates. CK, without adding wheat straw; T1, addition of 1% wheat straw; T2, addition of 2% wheat straw
Fig. 4.
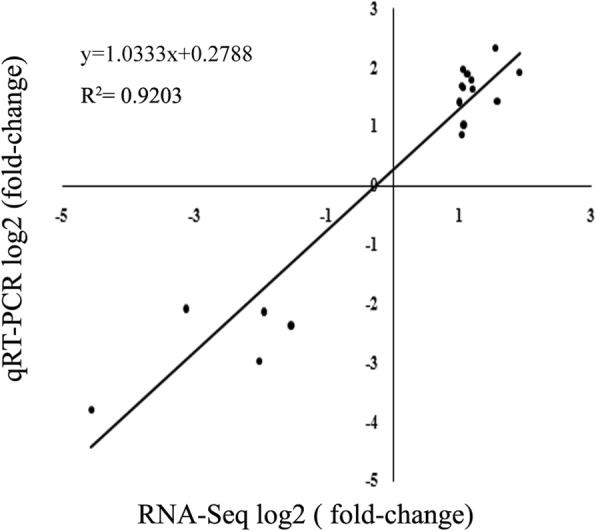
Correlation of expression levels between RNA-Seq and qRT-PCR in watermelon roots
Analysis of differentially expressed genes (DEGs) in the roots of monoculture watermelon in response to wheat straw
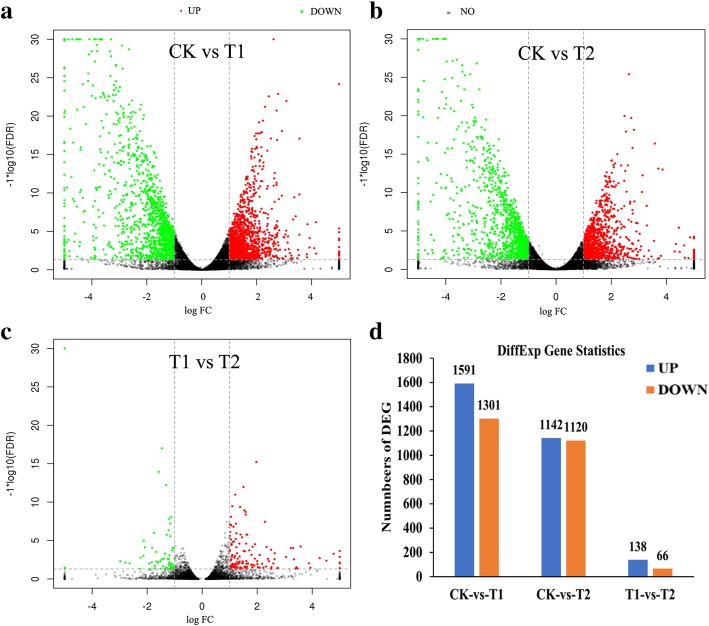
For all treatments, a stringent valve of FDR < 0.05 and absolute value of |log2FC| > 1 were used as threshold for categorizing the DEGs and identifying significant differences in gene expression between CK and T1, CK and T2, T1 and T2 (Additional file 5: Table S3). Figure 5a and d showed that there were 2892 DEGs between CK and T1, among which 1591 were upregulated and 1301 were downregulated in terms of their expression. Two thousand two hundred sixty-two DEGs between CK and T2 were identified, including 1142 upregulated and 1120 downregulated (Fig. 5b and d). Only 204 DEGs between T1 and T2 were identified, among which 138 were upregulated and 66 were downregulated (Fig. 5c and d). These results suggested the addition of 1% or 2% wheat straw has little effect on the relative gene expression patterns in the watermelon roots.
Fig. 5.
Gene expression levels in volcano plots (a, b and c) and different gene expression statistics (d). The X-axis indicates the logarithm of the difference between the two subgroups (a, b and c), and the Y-axis indicates the negative log10 value of the FDR for the two subgroups (a, b and c). The red dots represent upregulated expression, the green dots represent downregulated expression and the black dots represent no difference (a, b and c). CK, without adding wheat straw; T1, addition of 1% wheat straw; T2, addition of 2% wheat straw
GO analysis of the DEGs
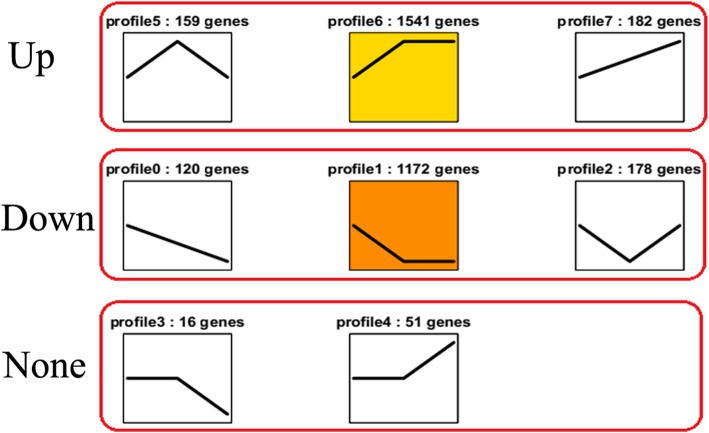
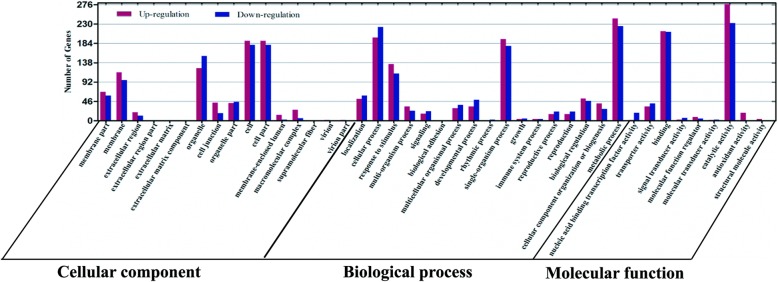
Using Short Time-Series Expression Miner (STEM), a total of 3419 DEGs were clustered into 8 profiles [22]. The eight profiles (p < 0.05) included three groups. The first group included three types of early upregulated patterns: profile 5, profile 6 and profile 7. The second group included three types of early downregulated patterns: profile 0, profile 1 and profile 2. The last group included two types of early expression genes whose patterns did not change: profile 3 and profile 4 (Fig. 6). Specifically, 2714 DEGs were clustered into two profiles, which included one downregulated pattern (profile 1) and one upregulated pattern (profile 6). Because profile 6 and profile 1 included more DEGs than the other profiles, the DEGs were significantly enriched in profile 6 and profile 1. The DEGs within profile 1 and profile 6 were further analyzed using GO term analysis. These DEGs were allocated to three core categories: cellular component, biological process, and molecular function. Of the cellular component group, cell, cell part, organelle, membrane and membrane part were the most abundant GO terms. Of the biological process group, majority of the DEGs were classified into metabolic process, cellular process, response to stimulus and single-organism process. Under the molecular function group, catalytic activity and binding were the most abundant GO terms, followed by transporter activity, nucleic acid binding transcription factor activity and antioxidant activity (Fig. 7).
Fig. 6.
DEGs expression profiles. “Up” represents upregulated expression trends (profile 5, profile 6 and profile 7), “Down” represents downregulated expression trends (profile 0, profile 1 and profile 2) and “None” represents no change in expression trends (profile 3 and profile 4). The profile number follows the number of DEGs (top)
Fig. 7.
GO functional classification of DEGs. The X- axis represents the functional items, and the Y- axis represents the number of genes
KEGG pathway analysis of DEGs
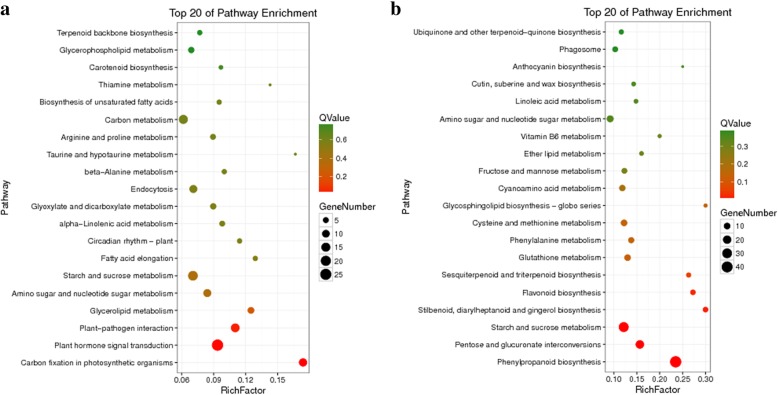
When mapped to the reference annotation pathway in KEGG, 16.99% (581/3419) of the DEGs were annotated to 108 different metabolic pathways (Additional file 6: Table S4). The top 10 highly enriched KEGG pathways were annotated and they were present in all 8 profiles (Table 2). Of these KEGG pathways, the starch and sucrose metabolism (ko00500) were the most abundant term, constituting 10.50% (61/581) of the DEGs. The other highly enriched pathways included phenylpropanoid biosynthesis (ko00940), plant hormone signal transduction (ko04075), pentose and glucuronate interconversions (ko00040), amino sugar and nucleotide sugar metabolism (ko00520), protein processing in endoplasmic reticulum (ko04141), plant-pathogen interaction (ko04626), carbon metabolism (ko00900), biosynthesis of amino acids (ko01230) and endocytosis (ko04144). For profile 6, the significantly enriched DEGs were in the first 20 pathways (Fig. 8b, Additional file 7: Table S5b). The most enriched pathway with the largest number of DEGs was phenylpropanoid biosynthesis pathway. Phenylpropanoid biosynthesis was also among the most notable enriched pathways with the lowest Q value. Similar to profile 6, the DEGs were significantly enriched in the first 20 pathways in profile 1 (Fig. 8a, Additional file 7: Table S5a). Plant hormone signal transduction pathway had both the largest number of DEGs as well as the lowest Q value. These results showed phenylpropanoid biosynthesis and plant hormone signal transduction are the key metabolic pathways in wheat straw in response to Fusarium wilt.
Table 2.
Top 10 KEGG pathways in termS of representation of DEGs
| Pathways | NO. DEGs with pathway annotation | Pathway ID | ||||||||
|---|---|---|---|---|---|---|---|---|---|---|
| All profile (% of 581) |
Profile 0 (% of 11) |
Profile 1 (% of 192) |
Profile 2 (% of 27) |
Profile 3 (% of 6) |
Profile 4 (% of 21) |
Profile 5 (% of 31) |
Profile 6 (% of 248) |
Profile 7 (% of 45) |
||
| Starch and sucrose metabolism | 61 (10.50%) | 1 (9.09%) | 18 (9.38%) | 2 (7.41%) | 1 (16.67%) | 3 (14.29%) | 2 (6.45%) | 31 (12.50%) | 3 (6.67%) | ko00500 |
| Phenylpropanoid biosynthesis | 57 (9.81%) | 3 (27.27%) | 3 (1.56%) | 1 (3.70%) | 1 (16.67%) | 0 (0.00%) | 3 (9.68%) | 43 (17.34%) | 3 (6.67%) | ko00940 |
| Plant hormone signal transduction | 48 (8.26%) | 2 (18.18%) | 26 (13.54%) | 1 (3.70%) | 0 (0.00%) | 1 (4.76%) | 2 (6.45%) | 15 (6.05%) | 1 (2.22%) | ko04075 |
| Pentose and glucuronate interconversions | 31 (5.34%) | 0 (0.00%) | 6 (3.12%) | 0 (0.00%) | 0 (0.00%) | 0 (0.00%) | 2 (6.45%) | 21 (8.47% | 2 (4.44%) | ko00040 |
| Amino sugar and nucleotide sugar metabolism | 31 (5.34%) | 1 (9.09%) | 11 (5.73%) | 3 (11.11%) | 0 (0.00%) | 2 (9.52%) | 2 (6.45%) | 12 (4.84%) | 0 (0.00%) | ko00520 |
| Protein processing in endoplasmic reticulum | 28 (4.82%) | 0 (0.00%) | 4 (2.08%) | 0 (0.00%) | 0 (0.00%) | 5 (23.81%) | 0 (0.00%) | 6 (2.42%) | 13 (28.89%) | ko04141 |
| Plant-pathogen interaction | 27 (4.65%) | 1 (9.09%) | 15 (7.81%) | 0 (0.00%) | 1 (16.67%) | 1 (4.76%) | 1 (3.23%) | 9 (3.63%) | 1 (2.22%) | ko04626 |
| Carbon metabolism | 23 (3.96%) | 0 (0.00%) | 5 (2.60%) | 2 (7.41%) | 1 (16.67%) | 0 (0.00%) | 0 (0.00%) | 16 (6.45%) | 0 (0.00%) | ko00900 |
| Biosynthesis of amino acids | 22 (3.79%) | 0 (0.00%) | 11 (5.73%) | 0 (0.00%) | 0 (0.00%) | 1 (4.76%) | 1 (3.23%) | 6 (2.42%) | 0 (0.00%) | ko01230 |
| Endocytosis | 17 (2.93%) | 0 (0.00%) | 5 (2.60%) | 0 (0.00%) | 2 (33.33%) | 1 (4.76%) | 1 (3.23%) | 10 (4.03%) | 1 (2.22%) | ko04144 |
Fig. 8.
Bubble plot of the KEGG pathway enrichment of DEGs. The top 20 of enriched pathways for profile 1 with downregulated patterns (Q value < 0.05) (a) and profile 6 with upregulated patterns (Q value < 0.05) (b). Bubble color and size correspond to the Q value and gene number enriched in the pathway. The rich factor indicates the ratio of the number of DEGs mapped to a certain pathway to the total number of genes mapped to this pathway
Wheat straw activates the phenylpropanoid metabolic pathway and enhances lignin synthesis
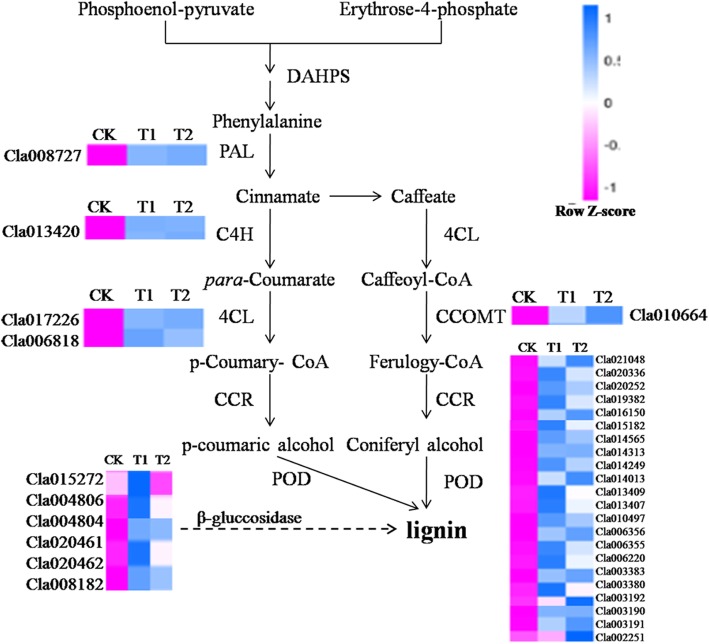
The phenylpropanoid metabolic pathway is an early indicator for plant defense. RNA-Seq analysis showed a total of 57 DEGs were associated with the phenylpropanoid biosynthesis pathway. Fourteen of those encoded phenylalanine ammonia-lyase (PAL, Cla008727), trans-cinnamate-4-monooxygenase (C4H, Cla013420), shikimate O-hydroxycinna-moyl transferase (HCT, Cla022713 and Cla009995), 4-coumarate-CoA ligase (4CL, Cla017226 and Cla006818), caffeoylshikimate esterase (CSE, Cla012691 and Cla006446), coumaroylquinate 3′-monooxygenase (C3H, Cla017432), caffeic acid 3-O-methyltransferase (COMT, Cla010664), caffeoyl-CoA-O-methyltransferase (CCoAOMT, Cla016012), ferulate-5-hydroxylase (F5H, Cla014265), and coniferyl-aldehyde dehydrogenase (REF1, Cla012342); 22 encoded peroxidase (POD) and 7 encoded beta-glucosidas, all of which were clustered into profile 6 (Table 3, Additional file 8: Figure S5A and B). Furthermore, expression of PAL, C4H, 4CL, COMT and POD was up-regulated in T1 and T2 compared with CK. These enzymes are all involved in the biosynthesis of lignin [23]. Their expression levels were peaked in T1 and maintained at high level in T2 (Fig. 9). The expression level of beta-glucosidas, which plays an important role in cellulose degradation [24] was also significantly upregulated in T1 compared with T2 and CK, and the expression was higher in T2 than CK.
Table 3.
Expression patterns of DEGs related to lignin biosynthesis
| Component | All profiles | Profile 6 | Profile1 | Description |
|---|---|---|---|---|
| Phenylpropanoid biosynthesis | 57 | 43 | 3 | |
| PAL | 1 | 1 | 0 | Phenylalanine ammonia-lyase |
| C4H | 1 | 1 | 0 | Trans-cinnamate 4-monooxygenase |
| 4CL | 2 | 2 | 0 | 4-Coumarate-CoA ligase |
| HCT | 2 | 2 | 0 | Shikimate O-hydroxycinnamoyl transferase |
| CSE | 2 | 2 | 0 | Caffeoylshikimate esterase |
| C3H | 1 | 1 | 0 | Coumaroylquinate 3′-monooxygenase |
| COMT | 1 | 1 | 0 | Caffeic acid 3-O-methyltransferase |
| CCoAMT | 1 | 1 | 0 | Caffeoyl-CoA-O-methyltransferase |
| F5H | 2 | 1 | 1 | Ferulate-5-hydroxylase |
| REF1 | 1 | 1 | 0 | Coniferyl-aldehyde dehydrogenase |
| Beta-glucosidase | 11 | 7 | 1 | Beta-glucosidase |
| Peroxidase | 30 | 22 | 1 | Peroxidase |
Fig. 9.
The partial lignin biosynthesis pathway that differentially expressed genes involved. CK, without adding wheat straw; T1, addition of 1% wheat straw; T2, addition of 2% wheat straw
The activities of PAL and POD were further measured and the results showed that PAL and POD activities were increased in T1 and T2 compared with CK, and there no difference between T1 and T2 (Fig. 10a and b). To further verify this observation, the distribution of lignin in the root tips of watermelon in each treatment was examined by light microscopy (Fig. 10c). More lignin was observed in cell walls of both cortical and vascular bundle cells of T1 (Fig. 10cII) and T2 (Fig. 10cIII) than in CK (Fig. 10cI). Quantification of lignin content further showed that the lignin content was significantly higher in T1 and T2 than in CK, while no difference between T1 and T2 (Fig. 10d). The above results showed that the wheat straw activated the phenylpropanoid metabolic pathway and induced the lignin biosynthesis.
Fig. 10.
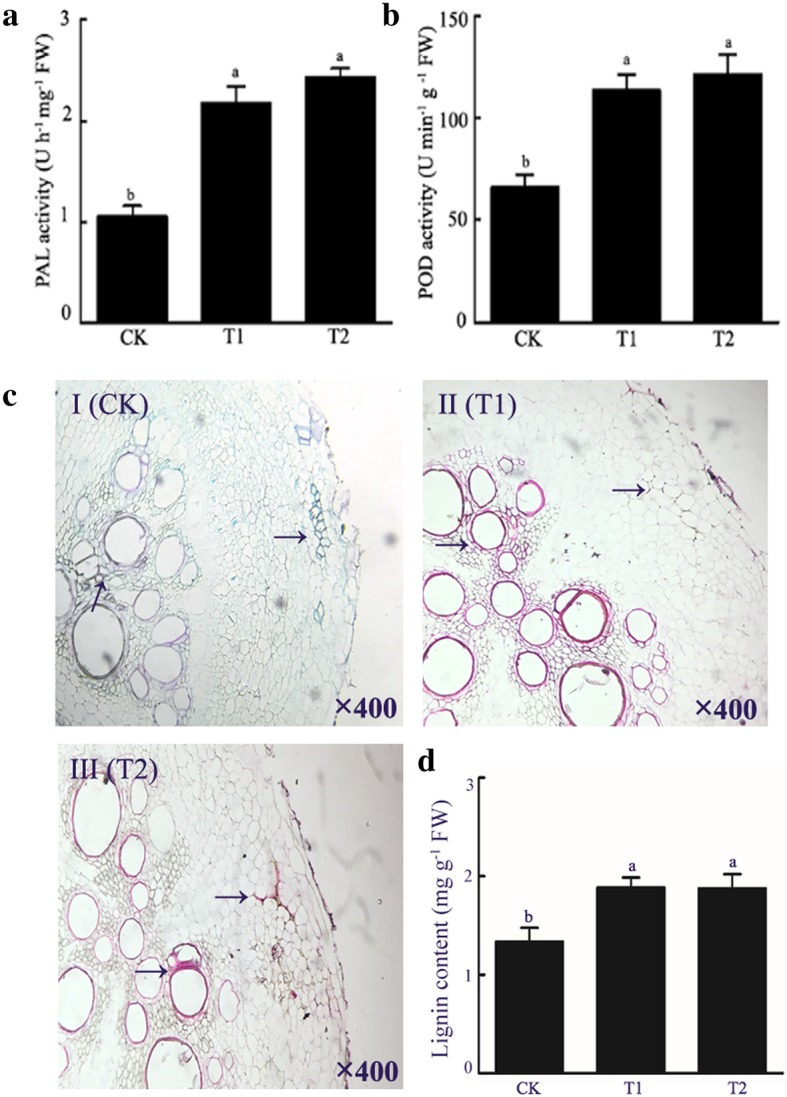
Effects of wheat straw addition on the content and distribution of lignin in watermelon roots. PAL activity (a) and POD activity (b) in watermelon roots. Cross-sections of the main roots of watermelon at flowering stage, stained with Safranin O (red) and Fast green FCF (green) (c). Arrows indicate the lignin distribution in watermelon roots. Magnification = 4400×. The lignin conent in watermelon roots (d). CK, without adding wheat straw; T1, addition of 1% wheat straw; T2, addition of 2% wheat straw
Wheat straw activates auxin biosynthesis
KEGG analysis revealed that 48 DEGs were involved in signal transduction pathways of plant hormones, including auxin, cytokinine, gibberellins, abscisic acid (ABA), ethylene (ET), brassinosteroid (BRs), jasmonic acid (JA) and salicylic acid (SA) (Table 4, Additional file 9: Figure S6).
Table 4.
List of important DEGs involved in plant hormone signal transduction
| Components | All profiles | Profile 1 | Profile 6 |
|---|---|---|---|
| Auxin | |||
| AUX1 | 1 | 0 | 1 |
| AUXIAA | 6 | 5 | 1 |
| SAUR | 6 | 0 | 4 |
| Cytokinin | |||
| B-ARR | 1 | 0 | 1 |
| A-ARR | 2 | 1 | 1 |
| Gibberellins | |||
| TF | 1 | 1 | 0 |
| DELLA | 1 | 0 | 1 |
| Abscisic acid | |||
| PYR/PYL | 5 | 1 | 4 |
| PP2C | 1 | 1 | 0 |
| ABF | 1 | 2 | 0 |
| SnRK | 2 | 0 | 1 |
| Ethylene | |||
| E-BF1/2 | 4 | 1 | 2 |
| Brassinosteroids | |||
| BSK | 2 | 1 | 1 |
| TCH4 | 1 | 1 | 0 |
| BAK1 | 1 | 0 | 1 |
| CYCD3 | 1 | 0 | 1 |
| Jasmonic acid | |||
| JAR1 | 1 | 1 | 0 |
| JAZ | 5 | 1 | 0 |
| MYCZ | 1 | 1 | 0 |
| Salicylic acid | |||
| TGA | 1 | 1 | 0 |
| PR-1 | 1 | 0 | 0 |
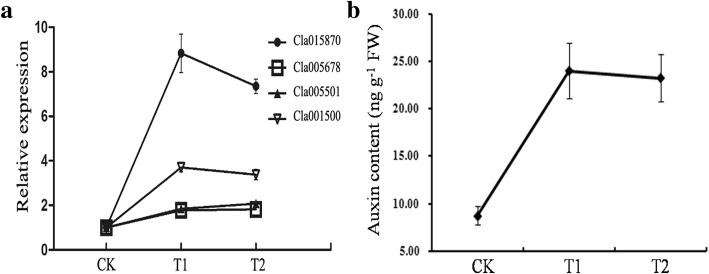
In the signal transduction pathway for auxin, 6 out of the 13 DEGs, including an auxin influx carrier (AUX1, Cla006581), an auxin responsive protein (AUXIAA, Cla007545) and four small auxin-up RNA (SAUR) family proteins (SAUR, Cla015870, Cla005678, Cla005501 and Cla001500), were clustered into profile 6 and were upregulated. Five AUXIAA (Cla021419, Cla014808, Cla012649, Cla007544 and Cla002975) were clustered to profile 1 and showed downregulated trend. In addition, the SAUR may be the largest family of early auxin-response genes and is widespread among land plant species [25]. Cla015780 expression was 8.8 and 7.8 times higher in T1 and T2 than in CK, respectively (Fig. 11a). The auxin content was also higher in T1 and T2 than in CK (Fig. 11b). Similar results were observed in the ET, ABA, cytokinine and BR signal transduction pathways. In JA transduction pathway, 3 out of the 7 DEGs showed downregulated trends (profile 1), while no DEGs showed upregulated tends (profile 6). In SA signal pathway, only 1 DEG that encode a transcription factor TGA (TGA, Cla007982) showed a downregulated trend while no DEGs showed upregulated trends. In addition, the DEGs for phytochrome-interacting factor 4 (PTF4, Cla023247) was down-regulated for DELLA protein (DELLA, Cla012302) was upregulated. In gibberelline signal pathway, no difference was observed between the upregulated and downregulated DEGs. The above results showed that wheat straw activated the auxin biosynthesis, but showed little effect on disease resistance genes of JA and SA metabolic pathways. We speculate that wheat straw dose not induce resistance of monoculture watermelon, but enhances the base defense response by promoting the growth of monoculture watermelon.
Fig. 11.
Effects of wheat straw addition on the expression levels of SAUR (a) and the content of auxin (b) in watermelon roots. CK, without adding wheat straw; T1, addition of 1% wheat straw; T2, addition of 2% wheat straw
Discussion
Physiological and biochemical studies have shown that most of the Fusarium resistant watermelon varieties have strong cell structure, such as thickened xylem to prevent entry of the pathogen [26]. Lignin is one of the essential constituents of the secondary cell wall, which forms a physical barrier that increase the resilience to pathogen infection [27–29]. In our present study, analysis of root lignin content between the treatment and control groups showed that the lignin content in roots of the T1 and T2 groups was insignificantly higher compared to the roots of control group (Fig. 10d). The results indicated that wheat straw may restrict Fon1 infection to watermelon roots. Moreover, histochemical analyses showed that the lignin distribution of watermelon root was significantly increased in treatment groups compared to the control group (Fig. 10c), further suggesting that lignin enrichment could enhance the cell wall structure and the resistance to Fon1 infection.
Secondary metabolites, such as lignin, play a crucial role in defending pathogen infection in plants. Lignin biosynthesis is a complex process that requires the participation of many enzymes [30]. PAL is one of the key enzymes and also the first rate-limiting enzyme in the phenylpropanoid pathway [31]. Kim et al. [32] reported that PAL is closely related to plant defense and is induced by pathogens. POD is a heme-containing enzyme that catalyzes many different substrates using H2O2 as an oxidant [33]. Overexpression of a tomato basic peroxidase significantly increases the lignin content [34, 35]. In our study, RNA-Seq analysis showed that several lignin biosynthesis related genes were upregulated in the treatment groups (T1 and T2). DEGs analysis revealed that the expression of genes involved in phenylpropanoid metabolic pathway was also increased in the treatment groups compared with the control group (Additional file 8: Figure S5A). These observations were confirmed by qRT-PCR analysis of PAL, POD, 4CL, C4H and CCOMT genes (Fig. 3), which are the key genes in lignin biosynthesis. Inhibition of 4CL expression or PAL or C4H expression significantly reduced the lignin content in transgenic tobacco [36, 37].
Plant hormones are important factors in regulating both plant growth and responses to various stresses. Auxin is believed to regulate or influence stress responses at the whole-plant level [38, 39], and its biosynthesis and signaling are closely linked to SAUR proteins [40]. For example, the SAUR gene Bra019369 had a higher expression in pathogen resistant plant compared to pathogen sensitive plant in canola [41]. OsSAUR45 was also involved in rice growth through affecting auxin synthesis [42]. In the current study, Cla015870, which encodes a SAUR family protein, was highly induced in T1 relative to CK (10.4 folds) and T2 relative to CK (9.8 folds) (Additional file 5: Table S3), respectively. This result suggests that the wheat straw promoted watermelon growth may be related to the upregulation of auxin synthesis genes.
JA, SA and ET play a vital role in host resistance against biotrophic pathogens [43–48]. In the current study, however, GO terms related to JA and ET biosynthesis, metabolism or signaling processes were not significantly changed and the SA biosynthesis was downregulated in T1 and T2 compared to in CK (Table 4). It is possible that wheat straw did not induce SA, JA and ET signaling pathways in response to Fon1 infection in monoculture watermelon.
To further confirm whether lignin can hinder Fon1 infesting the watermelon roots, the absolute expression of Fon1 was measured in watermelon roots. Results showed that the absolute expression of Fon1 was lower in T1 and T2 than in CK (data not shown). It is clear that the addition of wheat straw prevents the entry of Fon1 into the watermelon roots. The above results suggest that the addition of wheat straw could increase lignin and auxin biosynthesis and enhance the resistance of monoculture watermelon against Fusarium wilt. However, the mechanism of wheat straw induced increase of lignin and auxin content in host plant is unclear and deserves further investigation.
Conclusion
In conclusion, our study indicates that wheat straw could significantly enhance disease resistance against Fon1 in watermelon monoculture. Our data suggest that the addition of wheat straw triggers upregulation of the phenylpropanoid pathway-related genes, which increase the biosynthesis of lignin and auxin levels. The increased lignin and auxin enhance the cell structure, such as with thickened xylem to prevent the entry of the pathogen.
Methods
Experimental materials
The D125 wheat straw was kindly provided by the Vegetable Physiological Ecology Laboratory of the College of Horticulture and Landscape Architecture at Northeast Agricultural University, China. The wheat straw was naturally air dried and crushed to pieces with approximate lengths of 0.5–1 cm. Seeds of the watermelon (Citrullus lanatus (Thunb.) Matsum. & Nakai var. lanatus) cultivar Zaojia 84–24, were provided by the Xinjiang Academy of Agricultural Sciences, China. This watermelon cultivar is susceptible to Fusarium wilt. Monoculture watermelon soil was collected from the surface layer at the Xiangfang Farm of Northeastern Agriculture University. This farm has been used for watermelon growth for 5 years and was infected with Fusarium oxysporum f. sp. niveum race 1 (Fon1).
Pot experiments
All pot experiments were conducted in a greenhouse at Northeast Agricultural University. Watermelon seeds were soaked with sterile distilled water for 30 min at 55 °C, then rinsed three time with water. The seeds were germinated in a mixture of peat: perlite (1:1 v/v) to their four leave stage (about 30 days). The seedlings were then transferred into plastic pots (25 cm × 25 cm) with 5 kg monoculture watermelon soil containing 0 g (CK), 50 g (T1) or 100 g (T2) of wheat straw. Each pot contained one watermelon seedling. Seven days after transplanting, the seedlings of CK, T1 and T2 groups were inoculated with 20 mL spore suspension (5 × 10⁶ spores/mL) solution of Fon1 by pouring into rhizosphere of each watermelon seedling. After including 12 h, randomly selected 5 watermelon roots were collected for RNA extract.
Measurements of watermelon Fusarium wilt incidence, disease index, root length and plant height
Each treatment consisted of 20 pots that were randomly arranged. Plants were subjected to typical management and equal amounts of irrigation. The incidence of Fusarium wilt was observed and calculated at the flowering stage (20 days after transferred into posts), and the incidence was expressed as the percentage of diseased plants out of the total number of plants [49]. Subsequently, the plants were removed from the pots, after which the whole plants were submerged in water. The soil particles were removed gently to avoid damage to the roots. The roots were washed for measurement. A meter ruler was used to measure the distance from the cotyledon to the top of the watermelon. The experiments were repeated three times (Spring of 2017, Autumn of 2017 and Spring of 2018).
Measurements of Fon1 population in soil
One g mix soil for randomly 5 watermelon rhizosphere soil for each treatment were collected and the genomic DNA was extracted using the PowerSoil R DNA Isolation Kit (MO BIO, USA) according to the manufacturer’s instructions and stored in a − 20 °C freezer .
Real-time PCR (RT-PCR) was used to analyze the Fon1 population. The Fon1 primers were 5′-CGATTAGCGAAGACATTCACAAGACT-3′ and 5′-ACGGTCAAG AAGATGCAGGGTAAAGGT-3′ [50]. RT-PCR was performed using an Analytik PCR system (Analytik Jena AG, Germany). The total reaction volume was 20 μL, including 2 μL of cDNA, 0.5 μL of primer/each, 10 μL of 2 × Real SYBR Mixture (TIANGEN Biotech, China) and 7 μL of water. The PCR condition was: 94 °C for 5 min; 95 °C for 30 s, 54 °C for 30 s, 72 °C for 30 s with a total of 35 cycles. The final elongation at 72 °C for 3 min.
A target gene from Fon1 genomic DNA was used to create the plasmid standard for Fon1 quantification. The Fon1 DNA copy concentration was calculated as described previously [51]. PCR assays were conducted in triplicates.
Generating and sequencing the RNA-Seq library
Watermelon roots were collected in the of Spring of 2017 for RNA-Seq analysis. Roots from 5 watermelon seedlings were collected and pooled together as one sample. Three samples were prepared from each treatment and named as CK-1, CK-2, CK-3, T1–1, T1–2, T1–3, T2–1, T2–2 and T2–3. Samples were frozen in liquid nitrogen immediately after collected and then transferred a − 80 °C freezer.
The extracted total RNA was treated with DNase I to remove all DNA residues using an RNAprep pure Plant Kit (TIANGEN, Beijing, China) following the manufacturer’s instruction. The quality, quantity and integrity of the total RNA were evaluated. The quality was evaluated using a spectrophotometer (NanoPhotometer, Implen, CA, USA); the quantity using a Fluorometer (Qubit 2.0, Life Technologies, CA, USA), and the integrity using a Bioanalyzer 2100 system (Agilent Technologies, CA, USA). After obtaining the high quality total RNA, mRNA was enriched either via oligo (dT) beads (for eukaryotic mRNA), or via removing the rRNA (for prokaryotic mRNA). The enriched mRNA was fragmented and random primers were used to reverse transcribe the mRAN into cDNA, which was used as templates to synthesize the second-strand cDNA. After purified, the cDNA fragments were subjected to end repair and addition of the poly (A) tail. A sequencing adaptor was ligated to each fragment and the ligated fragments were separated by agarose gel electrophoresis, amplified by PCR, and sequenced using an Illumina HiSeq™ 2500 system (Gene Denovo Biotech Co., Guangzhou, China).
Transcript assembly and DEGs analysis
To obtain high quality clean reads, the raw sequencing reads were filtered and the following reads were removed from further analysis: 1.) reads containing adapters; 2.) reads containing more than 10% unknown nucleotides; and 3.) reads containing more than 50% low quality (Q-value ≤10) bases; 4.) reads containing rRNA sequences. The remaining high-quality reads were aligned against the reference transcriptome using Bowtie2 [52]. The gene abundances were calculated as reads per kb million (FPKM) [53]. The edgeR software (http://www.r-project.org/) was used to identify DEGs. Significant DEGs were identified as fold change (FC) ≥ 2 and false discovery rate (FDR) < 0.05.
Analysis of gene ontology (GO) terms and Kyoto encyclopedia of genes and genomes (KEGG) enrichment
All identified unigenes from the watermelon roots were annotated to GO terms (http://www.geneontology.org) the based on the UniProt and the Pfam databases [54]. The annotated unigenes were then mapped to a plant-specific GO slim ontology (http://www.geneontology.org/) [55]. The Pathway Tools program [56] was used to predict the biochemical pathways of the watermelon unigenes that were arranged into the PathoLogic format.
Determination of phenylalanine ammonia-lyase (PAL) and peroxidase (POD) enzymatic activities in watermelon roots
The PAL and POD activities were measured using a phenylalanine ammonia-lyase kit and a peroxidase kit (Ke Ming, Jiangsu, China), repectively, following the manufacturer’s instructions. The absorbance was measured at 290 nm for PAL and at 470 nm for POD using a microplate reader (Bio Tek Instruments, Inc., Highland Park, USA).
Determination of lignin content and distribution in watermelon roots
Samples of watermelon roots were dried at 80 °C then pulverized and passed through a 40 mesh sieve. Two mg were used to measure the lignin content using a lignin content kit (Ke Ming, Jiangsu, China) following the manufacturer’s instructions. The absorbance was measured at 280 nm using a microplate reader (Bio Tek Instruments, Inc.)
Lignin distribution in the cell walls of watermelon roots was identified using light microscopy and paraffin-embedded thin sections [57]. Briefly, the watermelon roots were washed and the root tips were removed and immersed in fixing solution for 48 h. The root tips were then gradually dehydrated with ethanol and embedded in paraffin. Sections of 8–10 μm were sliced with a microtome. Sections were gradually rehydrated, stained with Safranin O and Fast Green FCF. The stained sections were observed and imaged using a light microscope (Guangzhou minghui technology Co., Guangzhou, China).
Measurement of the SAUR gene expression and auxin content
PCR was used to measured the expression of 4 SAUR genes (Cla001500, Cla015870, Cla005501 and Cla005678. Primers for these 4 genes and the control gene (actin) are listed in (Additional file 10: Table S6). The PCR conditions are: 95 °C for 10 s; 35 cycles of 95 °C for 10 s, 56 °C for 30 s and 72 °C for 30 s. Analysis of the final melting curve was performed by raising the temperature from 55 °C to 95 °C at a rate of 0.5 °C/5 s. The 2-ΔΔCT method [58] was used to calculate the relative quantification of the Fon1 expression, which was normalized to the actin gene [59]. The experiment was repeated three times using three biological replicates.
The auxin content was measured using a liquid chromatography-mass spectrometry (AB 5500, Beijing, China) as described previously [60].
Verification of the RNA-Seq by quantitative real-time PCR (qRT-PCR)
qRT-PCR was used to validate the RNA-Seq results using a qTOWER 2.0 Real Time PCR system (Analytik Jena AG, Germany). Eleven genes that are important for lignin biosynthesis, one SAUR gene, and five randomly chosen down-regulated genes were selected. The primers were designed with Primer Premier (v 6.0) software [61] and listed in (Additional file 3: Table S2).
The total reaction volume as 20 μL, including 1 μL of cDNA template, 1 μL of each primer pair, 10 μL of SYBR Green Master mix (Toyobo, Osaka, Japan), and 8 μL of water. The PCR conditions were: 95 °C for 10 s; 35 cycles of 95 °C for 10 s, 56 °C for 30 s and 72 °C for 30 s. The experiment was repeated three times using three biological replicates.
Statistical analysis
All data were expressed as mean ± standard errors. Statistical analysis was conducted used SPSS 16.0 software (SPSS Inc., USA) and Microsoft Excel. p < 0.05 was considered statistically significant.
Supplementary information
Additional file 1. Colony diameter and number of germinated spores in response to different concentrations of decomposing wheat straw.
Additional file 2. Classification of raw reads.
Additional file 3. Primers used for qRT-PCR.
Additional file 4. Verification of RNA-Seq data.
Additional file 5. Fold-changes and P values for DEGs in the CK vs T1, CK vs T2 and T1 vs T2.
Additional file 6. KEGG pathway enrichment analysis of DEGs.
Additional file 7. KEGG pathway enrichment analysis of DEGs in profile 1 and profile 6.
Additional file 8. Heat map of the expression levels of DEGs annotated in the phenylpropanoid biosynthesis pathway and KEGG map.
Additional file 9. Heat map diagram of the expression levels of DEGs annotated in hormone signal transduction pathways by KEGG analysis
Additional file 10. PCR primers SAUR genes.
Acknowledgments
Not applicable.
Abbreviations
- 4CL
4-coumarate-CoA ligase
- ABA
Abscisic acid
- AUX1
Auxin influx carrier
- AUXIAA
Auxin responsive protein
- BRs
Brassinosteroid
- C3H
Coumaroylquinate 3’-monooxygenase
- C4H
Trans-cinnamate-4-monooxygenase
- CCoAOMT
Caffeoyl-CoA-O-methyltransferase
- CK
Without adding wheat straw
- COMT
Caffeic acid 3-O-methyltransferase
- CSE
Caffeoylshikimate esterase
- DEGs
Differentially Expressed Genes
- DELLA
DELLA protein
- ET
Ethylene
- F5H
Ferulate-5-hydroxylase
- Fon1
Fusarium oxysporum f.sp. niveum race 1
- GO
Gene Ontology
- HCT
ShikimateO-hydroxycinna-moyl transferase
- JA
Jasmonic acid
- KEGG
Kyoto Encyclopedia of Genes and Genomes
- PAL
Phenylalanine ammonia-lyase
- POD
Peroxidase
- PTF4
Phytochrome-interacting factor 4
- qRT-PCR
quantitative real-time PCR
- REF1
Coniferyl-aldehyde dehydrogenase
- RNA-Seq
Illumina RNA sequencing
- SA
Salicylic acid
- SAUR
Small auxin-up RNA
- STEM
Short Time-series Expression Miner
- T1
Addition of 1% wheat straw
- T2
Addition of 2% wheat straw
- TGA
Transcription factor TGA
Authors’ contributions
LT, SW and SN performed the sample collection, library preparation, gene annotation and qPCR analyses and participated in the bioinformatics and statistical analyses. KP, FW and WL conceived the research, interpreted the results and contributed to the preparation of the manuscript. LT and KP helped with the interpretation of the data associated with the bioinformatics pipelines, designed and performed the statistical analyses and wrote the manuscript. CF has made great contributions to grammar revision and language proofreading. All of the authors read and approved the final manuscript.
Funding
This research was supported by Establishment and Demonstration of the Technical Model of Reducing the Use of Fertilizer and Pesticide on Greenhouse Vegetables in the Cold Region of Northeast China (2016YFD0201004), a subproject of the National Key Research and Development Program of China and Economic Crops (vegetable) in the Heilongjiang Province Modern Agriculture Industry Technology Innovation system (HNWJZT201701), and Northeast Agricultural University Young Talent Project (16QC05).
Availability of data and materials
The datasets supporting the results presented in this manuscript are included within the article (and its additional files). The raw reads for the 9 libraries sequenced are available in the NCBI Sequence Read Archive database (SRP158956).
Ethics approval and consent to participate
Not applicable.
Consent for publication
Not applicable.
Competing interests
The authors declare that they have no competing interests.
Footnotes
Publisher’s Note
Springer Nature remains neutral with regard to jurisdictional claims in published maps and institutional affiliations.
Contributor Information
Lili Tang, Email: tanglili19861126@126.com.
Shaorui Nie, Email: 893607939@qq.com.
Wenhui Li, Email: liwenhuizi@163.com.
Chao Fan, Email: beyean@163.com.
Siqi Wang, Email: 840705626@qq.com.
Fengzhi Wu, Email: 544457717@qq.com.
Kai Pan, Email: mugonglin@163.com.
Supplementary information
Supplementary information accompanies this paper at 10.1186/s12870-019-2134-y.
References
- 1.Zhou XG, Everts KL. Suppression of fusarium wilt of watermelon by soil amendment with hairy vetch. Plant Dis. 2005;88(12):1357–1365. doi: 10.1094/PDIS.2004.88.12.1357. [DOI] [PubMed] [Google Scholar]
- 2.Martyn RD, Netzer D. Resistance to races 0, 1, and 2 of fusarium wilt of watermelon in citrullus sp. PI-296341-FR. HortScience. 1991;26(4):429. doi: 10.21273/HORTSCI.26.4.429. [DOI] [Google Scholar]
- 3.Meldrum RA, Daly AM, Tran-Nguyen LTT, Aitken EAB. The effect of surface sterilants on spore germination of Fusarium Oxysporum, f. sp. cubense, tropical race 4. Crop Prot. 2013;54(54):194–198. doi: 10.1016/j.cropro.2013.08.014. [DOI] [Google Scholar]
- 4.Nel B, Steinberg C, Labuschagne N, Viljoen A. Evaluation of fungicides and sterilants for potential application in the management of fusarium wilt of banana. Crop Prot. 2007;26(4):697–705. doi: 10.1016/j.cropro.2006.06.008. [DOI] [Google Scholar]
- 5.Hwang SC, Ko WH. Cavendish banana cultivars resistant to Fusarium wilt acquired through somaclonal variation in Taiwan. Plant Dis. 2004;88(6):580–588. doi: 10.1094/PDIS.2004.88.6.580. [DOI] [PubMed] [Google Scholar]
- 6.Fravel D, Olivain C, Alabouvette C. Fusarium oxysporum and its biocontrol. New Phytol. 2003;157(3):493–502. doi: 10.1046/j.1469-8137.2003.00700.x. [DOI] [PubMed] [Google Scholar]
- 7.Weller DM, Raaijmakers JM, Gardener BB, Thomashow LS. Microbial populations responsible for specific soil suppressiveness to plant pathogens. Annu Rev Phytopathol. 2002;40(1):309–348. doi: 10.1146/annurev.phyto.40.030402.110010. [DOI] [PubMed] [Google Scholar]
- 8.Pavlou GC, Vakalounakis DJ. Biological control of root and stem rot of greenhouse cucumber, caused by Fusarium Oxysporum f. sp. radicis-cucumerinum, by lettuce soil amendment. Crop Prot. 2005;24(2):135–140. doi: 10.1016/j.cropro.2004.07.003. [DOI] [Google Scholar]
- 9.Borrero C, Ordovas J, Trillas MI, Aviles M. Tomato fusarium wilt suppressiveness the relationship between the organic plant growth media and their microbial communities as characterised by biolog. Soil Biol Biochem. 2006;38(7):1631–1637. doi: 10.1016/j.soilbio.2005.11.017. [DOI] [Google Scholar]
- 10.Gong B, Bloszies S, Li X, Wei M, Yang F, Shi Q, et al. Efficacy of garlic straw application against root-knot nematodes on tomato. Sci Hortic. 2013;161(2):49–57. doi: 10.1016/j.scienta.2013.06.027. [DOI] [Google Scholar]
- 11.Ratnadass A, Fernandes P, Avelino J, Habib R. Plant species diversity for sustainable management of crop pests and diseases in agroecosystems: a review. Agron Sustain Dev. 2012;32:273–303. doi: 10.1007/s13593-011-0022-4. [DOI] [Google Scholar]
- 12.Boudreau MA. Diseases in intercropping systems. Annu Rev Phytopathol. 2013;51:499–519. doi: 10.1146/annurev-phyto-082712-102246. [DOI] [PubMed] [Google Scholar]
- 13.Eder J, Cosio EG. Elicitors of plant defense responses. Int Rev Cytol. 1994;148(08):1–36. [Google Scholar]
- 14.Shamrai SN. Plant immune system: basal immunity. Cytol Genet. 2014;48:258–271. doi: 10.3103/S0095452714040057. [DOI] [PubMed] [Google Scholar]
- 15.Gao X, Wu M, Xu RN, Wang X, Pan RQ, Kim HJ, Liao H. Root interactions in a maize/ soybean intercropping system control soybean soil-borne disease, red crown rot. PLoS One. 2014;9:e95031. doi: 10.1371/journal.pone.0095031. [DOI] [PMC free article] [PubMed] [Google Scholar]
- 16.Xu WH, Liu D, Wu FZ, Liu SW. Root exudates of wheat are involved in suppression of Fusarium wilt in watermelon in watermelon-wheat companion cropping. Eur J Plant Pathol. 2015;141:209–216. doi: 10.1007/s10658-014-0528-0. [DOI] [Google Scholar]
- 17.Fu XP, Wu X, Zhou XG, Liu SW, Shen YH, Wu FZ. Companion cropping with potato onion enhances the disease resistance of tomato against Verticillium dahliae. Front Plant Sci. 2015;6(1):726. doi: 10.3389/fpls.2015.00726. [DOI] [PMC free article] [PubMed] [Google Scholar]
- 18.Yang C, Liang Y, Qiu D, et al. Lignin metabolism involves Botrytis cinereaBcGs1-induced defense response in tomato. BMC Plant Biol. 2018;18(1):103. doi: 10.1186/s12870-018-1319-0. [DOI] [PMC free article] [PubMed] [Google Scholar]
- 19.Takeaki I, Ichiro M, Hideki T, et al. Transcriptome analysis of quantitative resistance- specific response uponRalstonia solanacearumInfection in tomato. PLoS One. 2012;7(10):e46763. doi: 10.1371/journal.pone.0046763. [DOI] [PMC free article] [PubMed] [Google Scholar]
- 20.Li H, Chen S, Song A, Wang H, Fang W, Guan Z, Jiang J, Chen F. RNA-Seq derived identification of differential transcription in the chrysanthemum leaf following inoculation with Alternariate nuissima. BMC Genomics. 2014;15:9. doi: 10.1186/1471-2164-15-9. [DOI] [PMC free article] [PubMed] [Google Scholar]
- 21.Hong K, Gong D, Zhang L, et al. Transcriptome characterization and expression profiles of the related defense genes in postharvest mango fruit against Colletotrichum gloeosporioides. Gene. 2016;576(1):275–283. doi: 10.1016/j.gene.2015.10.041. [DOI] [PubMed] [Google Scholar]
- 22.Ernst J, Bar-Joseph Z. Stem: a tool for the analysis of short time series gene expression data. BMC Bioinformatics. 2006;7(1):191. doi: 10.1186/1471-2105-7-191. [DOI] [PMC free article] [PubMed] [Google Scholar]
- 23.Rossum MWPCV, Alberda M, Plas LHWVD. Role of oxidative damage in tulip bulb scale micropropagation. Plant Sci. 1997;130(2):207–216. doi: 10.1016/S0168-9452(97)00215-X. [DOI] [Google Scholar]
- 24.Saloheimo M, Kuja-Panula J, Ylösmäki E, et al. Enzymatic properties and intracellular localization of the novel Trichoderma reesei beta-glucosidase BGLII (cel1A) Appl Environ Microbiol. 2002;68(9):4546–4553. doi: 10.1128/AEM.68.9.4546-4553.2002. [DOI] [PMC free article] [PubMed] [Google Scholar]
- 25.Stamm P, Kumar PP. Auxin and gibberellin responsive Arabidopsis small auxin up RNA36 regulates hypocotyl elongation in the light. Plant Cell Rep. 2003;32(6):759–769. doi: 10.1007/s00299-013-1406-5. [DOI] [PubMed] [Google Scholar]
- 26.Chang P, Hsu C, Lin Y, Chen K, Huang J, Liou T. Histopathology comparison and phenylalanine ammonia-lyase (PAL) gene expressions in Fusarium wilt infected watermelons. Aust J Agri Res. 2008;59:1146–1155. doi: 10.1071/AR08066. [DOI] [Google Scholar]
- 27.Vélez-Bermúdez I-C, Salazar-Henao JE, Fornalé S, López-Vidriero I, Franco-Zorrilla J-M, Grotewold E, Gray J, et al. A MYB/ZML complex regulates wound-induced lignin genes in maize. Plant Cell. 2015;27(11):3245–3259. doi: 10.1105/tpc.15.00545. [DOI] [PMC free article] [PubMed] [Google Scholar]
- 28.Bu B, Qiu D, Zeng H, et al. A fungal protein elicitor PevD1 induces Verticillium wilt resistance in cotton. Plant Cell Rep. 2014;33(3):461–470. doi: 10.1007/s00299-013-1546-7. [DOI] [PubMed] [Google Scholar]
- 29.Smit F, Dubery IA. Cell wall reinforcement in cotton hypocotyls in response to a verticillium dahliae, elicitor. Phytochemistry. 1997;44(5):811–815. doi: 10.1016/S0031-9422(96)00595-X. [DOI] [Google Scholar]
- 30.Lü G, Guo S, Zhang H, Geng L, Song F, Fei Z, et al. Transcriptional profiling of watermelon during its incompatible interaction with Fusarium oxysporum f.sp. niveum. Eur J Plant Pathol. 2011;131:585–601. doi: 10.1007/s10658-011-9833-z. [DOI] [Google Scholar]
- 31.Maud L, Venkataramaiah M, James MC, Michel R, Dominique C, Nathalie C, et al. Characterization, high-resolution mapping and differential expression of three homologouspalgenes incoffea canephorapierre (rubiaceae) Planta. 2012;236(1):313–326. doi: 10.1007/s00425-012-1613-2. [DOI] [PMC free article] [PubMed] [Google Scholar]
- 32.Kim DS, Hwang BK. An important role of the pepper phenylalanine ammonia-lyase gene (PAL1) in salicylic acid-dependent signalling of the defence response to microbial pathogens. J Exp Bot. 2014;65(9):2295. doi: 10.1093/jxb/eru109. [DOI] [PMC free article] [PubMed] [Google Scholar]
- 33.Baucher M, Monties B, Montagu MV, Boerjan W. Biosynthesis and genetic engineering of lignin. Crit Rev Plant Sci. 1998;17(2):125–197. doi: 10.1080/07352689891304203. [DOI] [Google Scholar]
- 34.Díaz J, Bernal A, Pomar F, Merino F. Induction of shikimate dehydrogenase and peroxidase in pepper (Capsicum annuum L.) seedlings in response to copper stress and its relation to lignification. Plant Sci. 2001;161(1):179–188. doi: 10.1016/S0168-9452(01)00410-1. [DOI] [Google Scholar]
- 35.El Mansouri I, Mercado JA, Santiago-Dómenech N, Pliego-Alfaro F, Valpuesta V, Quesada MA. Biochemical and phenotypical characterization of transgenic tomato plants overexpressing a basic peroxidase. Physiol Plant. 1999;106(4):355–362. doi: 10.1034/j.1399-3054.1999.106401.x. [DOI] [Google Scholar]
- 36.Kajita S, Katayama Y, Omori S. Alterations in the biosynthesis of lignin in transgenic plants with chimeric genes for 4-coumarate: coenzyme a ligase. Plant Cell Physiol. 1996;37(7):957–965. doi: 10.1093/oxfordjournals.pcp.a029045. [DOI] [PubMed] [Google Scholar]
- 37.Sewalt V, Ni W, Blount J, Jung H, Masoud S, Howles P, et al. Reduced lignin content and altered lignin composition in transgenic tobacco down-regulated in expression of l-phenylalanine ammonia-lyase or cinnamate 4-hydroxylase. Plant Physiol. 1997;115(1):41–50. doi: 10.1104/pp.115.1.41. [DOI] [PMC free article] [PubMed] [Google Scholar]
- 38.Agnew P, Koella JC, Michalakis Y. Host life history responses to parasitism. Microbes Infect. 2000;2(8):891–896. doi: 10.1016/S1286-4579(00)00389-0. [DOI] [PubMed] [Google Scholar]
- 39.Guilfoyle TJ, Hagen G. Auxin response factors. Curr Opin Plant Biol. 2001;20(3):281–291. doi: 10.1016/j.pbi.2007.08.014. [DOI] [PubMed] [Google Scholar]
- 40.Wu J, Liu SY, He YJ, Guan XY, Zhu XF, Cheng L, Wang J, Lu G. Genome-wide analysis of SAUR gene family in Solanaceae species. Gene. 2012;509(1):38–50. doi: 10.1016/j.gene.2012.08.002. [DOI] [PubMed] [Google Scholar]
- 41.Chu MG, Song T, Falk KC, Zhang XG, Liu XJ, Chang A, et al. Fine mapping of Rcr1 and analyses of its effect on transcriptome patterns during infection by Plasmodiophora brassicae. BMC Genomics. 2014;15(1):1166. doi: 10.1186/1471-2164-15-1166. [DOI] [PMC free article] [PubMed] [Google Scholar]
- 42.Xu YX, Xiao MZ, Liu Y, Fu JL, He Y, Jiang DA. The small auxin-up RNA OsSAUR45 affects auxin synthesis and transport in rice. Plant Mol Biol. 2017;94(1–2):97–107. doi: 10.1007/s11103-017-0595-7. [DOI] [PubMed] [Google Scholar]
- 43.Wasternack C. Jasmonates: an update on biosynthesis, signal transduction and action in plant stress response, growth and development. Ann Bot. 2007;100:681–697. doi: 10.1093/aob/mcm079. [DOI] [PMC free article] [PubMed] [Google Scholar]
- 44.Asselbergh B, Achuo AE, Höfte M, Van GF. Abscisic acid deficiency leads to rapid activation of tomato defence responses upon infection with Erwinia chrysanthemi. Mol Plant Pathol. 2008;9(1):11–24. doi: 10.1111/j.1364-3703.2007.00437.x. [DOI] [PMC free article] [PubMed] [Google Scholar]
- 45.Glazebrook J. Contrasting mechanisms of defence against biotrophic and necrotrophic pathogens. Annu Rev Phytopathol. 2005;43:205–227. doi: 10.1146/annurev.phyto.43.040204.135923. [DOI] [PubMed] [Google Scholar]
- 46.Lorenzo O, Solano R. Molecular players regulating the jasmonate signaling network. Curr Opin Plant Biol. 2005;8:532–540. doi: 10.1016/j.pbi.2005.07.003. [DOI] [PubMed] [Google Scholar]
- 47.Borrero C, Ordovas J, Trillas MI, Aviles M. Tomato fusarium wilt suppressiveness the relationship between the organic plant growth media and their microbial communities as characterised by biology. Soil Biol Biochem. 2006;38(7):1631–1637. doi: 10.1016/j.soilbio.2005.11.017. [DOI] [Google Scholar]
- 48.Balbi V, Devoto A. Jasmonate signalling network in Arabidopsis thaliana: crucial regulatory nodes and new physiological scenarios. New Phytol. 2008;177(2):301–318. doi: 10.1111/j.1469-8137.2007.02292.x. [DOI] [PubMed] [Google Scholar]
- 49.Guo S, Zhang J, Sun H, Salse J, Lucas WJ, Zhang H, et al. The draft genome of watermelon (Citrullus Lanatus) and resequencing of 20 diverse accessions. Nat Genet. 2013;45(1):51–U82. doi: 10.1038/ng.2470. [DOI] [PubMed] [Google Scholar]
- 50.Lin YH, Huang JW, Chang PFL, Chen KS, Chang JY, Wan YL, et al. Development of the molecular methods for rapid detection and differentiation of fusarium oxysporum and f. oxysporum f. sp. niveum in Taiwan. New Biotechnol. 2010;27(4):409–418. doi: 10.1016/j.nbt.2010.05.005. [DOI] [PubMed] [Google Scholar]
- 51.Whelan JA, Russell NB, Whelan MA. A method for the absolute quantification of cDNA using real-time PCR. J Immunol Methods. 2003;278(1):261–269. doi: 10.1016/S0022-1759(03)00223-0. [DOI] [PubMed] [Google Scholar]
- 52.Li R, Yu C, Li Y, Lam TW, Yu SM, Kristiansen K, et al. Soap2: an improved ultrafast tool for short read alignment. Bioinformatics. 2009;25(15):1966–1967. doi: 10.1093/bioinformatics/btp336. [DOI] [PubMed] [Google Scholar]
- 53.Mortazavi A, Williams BA, et al. Mapping and quantifying mammalian transcriptomes by RNA-Seq. Nat Methods. 2008;5(7):621–628. doi: 10.1038/nmeth.1226. [DOI] [PubMed] [Google Scholar]
- 54.Camon E, Magrane M, Barrell D, Lee V, Dimmer E, Maslen J, et al. The gene ontology annotation (Goa) database: sharing knowledge in uniprot with gene ontology. Nucleic Acids Res. 2004;32:D262–D266. doi: 10.1093/nar/gkh021. [DOI] [PMC free article] [PubMed] [Google Scholar]
- 55.Conesa A, Götz S. Blast2GO: a comprehensive suite for functional analysis in plant genomics. Int J Plant Genom. 2008;2008:1–12. doi: 10.1155/2008/619832. [DOI] [PMC free article] [PubMed] [Google Scholar]
- 56.Karp PD, Paley S, Romero P. The pathway tool software. Bioinformatics. 2002;18(suppl_1):S225. doi: 10.1093/bioinformatics/18.suppl_1.S225. [DOI] [PubMed] [Google Scholar]
- 57.Wang JP, Zhang JM. Manufaction of paraffin section on Chinese pulsatilla flower. J Xinyang Normal Univ. 2008;21(04):573–576. [Google Scholar]
- 58.Livak KJ, Schmittgen TD. Analysis of relative gene expression data using real-time quantitative PCR and the 2−ΔΔct, method. Methods. 2001;25(4):402–408. doi: 10.1006/meth.2001.1262. [DOI] [PubMed] [Google Scholar]
- 59.Kong Q, Yuan J, Gao L, Zhao S, Jiang W, Huang Y, et al. Identification of suitable reference genes for gene expression normalization in qRT-PCR analysis in watermelon. PLoS One. 2014;9(2):e90612. doi: 10.1371/journal.pone.0090612. [DOI] [PMC free article] [PubMed] [Google Scholar]
- 60.Pan X, Welti R, Wang X. Quantitative analysis of major plant hormones in crude plant extracts by high-performance liquid chromatography–mass spectrometry. Nat Protoc. 2010;5(6):986–992. doi: 10.1038/nprot.2010.37. [DOI] [PubMed] [Google Scholar]
- 61.Singh VK, Mangalam AK, Dwivedi S, Naik S. Primer premier: program for design of degenerate primers from a protein sequence. Biotechniques. 1998;24(2):318–319. doi: 10.2144/98242pf02. [DOI] [PubMed] [Google Scholar]
Associated Data
This section collects any data citations, data availability statements, or supplementary materials included in this article.
Supplementary Materials
Additional file 1. Colony diameter and number of germinated spores in response to different concentrations of decomposing wheat straw.
Additional file 2. Classification of raw reads.
Additional file 3. Primers used for qRT-PCR.
Additional file 4. Verification of RNA-Seq data.
Additional file 5. Fold-changes and P values for DEGs in the CK vs T1, CK vs T2 and T1 vs T2.
Additional file 6. KEGG pathway enrichment analysis of DEGs.
Additional file 7. KEGG pathway enrichment analysis of DEGs in profile 1 and profile 6.
Additional file 8. Heat map of the expression levels of DEGs annotated in the phenylpropanoid biosynthesis pathway and KEGG map.
Additional file 9. Heat map diagram of the expression levels of DEGs annotated in hormone signal transduction pathways by KEGG analysis
Additional file 10. PCR primers SAUR genes.
Data Availability Statement
The datasets supporting the results presented in this manuscript are included within the article (and its additional files). The raw reads for the 9 libraries sequenced are available in the NCBI Sequence Read Archive database (SRP158956).


