

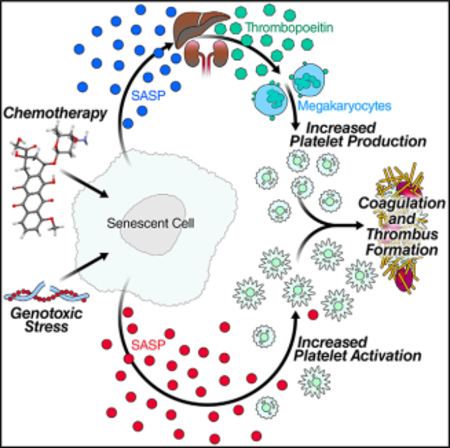
SUMMARY
Cellular senescence irreversibly arrests cell proliferation, accompanied by a multi-component senescence-associated secretory phenotype (SASP) that participates in several age-related diseases. Using stable isotope labeling with amino acids (SILACs) and cultured cells, we identify 343 SASP proteins that senescent human fibroblasts secrete at 2-fold or higher levels compared with quiescent cell counterparts. Bioinformatic analysis reveals that 44 of these proteins participate in hemostasis, a process not previously linked with cellular senescence. We validated the expression of some of these SASP factors in cultured cells and in vivo. Mice treated with the chemotherapeutic agent doxorubicin, which induces widespread cellular senescence in vivo, show increased blood clotting. Conversely, selective removal of senescent cells using transgenic p163MR mice showed that clearing senescent cells attenuates the increased clotting caused by doxorubicin. Our study provides an in-depth, unbiased analysis of the SASP and unveils a function for cellular senescence in hemostasis.
In Brief
Wiley et al. identify new proteins secreted by senescent cells using unbiased proteomics, including factors involved in hemostasis. Secretions of senescent cells increase human platelet activation, while eliminating senescent cells prevents increases in platelet counts and activation in mice treated with chemotherapy. Senescent cells may thus underlie clotting predisposition.
Graphical Abstract
INTRODUCTION
Cellular senescence permanently arrests cell proliferation in response to a variety of stresses, including DNA damage, mitochondrial dysfunction, and oncogene activation (Campisi, 2013; Wiley et al., 2016). Senescent cells participate in a wide range of biological processes (Childs et al., 2015; Muñoz-Espín and Serrano, 2014), playing beneficial or deleterious roles, depending on the triggers of senescence, as well as the tissue and cell types. Senescent cells accumulate with age and drive a variety of age-related pathologies, at least in mice (Baar et al., 2017; Baker et al., 2016; Chang et al., 2016). The senescence response can impair tissue regeneration (Chang et al., 2016; Jeon et al., 2017) and promote cancer cell proliferation and invasion (Krtolica et al., 2001; Laberge et al., 2015). In contrast, senescence suppresses tumorigenesis (Prieur and Peeper, 2008), accelerates wound healing (Demaria et al., 2014), and fine-tunes embryogenesis (Muñoz-Espín et al., 2013; Storer et al., 2013). Although the mechanisms are incompletely understood, senescent cells exert some of these effects by secreting numerous growth factors, cytokines, chemokines, and proteases, known as the senescence-associated secretory phenotype (SASP) (Acosta et al., 2013; Coppé et al., 2008; Kuilman et al., 2008).
To better understand the biological consequences of cellular senescence, we embarked on a comprehensive, unbiased method to profile the SASP using stable isotope labeling with amino acids (SILACs), a mass spectrometry-based technique that uses non-radioactive, stable isotope labeling of cells. Surprisingly, this screen revealed several SASP factors, expressed by cells induced to senesce by DNA damage, that were predicted to participate in hemostasis.
Hemostasis is a tightly regulated, complex process that prevents excessive bleeding after injury. Hemostasis has primary and secondary major components. Primary hemostasis forms a platelet plug at the injured site. Upon vascular damage, platelets adhere to the injured vessel, become activated, and aggregate to arrest bleeding (Tanaka et al., 2009; Versteeg et al., 2013). However, because the primary plug is not stable, secondary hemostasis then stabilizes the clot by depositing insoluble fibrin, which is generated by the coagulation cascade. These two processes happen simultaneously and interact in a dynamic fashion. Multiple anti-clotting mechanisms, such as circulating anticoagulants and fibrinolysis, which removes the plug after the vessel is repaired, also play critical roles in hemostasis (Tanaka et al., 2009; Versteeg et al., 2013). An impaired balance between pro- and anti-elements of coagulation can lead to pathological bleeding or, conversely, thrombosis.
An increased risk for thrombosis is a common age-associated complication and major risk factor for mortality (Sepúlveda et al., 2015). Thrombosis is also a common side effect of radio- and genotoxic chemotherapies, which significantly increase the risk for post-therapy mortality and decrease quality of life (Bosch et al., 2014; Vergati et al., 2013). Though it is known that DNA-damaging cancer therapies induce cellular senescence (Demaria et al., 2017; Ewald et al., 2010), an association between cellular senescence and thrombosis has not yet been made.
Our finding that the secretion of a subset of hemostasis-related factors increases significantly when human fibroblasts undergo senescence suggests that senescent cells may contribute to the etiology of age- and genotoxic therapy-induced thrombosis. We show that senescent cells promote blood clotting in mice treated with the genotoxic anti-cancer chemotherapeutic doxorubicin, whereas removing senescent cells from such mice attenuates clotting. Furthermore, the pro-coagulation effect of senescent cells is associated with both increased platelet number and reactivity. Our findings identify an additional function of senescent cells and provide potentially important insights into genotoxic therapy-induced thrombosis.
RESULTS
SILAC Analysis Identifies a Potential Role for the SASP in Hemostasis
To obtain an unbiased profile of the SASP, we used SILACs to analyze conditioned media (CM) from quiescent and senescent primary human foreskin (HCA2) fibroblasts. Figure 1A and Figure S1A show the timeline for 13C6 lysine and 13C6 arginine labeling of quiescent cells and the schedule for inducing senescence in unlabeled cells by ionizing radiation (IR) and CM collection. We analyzed three independent biological replicates for each condition and confirmed the senescent and quiescent states by SA-β-gal staining and BrdU labeling (Figures S1B–S1C). The proteins we identified, and the magnitude of changes in secreted levels between quiescent and senescent cells, are shown in Tables S1A–S1C. Overall, we detected 1,047 proteins, identified by at least two peptides per protein, with 99% confidence (Table S1A).
Figure 1. SILAC Analysis Suggests a Role for the SASP in Hemostasis.

(A) A schematic outlining the strategy for SILAC-based identification of SASP proteins. See Figure S1 for time lines of how cells were made quiescent or senescent and how quiescent and senescent conditioned media (CM) were produced.
(B) Reactome pathway analysis of proteins secreted at >2-fold levels by senescent compared with quiescent HCA2 cells. Pathways related to hemostasis are identified by boxes.
(C) Heatmap showing individual levels of proteins, identified by SILACs, that participate in hemostasis and are secreted by quiescent (QUI) and senescent (SEN [IR]) HCA2 normal human fibroblasts.
(D) CM were collected from quiescent (QUI) and senescent (SEN [IR]) cells, concentrated, and analyzed using western blotting for the indicated SASP factors. Cells remaining on the plate at the time of CM collection were counted for normalization. Mindin protein levels and Ponceau S staining were used as loading controls.
Fold changes are mean ± SEM. *p < 0.05 and **p < 0.01.
Among the SASP factors we identified, 343 showed a significant (>2-fold) increase in abundance in CM from senescent, compared with quiescent, cells (Table S1B). Reactome bioinformatic analyses showed that, notably, 5 of the top 25 pathways (highlighted in Figure 1B) were associated with hemostasis, blood clot formation, or clot dissolution. The SASP factors predicted to be hemostasis related by Reactome, and the magnitude of their changes, are presented as two heatmaps in Figure 1C. The left heatmap shows factors that are the most highly elevated (most yellow), and the right shows the second most highly elevated. Additional bioinformatic analyses identified the molecular functions, cellular components, and biological processes in which they are known to participate (Figures S1D–S1F). Together, the results suggest the SASP might include hemostasis-related factors.
We also observed increases in extracellular matrix (ECM) proteins in our initial dataset, which might warrant additional study (Figure 1B; Figures S1D–S1F). However, the concurrent increased secretion of proteinases may have artificially increased the abundance of peptides derived from the ECM. For this reason, we chose to focus on hemostasis.
Validation of SILACs Results in Cultured Cells
To validate the SILAC results, we collected CM from three independent cultures of quiescent or IR-induced senescent HCA2 cells and determined by western blotting the levels of 11 hemostasis-related factors identified by SILACs (Figure 1D). These factors included vinculin (VCL), tissue inhibitor of metalloproteinase 1 (TIMP1), tissue factor pathway inhibitor (TFPI), thrombospondin 1 (THBS1), calumenin (CALU), serpin E1 (SERPINE1, PAI1), serpin E2 (SERPINE2), serpin B2 (SERPINB2, PAI2), serpin B6 (SERPINB6), filamin A-alpha (FLNA), and EH domain containing 2 (EHD2). All were present at increased levels in CM from senescent, compared with quiescent, cells in all three replicates, consistent with the SILAC results. These factors play important roles in regulating hemostasis. For example, THBS1 is a major protein released from platelets during activation, where it stimulates platelet aggregation by blocking nitric oxide/cGMP signaling (Isenberg et al., 2008).
Because thrombosis is a common unwanted side effect of genotoxic cancer treatments (Ashrani et al., 2016; Huang et al., 2011; Zagar et al., 2016), we compared factors from quiescent cells and cells induced to senesce by doxorubicin (DOXO), a DNA-damaging chemotherapeutic. Elevated secretion of many SASP factors correlates with increased mRNA abundance of the respective genes (Coppé et al., 2008). Indeed, mRNAs encoding several hemostasis-related factors increased after DOXO treatment (Figure 2A). We confirmed the induction of hemostasis-related genes upon senescence in another primary human fibroblast strain, WI-38 (Figure S2A). Because blood is more likely to be exposed to senescent vascular cells, we also tested senescent human umbilical vein endothelial cells (HUVECs) for ability to produce these factors (Figure S2B). In agreement with previous work (Coppé et al., 2008), the patterns were not identical. However, the expression of several major hemostasis factors increased upon irradiation of HUVECs, similar to fibroblasts, though PLAU, PLAUR, and FLNA were each lower in senescent HUVECs. Moreover, western blots of CM from DOXO-induced senescent HCA2 cells showed increased hemostatic SASP factors relative to quiescent controls, similar to IR-induced senescence (Figure 2B). Finally, DOXO can also deplete mtDNA. We therefore tested the levels of these factors in mitochondrial dysfunction-associated senescence (MiDAS) induced by mtDNA depletion (Wiley et al., 2016). Many hemostasis-related factors were also elevated in MiDAS (Figure 2C), indicating that multiple drivers of senescence potentially affect hemostasis.
Figure 2. Doxorubicin Induces Expression of Hemostasis Factors.

(A) mRNA was extracted from HCA2 cells made quiescent (QUI) or induced to senesce by doxorubicin (SEN [DOXO]), and analyzed using qPCR for the indicated genes, using actin mRNA for normalization. The data are shown in a.u., and the bars show mean ± SEM. *p < 0.05 and **p < 0.01, two-tailed, unpaired t test.
(B) CM were collected from cells treated as in (A), concentrated and analyzed using western blotting for the indicated SASP factors. Cells were counted for normalization. Mindin protein levels and Ponceau S staining were used as loading controls.
(C) IMR-90 fibroblasts were depleted of mtDNA by culture in ethidium bromide until senescent (21 days) (labeled as MiDAS). RNA was extracted and analyzed using qPCR for the indicated factors. Heatmap represents individual values for three experiments.
*p < 0.05, one-way ANOVA.
See also Figure S2.
Senescence-Stimulated Induction of Hemostasis-Related Genes In Vivo
To determine whether the senescence-associated increased expression of hemostasis-related genes occurs in vivo, we used p16–3MR transgenic mice, which allow the detection of senescent cells by luminescence and their removal by ganciclovir (GCV) (Demaria et al., 2014). Following systemic administration of DOXO, senescent cells increased, as measured by elevated luminescence and p16INK4a mRNA levels (Figures S3A and S3B) in the liver, a key organ that generates hemostasis-related factors, and these senescent cells were efficiently eliminated by GCV (Demaria et al., 2017). Importantly, mRNA levels of the hemostasis-related genes Serpine1, Serpine2, Thbs1, Plau, Flna, and Timp1 were also elevated by DOXO and reduced by GCV (Figure 3A).
Figure 3. In Vivo Detection of the Hemostatic SASP.

Young (4–7 months old) p16–3MR mice were given PBS (control) or DOXO (10 mg/kg) by intraperitoneal (i.p.) injection. After 7 days, they were also given PBS (control) or ganciclovir (GCV; 25 mg/kg, i.p.) once per day for 5 consecutive days to clear senescent cells, as described (Demaria et al., 2014).
(A) RNA was extracted from the liver of treated mice and analyzed using qPCR for mRNA levels of the indicated genes. a.u. values were normalized to actin mRNA.
(B) Platelet-poor plasma from each treatment group was analyzed using ELISA for Thbs1 or Serpine1.
All bars show mean ± SEM. *p < 0.05, **p < 0.01, and ***p < 0.001, one-way ANOVA with Tukey’s post test. n ≥ 7 for all experiments.
See also Figure S3.
We extracted platelet-poor plasma from each treatment group and measured Thbs1 (Figure 3B, left panel), Serpine1 (Figure 3B, right panel), uPA (Figure S3C, right panel), and Timp1 (Figure S3C, left panel). Each factor increased after DOXO treatment and declined upon removal of senescent cells by GCV. Moreover, mRNAs encoding senescence (p16INK4a and Il6) (Figure S3D) and hemostasis-related factors were elevated in livers of aged mice (24–25 months old compared with 4–6 months old) (Figures S3D and S3E).
Senescent Cells Lower Tail Bleed Times
To determine whether senescent cells affect hemostasis in vivo, we analyzed tail bleeding times in DOXO- or PBS-treated p16–3MR mice receiving GCV or vehicle. DOXO-treated mice showed significantly shorter bleeding times relative to control mice. Importantly, after eliminating senescent cells, tail bleeding times were similar to those of control mice (Figure 4A). We also determined the amount of blood lost in the tail bleeding time assay by measuring hemoglobin levels (Figure 4B). Consistent with the tail bleeding time assays, DOXO-treated mice had the lowest blood loss, which was prevented by GCV. Because red blood cell counts were similar among the treatment groups (Table S2), lower hemoglobin in DOXO-treated mice was not due to anemia but rather to faster clotting.
Figure 4. Senescent Cells Reduce Tail Bleeding Time and Prime Platelet Activation.

(A–F) Young (4–7 months old) p16–3MR mice were given PBS or DOXO followed by PBS or GCV as described for Figure 3.
(A) Transected tails were submerged in 37°C saline, and time to bleeding cessation was measured. The data are expressed as mean ± SEM for 15 to 30 mice per group.
(B) Blood loss was quantified by measuring the hemoglobin (Hb) content of saline from the tail bleeding assays in a.u.
(C) Platelet counts from whole blood extracted from mice.
(D) Thrombopoietin ELISA from plasma obtained from the indicated mice.
(E and F) Whole blood was isolated from the animals, washed, stimulated with collagen, and analyzed using flow cytometry for cell surface P-selectin (E) and exposed phosphatidylserine (F). Data are expressed as the percentage of P-selectin-positive cells (E) and annexin V (which specifically binds phosphatidylserine) positive cells (F).
(G) Human platelet-rich plasma was incubated with CM from quiescent (CMQUI) or IR-induced senescent (CMSEN) cells without or with collagen (+Col) for 10 min. Released ATP was measured by luminescence over 5 min. The value for CMQUI was set arbitrarily at 1.
Bar graphs show mean ± SEM. *p < 0.05, **p < 0.01, and ***p < 0.001 by one-way ANOVA with Tukey’s post test for all experiments.
Finally, platelet counts increased in response to DOXO and returned to baseline levels when DOXO-treated mice were treated with GCV, indicating that the increased platelet counts were senescence dependent (Figure 4C). Plasma from DOXO-treated mice showed increased thrombopoietin (Tpo), which drives thrombopoiesis, and this increase was also senescence dependent (Figure 4D). Despite this observation, we found no evidence for changes in the burden of senescent cells or hemostatic factors in bone marrow derived from treated mice (Figure S4A), suggesting that the effect of senescent cells on coagulation is not driven by changes in the marrow environment. Consistent with this suggestion, we found no changes in maturation when megakaryocytes were removed from the marrow of each group and cultured separately, indicating that secreted factors, rather than megakaryocytes themselves, drove this effect (Figure S4B).
Senescent Cells Sensitize Platelets to Activation
Clotting is regulated primarily by platelet activation and the coagulation cascade (Semple et al., 2011). To determine whether senescent cells affect platelet activation in vivo, we compared platelets in the blood of DOXO- or vehicle-treated p16–3MR mice that were subsequently given GCV or vehicle. We used collagen to activate the platelets and measured P-selectin positivity (Figure 4E) and exposed phosphatidylserine (assessed by annexin V binding) (Figure 4F), markers of platelet activation, using flow cytometry. Collagen activated a greater number of platelets from DOXO-treated mice relative to controls; importantly, GCV blunted this increase in activated platelets.
To determine whether the SASP affects platelet activation, we incubated freshly isolated human platelets with CM from the quiescent or IR-induced senescent human cells (described in Figure 1) and the platelet activator collagen. We then measured platelet-released ATP, a marker of activation (Beigi et al., 1999). Platelets exposed to CM from senescent cells showed greater activation than platelets exposed to quiescent cell CM (Figure 4G), indicating that the SASP can prime platelets for activation.
Finally, we asked whether senescent cells affect the coagulation cascade. We measured activated partial thromboplastin time (APTT) and prothrombin time (PT) in each treatment group (Quality Veterinary Laboratory, Davis, CA). There were no significant differences between DOXO- and PBS-treated p16–3MR mice (Figures S4C and S4D), suggesting that senescent cells do not affect the coagulation cascade. Because many factors identified in our analysis can accelerate the coagulation cascade (e.g., serpins, uPA), it is likely that the factors that promote platelet activation (e.g., THBS1) play a more important role in the promotion of hemostasis by senescent cells. Together, the data indicate that senescent cells influence clotting time primarily by increasing platelet number and sensitizing them to activation.
DISCUSSION
The SASP can promote cancer cell proliferation and metastasis (Coppé et al., 2008; Krtolica et al., 2001; Laberge et al., 2015), reinforce senescence (Acosta et al., 2013), and optimize wound healing (Demaria et al., 2014) and embryonic development (Muñoz-Espín et al., 2013; Storer et al., 2013). Thus, investigating the complete SASP profile is critical to determine the biological functions of senescent cells. A previous study identified SASP factors from oncogene-induced senescent cells using SILACs (Acosta et al., 2013). We found 32 proteins in common between this study and ours, accounting for ~10% of the total SASP factors we identified and ~25% of the secretome identified by the previous study. The differences between these SASP profiles may be due to the differences in cells, collection time, sample handling protocol, and senescence stimuli. Recent data suggest that cellular senescence is not a singular homogeneous state but rather an evolving heterogeneous phenotype regulated with spatiotemporal specificity (Demaria et al., 2014; Hoare et al., 2016). Thus, future genomic and proteomic studies will be needed to explore different stimuli, time points, and cell types.
Our SILAC results suggest a role for the SASP in hemostasis. Indeed, senescent cells promoted blood clotting, most likely by sensitizing platelets to agonists rather than activation of the coagulation cascade. Platelet activation is associated with thrombotic disease (Gurbel et al., 2016; Ruggeri, 2002), and anti-platelet therapy has been used to prevent and treat cerebrovascular, coronary, and peripheral arterial diseases (Michelson, 2010; Steinhubl et al., 2014; Tran and Anand, 2004). Chemotherapy is a major risk factor for thrombotic disorders, including stroke (Huang et al., 2011), cardiovascular disease (Zagar et al., 2016), and venous thromboembolism (Ashrani et al., 2016). Although there is a 4.1-fold greater risk for thrombosis in cancer patients, chemotherapy increases this risk to 6.5-fold (Heit et al., 2000), with as yet no clear explanation. DOXO was previously shown to increase platelet activation in vitro, but the role of senescent cells in this process was not studied (Kim et al., 2011). Because genotoxic chemotherapies are known to induce cellular senescence (Demaria et al., 2017; Ewald et al., 2010), our findings suggest that chemotherapy-induced senescence could potentiate blood clotting, possibly by modifying platelet function. They also suggest that SASP-suppressing adjuvant therapies might reduce this side effect of chemotherapy.
The SASP is a multi-component phenotype that entails the secretion of dozens of biologically active factors (Acosta et al., 2013; Coppé et al., 2008; Kuilman et al., 2008). Our findings suggest that the SASP also regulates homeostasis-related factors, among other biological activities. However, the precise mechanisms by which senescent cells sensitize platelets for activation remain to be determined. Because senescent cells accumulate with age, it is tempting to speculate that the SASP is at least partly responsible for the thrombotic events that increase with age. These indications are potential targets for the development of senolytic drugs, which can selectively eliminate senescent cells (Chang et al., 2016), similar to the action of GCV in p16–3MR mice.
STAR★METHODS
LEAD CONTACT AND MATERIALS AVAILABILITY
Further information and requests for resources and reagents should be directed to and will be fulfilled by Pankaj Kapahi (pkapahi@buckinstitute.org). p16–3MR mice are shared for research and educational purposes under an MTA that will be discussed in good faith with the recipient.
EXPERIMENTAL MODEL AND SUBJECT DETAILS
Cell Culture
HCA2 are normal primary human neonatal foreskin fibroblasts (originally obtained from Dr. Pereira-Smith, University of Texas Health Science Center, San Antonio, TX). WI-38 and IMR-90 are normal primary human embryonic lung fibroblasts (obtained from the American Type Culture Collection). Fibroblasts were cultured in DMEM plus 10% FBS and penicillin/streptomycin, at 3% oxygen and 10% CO2. HUVECs were obtained from the American Type Culture Collection and grown in F-12K medium plus 10% FBS, penicillin/streptomycin, heparin, and endothelial cell growth supplement (BD Biosciences #354006). Senescence was induced by exposing sub-confluent cultures to 10 Gy X-irradiation (IR) or 250 nM doxorubicin (DOXO); control cultures were mock irradiated or treated with vehicle. Quiescence was induced by culture in 0.2% serum for 3 days. Quiescent cells were used 3 d after mock irradiation or vehicle treatment; senescent cells were used 7–10 d after irradiation or DOXO treatment. Media were changed every other day. On the 9th day, cells were incubated in serum-free medium and CM was collected 24 h later. For mitochondrial dysfunction-associated senescence (MiDAS), IMR-90 fibroblasts were cultured in the presence of ethidium bromide (100 ng/mL) until senescent, as described (Wiley et al., 2016).
Animal Experiments
All protocols were approved by the Buck Institution Animal Care and Use Committee. Young (4–7 months old) p16–3MR male mice were given PBS (vehicle) or DOXO (10 mg/kg) by intraperitoneal (i.p.) injection. Seven days later, they were given, also by i.p. injection, PBS (vehicle) or ganciclovir (GCV; 25 mg/kg) once per day for 5 consecutive days to clear senescent cells, as described (Demaria et al., 2014).
For tail bleeding assays, male mice (p16–3MR in C57BL/6, 3–5 months old) were anesthetized, and the tail was transected 5 mm from the tip with a razor blade. The bleeding tail was immersed in a 15 mL test tube containing saline pre-warmed to 37°C, and time to cessation of blood flow was measured. Bleeding times were determined when the bleeding stopped for 10 s. Bleeding times exceeding 6 min were noted as 6 min. The amount of bleeding was quantitated by measuring the hemoglobin content of blood collected into the saline using a Hemoglobin Assay Kit (Sigma Aldrich, St. Louis, MO), following the manufacturer’s instructions.
METHOD DETAILS
Antibodies
Antibodies against the following proteins were used (see also Key Resource Table): BD Pharmigen – P-selectin (553744); Abgent – CALU (AP12308b-ev), EHD2 (aw5422-EV), PLAU (AP8161b-ev), SERPINE2 (AP12607c-ev20); Bethyl – FLNA (A301–134A-T); Biolegend – CD41 (133905), Annex-V-APC (640920); R&D Systems – MINDIN (AF2609), SERPINB2 (MAB85501), SERPINB6 (AF4336), SERPINE1 (MAB1786), TFPI (AF2974), THBS1 (AF3074), TIMP1 (AF970), VCL (MAB6896).
KEY RESOURCES TABLE.
| REAGENT or RESOURCE | SOURCE | IDENTIFIER |
|---|---|---|
| Antibodies | ||
| p-selectin | BD-PharMingen | 553744 |
| CALU | Abgent | AP12308b-ev |
| EHD2 | Abgent | aw5422-EV |
| PLAU | Abgent | AP8161b-ev |
| SERPINE2 | Abgent | AP12607c-ev20 |
| FLNA | Bethyl | A301–134A-T |
| CD41 | Biolegend | 133905 |
| Annex-V-APC | Biolegend | 640920 |
| MINDIN | R&D Systems | AF2609 |
| SERPINB2 | R&D Systems | MAB85501 |
| SERPINB6 | R&D Systems | AF4336 |
| SERPINE1 | R&D Systems | MAB1786 |
| TFPI | R&D Systems | AF2974 |
| THBS1 | R&D Systems | AF3074 |
| TIMP1 | R&D Systems | AF970 |
| VCL | R&D Systems | MAB6896 |
| Chemicals, Peptides, and Recombinant Proteins | ||
| Acetonitrile | Burdick & Jackson | 015 |
| Formic acid | Sigma-Aldrich | F0507 |
| HPLC grade water | Burdick & Jackson | 365 |
| Dulbecco’s modified eagle medium (DMEM) | Fisher Scientific | 21–063–029 |
| F-12K medium | ATCC | 30–2004 |
| Fetal bovine serum (FBS) | Fisher Scientific | 16140 |
| Endothelial cell growth supplement | BD Biosciences | #354006 |
| Ethidium bromide | Thermo Scientific | 15585–011 |
| Doxorubicin | Sigma-Aldrich | D1515 |
| Ganciclovir | Sigma-Aldrich | G2536 |
| Penicillin/Streptomycin | Genesee Scientific | 25–512 |
| Iodoacetamide | Sigma-Aldrich | I1149 |
| Dithiothreitol (DTT) | Sigma-Aldrich | 43815 |
| Ammonium bicarbonate | Sigma-Aldrich | 09830 |
| Urea | Sigma-Aldrich | GE17–1319–01 |
| Sequencing Grade Modified Trypsin | Promega | V5111 |
| L-Arginine-HCl, 13C6, 15N4 for SILAC | Thermo Scientific | 89990 |
| L-Lysine-2HCl, 13C6 for SILAC | Thermo Scientific | 89988 |
| Amicon® Ultra-15 Centrifugal Filter Unit | EMD Millipore | UFC900308 |
| UltraPure 1M Tris-HCI, pH 8.0 | Thermo Scientific | 15568025 |
| TSKgel® Amide-80 HPLC Column | Sigma-Aldrich | 813071 |
| Acclaim PepMap 100 C18 LC Columns | Thermo Scientific | 160321 |
| Collagen | Chrono-Log | 385 |
| CountBright Absolute Counting Beads | Thermo Scientific | C36950 |
| Propidium iodide | Life Technologies | P3566 |
| L-Glutamine | Life Technologies | 25030081 |
| Recombinant Mouse Thrombopoietin Protein | R&D Systems | 488-TO |
| Ponceau S solution | Sigma Life Science | P7170 |
| Critical Commercial Assays | ||
| Senescence Detection Kit | BioVision | K320 |
| 5-Bromo-2′-deoxy-uridine Labeling and Detection Kit | Roche | #11296736001 |
| CHRONO-LUME® | Chrono-Log | 395 |
| Mouse THBS1 / Thrombospondin-1 ELISA Kit (Sandwich ELISA) | LifeSpan Biosciences | LS-F12876 |
| Mouse PAI1 ELISA Kit | Abcam | ab197752 |
| Mouse uPA ELISA Kit | Innovative Research | IMUPAKT |
| Mouse TIMP-1 Quantikine ELISA Kit | R&D Systems | MTM100 |
| Mouse Thrombopoietin Quantikine ELISA Kit | R&D Systems | MTP00 |
| ISOLATE II RNA mini kit | Bioline | BIO-52073 |
| Direct-zol RNA MiniPrep Kit | Zymo | 11–331 |
| High Capacity cDNA Reverse Transcription Kit | Applied Biosystems | 4368813 |
| Deposited Data | ||
| Raw data from this study (MSV000079131) | MassIVE | ftp://MSV000079131@massive.ucsd.edu (password:winter) |
| Experimental Models: Cell Lines | ||
| HCA2 foreskin fibroblasts | Olivia Pereira-Smith | N/A |
| Wi38 fibroblasts | ATCC | CCL-75 |
| HUVEC-C endothelial cells | ATCC | CRL-1730 |
| IMR-90 fibroblasts | ATCC | CCL-186 |
| Experimental Models: Organisms/Strains | ||
| p16–3MR mouse in C57BL/6 background | Judith Campisi | N/A |
| Oligonucleotides | ||
| RT-PCR Primers and UPL Probes | See Table S3 | N/A |
| Software and Algorithms | ||
| ProteinPilot | SCIEX Beta 4.5 | Revision 1656 |
| SwissProt | UniProt Knowledgebase | 2014_01 release |
| The Database for Annotation, Visualization and Integrated Discovery | https://david.ncifcrf.gov/ | v6.7 |
| GO enrichment analysis | http://geneontology.org | 2014 release |
| ImageJ | https://imagej.nih.gov/ | 1.52d 11 June 2018 |
SA-β-Gal and BrdU Labeling
We detected SA-β-Gal as described (Dimri et al., 1995), using a commercial kit (BioVision). Briefly, 30,000 cells per well were seeded on a 12-well plate. Cells were fixed using 500 μL Fixing Buffer for 10 min, followed by three washes in PBS, and overnight incubation at 37°C in Staining Solution. Cells were visualized and counted using an inverted microscope.
DNA synthesis was determined using a modified BrdU labeling kit (Roche #11296736001). Cells were cultured in BrdU (20 μM in DMSO) for 24 hours, fixed in 4% neutral-buffered formalin for 10 min, and washed 3 times in ice cold PBS. Permeabilization was perform for 30 min by incubation in 0.5% Triton X-100 in PBS. Nuclear DNA was digested by a combination of DNase I and exonuclease III for 1 hour, and BrdU-containing fragments were visualized by immunofluorescence.
Reagents and Standards
HPLC solvents, including acetonitrile and water, were obtained from Burdick & Jackson (Muskegon, MI). Reagents for protein chemistry, including iodoacetamide, dithiothreitol (DTT), ammonium bicarbonate, formic acid, and urea, were purchased from Sigma Aldrich (St. Louis, MO). Proteomics grade trypsin was from Promega (Madison WI). HLB Oasis SPE cartridges were purchased from Waters (Milford, MA). SILAC heavy lysine Lys-6 (13C6, 99%) and Arg-6 (13C6, 99%) were obtained from Thermo Scientific (Waltham, MA).
SILAC Sample Preparations
Non-senescent cells were grown in heavy SILAC medium, and senescent (irradiated) cells were incubated in light SILAC medium, both with 3 biological replicates (for details see Figure S1A). Quiescent HCA2 cells were cultured in DMEM medium supplied with L-Lys-13C6 and L-Arg-13C6 (heavy medium) for 6 passages to achieve complete label incorporation (~99%) before seeding (Day 0), according to the vendor’s recommendation. At least 5 passages prior to the experiment, incorporation efficiency of the heavy labeled amino acids into proteins was assessed in a pilot experiment, where a small aliquot of intracellular protein was lysed, reduced, alkylated, and trypsin digested and subjected to MS analysis as described below. Heavy label incorporation into proteins from non-senescent cells was assessed as >99%. Senescent (irradiated) HCA2 cells were cultured in DMEM complete medium (light medium) (for details see Figure S1A).
For the proteomics, 24 h before harvesting, plated cells were washed 3 times with fresh fetal calf serum (FCS)-free medium for 10 min at 37°C each. The cells were then incubated in FCS-free medium (12 mL per flask) for 24 h at 37°C. At the end of the culture period, cells showed no evidence of apoptosis. CM was collected as described above, and centrifuged at 1,200 g for 5 min. The supernatant was transferred to fresh tubes. CM from quiescent and senescent cells were mixed based on equal cell numbers, and concentrated (~1:100 fold) using Millipore centrifugal filter units (MWCO 3.5 kDa). Samples were prepared for mass spectrometric analysis including removal of phenol red dye by buffer exchange with 50 mM TrisCl (pH8.0) (5 washing steps using spin columns at × 5000 g). CM were denatured with 6 M urea, reduced with 20 mM DTT (30 min at 37°C), alkylated with 50 mM iodoacetamide (30 min at RT), and digested overnight at 37°C with 1:50 enzyme:substrate ratio (wt/wt) of sequencing grade trypsin (Promega, Madison, WI) as described (Keshishian et al., 2007). Following digestion, samples were acidified with formic acid and desalted using HLB Oasis SPE cartridges (Waters, Milford, MA). Protein/peptide recovery was not specifically assessed; however the above sample preparation and digestion protocol was thoroughly assessed for reproducibility during previous optimization and reproducibility studies.
Hydrophilic Interaction Liquid Chromatography (HILIC) peptide fractionation was performed on a Waters 1525 HPLC system equipped with a 4.6 × 25 mm TSK gel Amide-80 HR 5 μm column (Tosoh Bioscience, South San Francisco, CA). CM (~900 μg of protein) were loaded in 80% solvent B (98% acetonitrile, 0.1% TFA) and eluted with the following gradient: 80% B for 5 min followed by 80% B to 60% B in 40 min, 0% B in 5 min at 0.5 ml/min. Solvent A consisted of 98% HPLC grade water and 0.1% TFA collecting nine fractions.
Mass Spectrometry
Samples were analyzed by reverse-phase HPLC-ESI-MS/MS using an Eksigent Ultra Plus nano-LC 2D HPLC system (Dublin, CA) connected to a quadrupole time-of-flight TripleTOF 5600 (QqTOF) mass spectrometer (SCIEX). Typically, mass resolution for MS1 scans and corresponding precursor ions was ~35,000 (TripleTOF 5600), while resolution for MS/MS scans and resulting fragment ions (MRM-HR transitions) was ~15,000 (‘high sensitivity’ product ion scan mode) (Schilling et al., 2012). Briefly, after injection, peptide mixtures were transferred onto the analytical C18-nanocapillary HPLC column (C18 Acclaim PepMap100, 75 μm I.D. × 15 cm, 3 μm particle size, 100 Å pore size, Dionex, Sunnyvale, CA) and eluted at a flow rate of 300 nL/min using stepwise gradients from 5% to 80% solvent B with total runtimes, including mobile phase equilibration, of 90 min. Solvent mobile phase A was 2% acetonitrile/ 98% of 0.1% formic acid (v/v) in water, and mobile phase B was 98% acetonitrile/2% of 0.1% formic acid (v/v) in water. Data acquisition was performed in data dependent acquisition (DDA) mode on the TripleTOF 5600 to obtain MS/MS spectra for the 30 most abundant precursor ions (50 msec per MS/MS) following each survey MS1 scan (250 msec), yielding a total cycle time of 1.8 s as described (Kuhn et al., 2014; Schilling et al., 2012).
Bioinformatic Database Searches and SILAC Quantification
MS data were searched using the database search engine ProteinPilot (5) (SCIEX Beta 4.5, revision 1656) with the Paragon algorithm (4.5.0.0, 1654). The search parameters were set as follows: trypsin digestion, cysteine alkylation set to iodoacetamide, SILAC Quantification (Lys-6, Arg-6, no bias correction), and Homo sapiens as species. Trypsin specificity was assumed as C-terminal cleavage at lysine and arginine. Processing parameters were set to “Biological modification” and a thorough ID search effort was used. During the search, Protein Pilot performs an automatic mass recalibration of the datasets based on highly confident peptide spectra. Specifically, a first search iteration was done to select high confidence peptide identifications to recalibrate both the MS and MS/MS data, which is subsequently automatically re-searched. During the iterative steps of re-searching the data, the search parameters are less stringent, e.g., allowing for additional ‘missed cleavages’ (with typically not more than 2).
All data files were searched using the SwissProt 2014_01 release, released January 22, 2014), with a total of 40,464 human ‘reviewed’ protein sequences searched. A cut-off peptide confidence value of 99 was chosen, and a minimum of 2 identified peptides per protein was required. The Protein Pilot false discovery rate (FDR) analysis tool, the Proteomics System Performance Evaluation Pipeline (PSPEP algorithm) provided a global FDR of 1% and a local FDR at 1% in all cases. For protein quantification comparing proteins from 3 biological replicate experiments between CM from senescent (light) versus quiescent (heavy) cells a Protein Pilot significance threshold of < 0.05 was required. All database search results and details for peptide identifications and protein quantification are provided in Table S1.
Functional Analysis, Protein Ontology, Pathway Enrichment Analysis
For functional analysis and protein ontology analysis, ‘The Database for Annotation, Visualization and Integrated Discovery’ (DAVID v.6.7) was used (Huang et al., 2007). For pathway enrichment analysis, we used the Benjamini correction as adjustment to P values to determine statistical significance (Figures S1D–S1F).
Western Blotting
CM were collected and stored at −80°C, and cells remaining on the culture dish were counted for normalization. Protein concentrations were measured using Bradford reagents. Samples were incubated at 95°C for 10 min, loaded on 4%–15% gradient tris-glycine SDS-polyacrylamide gels (Invitrogen), separated by electrophoresis and transferred to PVDF membranes. Membranes were blocked in TBST/BSA for 1 h at room temperature, probed overnight at 4°C with primary antibodies in blocking buffer, washed in TBST and incubated with horseradish peroxidase-conjugated secondary antibodies for 1 h at room temperature. Signals were detected using Supersignal® West chemiluminescent substrate (Thermo Scientific). Densitometry was performed using ImageJ by the measurement of area under the curve method following background subtraction.
Platelet Activation Assay
Platelet-associated adenosine triphosphate (ATP) secretion was measured using the CHRONO-LUME reagent (Chrono-Log, Havertown, PA), according to the manufacturer’s protocol with minor variations. Human platelet-rich plasma was incubated in CM from quiescent or IR-induced senescent HCA2 fibroblasts in the presence or absence of 5 μg/mL collagen for 10 min prior to analysis. ATP was measured by adding CHRONO-LUME luciferin to platelet-rich plasma at a ratio of 1:9, after which luminescence was measured on a Perkin Elmer Victor X3 multilabel plate reader.
Isolation of Bone Marrow from Mouse Femurs
Femurs were isolated from both legs of each mouse and cut at top and bottom to uncover the bone marrow. The bones were flushed with cold PBS using a 25-gauge needle to collect the bone marrow into 1.6 mL Eppendorf tubes. Collected samples were centrifuged at 300 × g for 5 minutes at 4°C. After centrifugation, the supernatant was removed, and the remaining pellet lysed in 1mL TRIzol® reagent for total RNA isolation. RNA isolation was performed according to the manufacturer’s instructions (Direct-zol RNA Miniprep Zymo Research cat# R2051).
Megakaryocyte Preparation
Megakaryocytes (MKs) were obtained and analyzed according to published protocols (Mathur et al., 2004; Schulze, 2012) with minor modifications. C57BL6 mice receiving different treatments were euthanized 8 days after treatment, and bone marrow cells were obtained from femurs and tibias by flushing. Single-cell suspensions were prepared by passage through 25-gauge needles, and collected by 5 min centrifugation at 200 × g. Cells were cultured in DMEM supplemented with 10% fetal bovine serum, 2 mM L-glutamine, penicillin/streptomycin, and 100 ng/ml murine thrombopoietin for 10 days. MK ploidy was measured by double staining with FITC conjugated anti-CD61 antibody and propidium iodide followed by flow cytometry on a BD FACSAria II flow cytometer (Becton Dickinson). CD 61+ cells (regarded as MKs) were gated and analyzed for DNA content.
ELISAs
Platelet poor plasma from each treatment group was analyzed by ELISA according to the manufacturer’s instructions. Thbs1 was from LifeSpan Biosciences, SerpinE1 (PAI-1) was from Abcam, uPA was from Innovative Research, and Timp1 was from R&D Systems. Plasma samples were diluted with Assay Buffers before analysis (Thbs1 = 1:5 dilution, PAI-1 = 1:5 dilution, uPA = 1:2 dilution, Timp1 = 1:2 dilution). Thrombopoeitin (Tpo) was measured by ELISA (R&D Systems) on undiluted EDTA-treated plasma according to the manufacturer’s instructions.
Quantitative PCR
RNA was extracted from cells using the ISOLATE II RNA mini kit (Bioline #BIO-52073), following the manufacturer’s instructions. RNA was isolated from tissues via the Direct-zol RNA MiniPrep Kit (Zymo #11–331) according to the manufacturer’s instructions. RNA (500 ng) was reverse-transcribed using the High Capacity cDNA Reverse Transcription Kit (Applied Biosystems #4368813). For each qPCR reaction, 10 ng of cDNA was used and quantified on a LightCycler 480 II (Roche) for 45 cycles. All signals were normalized to beta-actin.
FACS Analysis
Blood was collected from control and treated mice in TBS/Heparin (20U/ml), diluted in Tyrode’s buffer, and centrifuged at 900 x g for 5 min. The pellet was resuspended in Tyrode’s buffer for further analysis. For measurement of platelet surface exposure of P-selectin or phosphatidylserine, we followed published protocols with minor modifications (Dachary-Prigent et al., 1993; Nieswandt et al., 2004). Briefly, washed blood was diluted 1:25 with Tyrode’s buffer containing 1mM Cacl2, left unstimulated or activated with 5 ug/ml type I collagen (Chrono-log) in the presence of a FITC-conjugated mouse anti-CD62P IgG (BD Biosciences) monoclonal antibody, Annex-V-APC (Biolegend, San Diego, CA). Within 30 min, samples were measured by flow cytometry on a FACS Aria II (BD Biosciences). No aggregation was observed in this time frame. For platelet counts, fluorescent beads (Thermo-Fisher #C36950) were added to volume equivalents of EDTA-treated blood diluted 1: in ice-cold PBS, which allowed normalization of platelet counts per unit volume.
Complete Blood Count (CBC), Activated Partial Thromboplastin Time (APTT), and Prothrombin Time (PT)
EDTA-treated blood (CBC) or citrated plasma (APTT/PT) was provided to a commercial research organization (Quality Veterinary Laboratory - Davis, CA). All assays were performed according to company protocols.
QUANTIFICATION AND STATISTICAL ANALYSIS
Error bars on all graphs show the standard error of the mean from at least three independent experiments for culture experiments, and at least 7 mice for animal experiments. The p values on single comparisons were performed by t test, while multiple comparisons were calculated using one-way ANOVA with Tukey’s post-test. Numbers (n) for each experiment are indicated in figure legends, or individual sample plots are indicated. Significance is represented as * = p < 0.05, ** = p < 0.01, and *** = p < 0.001, with specific tests and significance markers indicated in each relevant figure.
DATA AND CODE AVAILABILITY
The mass spectrometric raw data associated with this manuscript can be downloaded from MassIVE at ftp://MSV000079131@massive.ucsd.edu (username: MSV000079131).
Supplementary Material
Highlights.
An unbiased SILAC screen identifies >300 proteins secreted by senescent human cells
Forty-four of these proteins have reported roles in hemostasis
Conditioned media from senescent cells promotes platelet activation
Eliminating senescent cells ameliorates pro-coagulation side effects of doxorubicin
ACKNOWLEDGMENTS
We thank the members of the Campisi laboratory for valuable discussions. This work was funded by grants from the NIH (F32AG043252 to S.L., R01AG038688 to P.K., R37AG009909 and R01AG051729 to J.C., and P01041122 to P.K. and J.C.), the Larry L. Hillblom Foundation (2009-A-001-CTR), the American Federation for Aging Research (mid-career award to P.K.), and the NCRR shared instrumentation (1S10OD016281 to B.W.G. and B.S.).
Footnotes
DECLARATION OF INTERESTS
J.C. is a founder and shareholder of Unity Biotechnology, which aims to develop senolytic drugs. The other authors declare no competing interests.
SUPPLEMENTAL INFORMATION
Supplemental Information can be found online at https://doi.org/10.1016/j.celrep.2019.08.049.
REFERENCES
- Acosta JC, Banito A, Wuestefeld T, Georgilis A, Janich P, Morton JP, Athineos D, Kang TW, Lasitschka F, Andrulis M, et al. (2013). A complex secretory program orchestrated by the inflammasome controls paracrine senescence. Nat. Cell Biol 15, 978–990. [DOI] [PMC free article] [PubMed] [Google Scholar]
- Ashrani AA, Gullerud RE, Petterson TM, Marks RS, Bailey KR, and Heit JA (2016). Risk factors for incident venous thromboembolism in active cancer patients: A population based case-control study. Thromb. Res 139, 29–37. [DOI] [PMC free article] [PubMed] [Google Scholar]
- Baar MP, Brandt RMC, Putavet DA, Klein JDD, Derks KWJ, Bourgeois BRM, Stryeck S, Rijksen Y, van Willigenburg H, Feijtel DA, et al. (2017). Targeted apoptosis of senescent cells restores tissue homeostasis in response to chemotoxicity and aging. Cell 169, 132–147.e16. [DOI] [PMC free article] [PubMed] [Google Scholar]
- Baker DJ, Childs BG, Durik M, Wijers ME, Sieben CJ, Zhong J, Saltness RA, Jeganathan KB, Verzosa GC, Pezeshki A, et al. (2016). Naturally occurring p16(Ink4a)-positive cells shorten healthy lifespan. Nature 530, 184–189. [DOI] [PMC free article] [PubMed] [Google Scholar]
- Beigi R, Kobatake E, Aizawa M, and Dubyak GR (1999). Detection of local ATP release from activated platelets using cell surface-attached firefly luciferase. Am. J. Physiol 276, C267–C278. [DOI] [PubMed] [Google Scholar]
- Bosch DJ, Van Dalfsen QA, Mul VE, Hospers GA, and Plukker JT (2014). Increased risk of thromboembolism in esophageal cancer patients treated with neoadjuvant chemoradiotherapy. Am. J. Surg 208, 215–221. [DOI] [PubMed] [Google Scholar]
- Campisi J (2013). Aging, cellular senescence, and cancer. Annu. Rev. Physiol 75, 685–705. [DOI] [PMC free article] [PubMed] [Google Scholar]
- Chang J, Wang Y, Shao L, Laberge RM, Demaria M, Campisi J, Janakiraman K, Sharpless NE, Ding S, Feng W, et al. (2016). Clearance of senescent cells by ABT263 rejuvenates aged hematopoietic stem cells in mice. Nat. Med 22, 78–83. [DOI] [PMC free article] [PubMed] [Google Scholar]
- Childs BG, Durik M, Baker DJ, and van Deursen JM (2015). Cellular senescence in aging and age-related disease: from mechanisms to therapy. Nat. Med 21, 1424–1435. [DOI] [PMC free article] [PubMed] [Google Scholar]
- Coppé JP, Patil CK, Rodier F, Sun Y, Muñoz DP, Goldstein J, Nelson PS, Desprez PY, and Campisi J (2008). Senescence-associated secretory phenotypes reveal cell-nonautonomous functions of oncogenic RAS and the p53 tumor suppressor. PLoS Biol. 6, 2853–2868. [DOI] [PMC free article] [PubMed] [Google Scholar]
- Dachary-Prigent J, Freyssinet JM, Pasquet JM, Carron JC, and Nurden AT (1993). Annexin V as a probe of aminophospholipid exposure and platelet membrane vesiculation: a flow cytometry study showing a role for free sulfhydryl groups. Blood 81, 2554–2565. [PubMed] [Google Scholar]
- Demaria M, Ohtani N, Youssef SA, Rodier F, Toussaint W, Mitchell JR, Laberge RM, Vijg J, Van Steeg H, Dollé ME, et al. (2014). An essential role for senescent cells in optimal wound healing through secretion of PDGF-AA. Dev. Cell 31, 722–733. [DOI] [PMC free article] [PubMed] [Google Scholar]
- Demaria M, O’Leary MN, Chang J, Shao L, Liu S, Alimirah F, Koenig K, Le C, Mitin N, Deal AM, et al. (2017). Cellular senescence promotes adverse effects of chemotherapy and cancer relapse. Cancer Discov. 7, 165–176. [DOI] [PMC free article] [PubMed] [Google Scholar]
- Dimri GP, Lee X, Basile G, Acosta M, Scott G, Roskelley C, Medrano EE, Linskens M, Rubelj I, Pereira-Smith O, et al. (1995). A biomarker that identifies senescent human cells in culture and in aging skin in vivo. Proc. Natl. Acad. Sci. U S A 92, 9363–9367. [DOI] [PMC free article] [PubMed] [Google Scholar]
- Ewald JA, Desotelle JA, Wilding G, and Jarrard DF (2010). Therapy-induced senescence in cancer. J. Natl. Cancer Inst 102, 1536–1546. [DOI] [PMC free article] [PubMed] [Google Scholar]
- Gurbel PA, Jeong YH, Navarese EP, and Tantry US (2016). Platelet-mediated thrombosis: from bench to bedside. Circ. Res 118, 1380–1391. [DOI] [PubMed] [Google Scholar]
- Heit JA, Silverstein MD, Mohr DN, Petterson TM, O’Fallon WM, and Melton LJ 3rd. (2000). Risk factors for deep vein thrombosis and pulmonary embolism: a population-based case-control study. Arch. Intern. Med 160, 809–815. [DOI] [PubMed] [Google Scholar]
- Hoare M, Ito Y, Kang TW, Weekes MP, Matheson NJ, Patten DA, Shetty S, Parry AJ, Menon S, Salama R, et al. (2016). NOTCH1 mediates a switch between two distinct secretomes during senescence. Nat. Cell Biol 18, 979–992. [DOI] [PMC free article] [PubMed] [Google Scholar]
- Huang DW, Sherman BT, Tan Q, Kir J, Liu D, Bryant D, Guo Y, Stephens R, Baseler MW, Lane HC, and Lempicki RA (2007). DAVID Bioinformatics Resources: expanded annotation database and novel algorithms to better extract biology from large gene lists. Nucleic Acids Res. 35, W169–W175. [DOI] [PMC free article] [PubMed] [Google Scholar]
- Huang YS, Lee CC, Chang TS, Ho HC, Su YC, Hung SK, Lee MS, Chou P, Chang YH, and Lee CC (2011). Increased risk of stroke in young head and neck cancer patients treated with radiotherapy or chemotherapy. Oral Oncol. 47, 1092–1097. [DOI] [PubMed] [Google Scholar]
- Isenberg JS, Romeo MJ, Yu C, Yu CK, Nghiem K, Monsale J, Rick ME, Wink DA, Frazier WA, and Roberts DD (2008). Thrombospondin-1 stimulates platelet aggregation by blocking the antithrombotic activity of nitric oxide/cGMP signaling. Blood 111, 613–623. [DOI] [PMC free article] [PubMed] [Google Scholar]
- Jeon OH, Kim C, Laberge RM, Demaria M, Rathod S, Vasserot AP, Chung JW, Kim DH, Poon Y, David N, et al. (2017). Local clearance of senescent cells attenuates the development of post-traumatic osteoarthritis and creates a pro-regenerative environment. Nat. Med 23, 775–781. [DOI] [PMC free article] [PubMed] [Google Scholar]
- Keshishian H, Addona T, Burgess M, Kuhn E, and Carr SA (2007). Quantitative, multiplexed assays for low abundance proteins in plasma by targeted mass spectrometry and stable isotope dilution. Mol. Cell. Proteomics 6, 2212–2229. [DOI] [PMC free article] [PubMed] [Google Scholar]
- Kim SH, Lim KM, Noh JY, Kim K, Kang S, Chang YK, Shin S, and Chung JH (2011). Doxorubicin-induced platelet procoagulant activities: an important clue for chemotherapy-associated thrombosis. Toxicol. Sci 124, 215–224. [DOI] [PubMed] [Google Scholar]
- Krtolica A, Parrinello S, Lockett S, Desprez PY, and Campisi J (2001). Senescent fibroblasts promote epithelial cell growth and tumorigenesis: a link between cancer and aging. Proc. Natl. Acad. Sci. U S A 98, 12072–12077. [DOI] [PMC free article] [PubMed] [Google Scholar]
- Kuhn ML, Zemaitaitis B, Hu LI, Sahu A, Sorensen D, Minasov G, Lima BP, Scholle M, Mrksich M, Anderson WF, et al. (2014). Structural, kinetic and proteomic characterization of acetyl phosphate-dependent bacterial protein acetylation. PLoS ONE 9, e94816. [DOI] [PMC free article] [PubMed] [Google Scholar]
- Kuilman T, Michaloglou C, Vredeveld LC, Douma S, van Doorn R, Desmet CJ, Aarden LA, Mooi WJ, and Peeper DS (2008). Oncogene-induced senescence relayed by an interleukin-dependent inflammatory network. Cell 133, 1019–1031. [DOI] [PubMed] [Google Scholar]
- Laberge RM, Sun Y, Orjalo AV, Patil CK, Freund A, Zhou L, Curran SC, Davalos AR, Wilson-Edell KA, Liu S, et al. (2015). MTOR regulates the pro-tumorigenic senescence-associated secretory phenotype by promoting IL1A translation. Nat. Cell Biol 17, 1049–1061. [DOI] [PMC free article] [PubMed] [Google Scholar]
- Mathur A, Hong Y, Wang G, and Erusalimsky JD (2004). Assays of megakaryocyte development: surface antigen expression, ploidy, and size. Methods Mol. Biol 272, 309–322. [DOI] [PubMed] [Google Scholar]
- Michelson AD (2010). Antiplatelet therapies for the treatment of cardiovascular disease. Nat. Rev. Drug Discov 9, 154–169. [DOI] [PubMed] [Google Scholar]
- Muñoz-Espín D, and Serrano M (2014). Cellular senescence: from physiology to pathology. Nat. Rev. Mol. Cell Biol 15, 482–496. [DOI] [PubMed] [Google Scholar]
- Muñoz-Espín D, Cañamero M, Maraver A, Gómez-López G, Contreras J, Murillo-Cuesta S, Rodríguez-Baeza A, Varela-Nieto I, Ruberte J, Collado M, and Serrano M (2013). Programmed cell senescence during mammalian embryonic development. Cell 155, 1104–1118. [DOI] [PubMed] [Google Scholar]
- Nieswandt B, Schulte V, and Bergmeier W (2004). Flow-cytometric analysis of mouse platelet function. Methods Mol. Biol 272, 255–268. [DOI] [PubMed] [Google Scholar]
- Prieur A, and Peeper DS (2008). Cellular senescence in vivo: a barrier to tumorigenesis. Curr. Opin. Cell Biol 20, 150–155. [DOI] [PubMed] [Google Scholar]
- Ruggeri ZM (2002). Platelets in atherothrombosis. Nat. Med 8, 1227–1234. [DOI] [PubMed] [Google Scholar]
- Schilling B, Rardin MJ, MacLean BX, Zawadzka AM, Frewen BE, Cusack MP, Sorensen DJ, Bereman MS, Jing E, Wu CC, et al. (2012). Platform-independent and label-free quantitation of proteomic data using MS1 extracted ion chromatograms in skyline: application to protein acetylation and phosphorylation. Mol. Cell. Proteomics 11, 202–214. [DOI] [PMC free article] [PubMed] [Google Scholar]
- Schulze H (2012). Culture of murine megakaryocytes and platelets from fetal liver and bone marrow. Methods Mol. Biol 788, 193–203. [DOI] [PubMed] [Google Scholar]
- Semple JW, Italiano JE Jr., and Freedman J (2011). Platelets and the immune continuum. Nat. Rev. Immunol 11, 264–274. [DOI] [PubMed] [Google Scholar]
- Sepúlveda C, Palomo I, and Fuentes E (2015). Primary and secondary haemostasis changes related to aging. Mech. Ageing Dev 150, 46–54. [DOI] [PubMed] [Google Scholar]
- Steinhubl SR, Eikelboom JW, Hylek EM, Dauerman HL, Smyth SS, and Becker RC (2014). Antiplatelet therapy in prevention of cardio- and venous thromboembolic events. J. Thromb. Thrombolysis 37, 362–371. [DOI] [PubMed] [Google Scholar]
- Storer M, Mas A, Robert-Moreno A, Pecoraro M, Ortells MC, Di Giacomo V, Yosef R, Pilpel N, Krizhanovsky V, Sharpe J, and Keyes WM (2013). Senescence is a developmental mechanism that contributes to embryonic growth and patterning. Cell 155, 1119–1130. [DOI] [PubMed] [Google Scholar]
- Tanaka KA, Key NS, and Levy JH (2009). Blood coagulation: hemostasis and thrombin regulation. Anesth. Analg 108, 1433–1446. [DOI] [PubMed] [Google Scholar]
- Tran H, and Anand SS (2004). Oral antiplatelet therapy in cerebrovascular disease, coronary artery disease, and peripheral arterial disease. JAMA 292, 1867–1874. [DOI] [PubMed] [Google Scholar]
- Vergati M, Della-Morte D, Ferroni P, Cereda V, Tosetto L, La Farina F, Guadagni F, and Roselli M (2013). Increased risk of chemotherapy-associated venous thromboembolism in elderly patients with cancer. Rejuvenation Res. 16, 224–231. [DOI] [PubMed] [Google Scholar]
- Versteeg HH, Heemskerk JW, Levi M, and Reitsma PH (2013). New fundamentals in hemostasis. Physiol. Rev 93, 327–358. [DOI] [PubMed] [Google Scholar]
- Wiley CD, Velarde MC, Lecot P, Liu S, Sarnoski EA, Freund A, Shirakawa K, Lim HW, Davis SS, Ramanathan A, et al. (2016). Mitochondrial dysfunction induces senescence with a distinct secretory phenotype. Cell Metab. 23, 303–314. [DOI] [PMC free article] [PubMed] [Google Scholar]
- Zagar TM, Cardinale DM, and Marks LB (2016). Breast cancer therapy-associated cardiovascular disease. Nat. Rev. Clin. Oncol 13, 172–184. [DOI] [PubMed] [Google Scholar]
Associated Data
This section collects any data citations, data availability statements, or supplementary materials included in this article.
Supplementary Materials
Data Availability Statement
The mass spectrometric raw data associated with this manuscript can be downloaded from MassIVE at ftp://MSV000079131@massive.ucsd.edu (username: MSV000079131).