

Summary
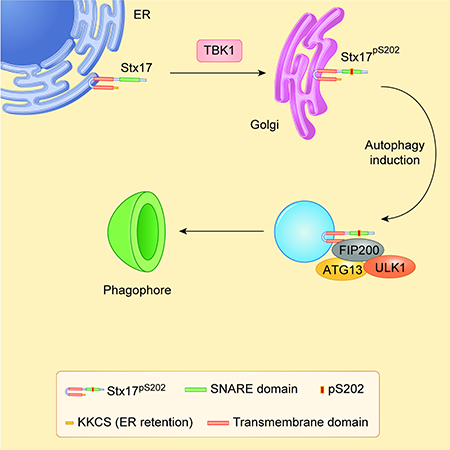
Syntaxin 17 (Stx17) has been implicated in autophagosome-lysosome fusion. Here we report that Stx17 functions in assembly of protein complexes during autophagy initiation. Stx17 is phosphorylated by TBK1 whereby phospho-Stx17 controls formation of the ATG13+FIP200+ mammalian pre-autophagosomal structure (mPAS) in response to induction of autophagy. TBK1 phosphorylates Stx17 at S202. During autophagy induction, Stx17pS202 transfers from the Golgi, where its steady state pools localize, to the ATG13+FIP200+ mPAS. Stx17pS202 was in complexes with ATG13 and FIP200, whereas its nonphosphorylatable mutant Stx17S202A was not. Stx17 or TBK1 knockouts blocked ATG13 and FIP200 puncta formation. Stx17 or TBK1 knockouts reduced formation of ATG13 protein complexes with FIP200 and ULK1. Endogenous Stx17pS202 colocalized with LC3B following induction of autophagy. Stx17 knockout diminished LC3 response and reduced sequestration of the prototypical bulk autophagy cargo lactate dehydrogenase. We conclude that Stx17 is a TBK1 substrate and that together they orchestrate assembly of mPAS.
eTOC Blurb
Kumar et al. show that TBK1 phosphorylation of Stx17 is required for the formation of the mammalian pre-autophagosomal structure (mPAS). Phosphorylated Stx17 translocates from the Golgi to help assemble the cytoplasmic mPAS complex upon autophagy induction. Stx17 and TBK1 thus cooperate in autophagy initiation in addition to previously assigned functions.
Graphical Abstract
INTRODUCTION
The autophagy pathway controlled by the ATG factors is a cytoplasmic homeostatic process that plays both metabolic and quality control roles and affects a wide range of physiological and pathological conditions. The known components of the autophagy machinery in mammalian cells include several protein complexes. One such complex contains the first autophagy pathway-dedicated protein kinase ULK1, corresponding to Atg1 in yeast (Chan et al., 2007; Mizushima et al., 2011). The ULK1 complex contains additional components, including FIP200 (Hara et al., 2008) and ATG13 (Alers et al., 2014). These and additional proteins are substrates for upstream kinases, mTOR and AMPK, which regulate the activity of the ULK1 complex in response to the classical inducer of autophagy, starvation (Inoki et al., 2012). In yeast, autophagosomes emanate from the well-defined pre-autophagosomal structure (PAS), whereas the definition of its counterpart in mammalian cells has been elusive.
The ULK1 complex is often considered to be the putative mammalian equivalent of PAS (Mizushima et al., 2011), referred herein as mPAS. The definition of the earliest components that define mPAS has been a topic of much interest, with the FIP200 and ATG13 puncta believed to represent the early precursors of autophagosomes in mammalian cells (Alers et al., 2014; Karanasios et al., 2013; Karanasios et al., 2016; Mizushima et al., 2011; Nishimura et al., 2017) and include additional components such as ATG101 (Suzuki et al., 2015). Eventually, this and additional complexes interact physically or functionally (Dooley et al., 2014; Fujita et al., 2013; Gammoh et al., 2013; Hara et al., 2008) with other protein systems, including the conjugation machinery that lipidates mammalian Atg8 proteins (mAtg8s), encompassing the well-known member LC3B (Kabeya et al., 2000) that serves as a marker of the early autophagic organelles such as phagophores/isolation membranes as they progress into closed autophagosomes. At several points along this pathway, the class III PI3K VPS34 contributes to the formation and progression of autophagic membrane intermediates, including the initiation events that transit through a structure known as omegasome, marked by the protein DFCP1 (Axe et al., 2008) that binds PI3P, the product of VPS34 (Baskaran et al., 2014; Petiot et al., 2000). Despite this progress, a number of details and the order of events remain to be defined for early stages in autophagy initiation in mammalian cells.
The degradative autophagy pathway culminates in a fusion of closed autophagosomes, after they complete cargo sequestration, with lysosomal organelles where the cargo is eventually degraded (Mizushima et al., 2011). This process is driven by several SNARE complexes including those containing Ykt6 (Bas et al., 2018; Gao et al., 2018; Matsui et al., 2018; Takats et al., 2018) and Stx17 (Diao et al., 2015; Guo et al., 2014; Itakura et al., 2012; Takats et al., 2013; Wang et al., 2016). Initially, it was thought that Stx17 was the main driver of autophagosome-lysosome fusion, but the latest studies indicate that while it contributes to these events, additional SNARE complexes are required (Bas et al., 2018; Gao et al., 2018; Matsui et al., 2018; Takats et al., 2018). The very early studies with Stx17 have also suggested that it functions in a number of ways, including potentially affecting autophagic initiation at the mitochondriaER contact sites (Arasaki et al., 2018; Arasaki et al., 2015; Hamasaki et al., 2013). However, this concept has not received general support.
Another protein kinase, TBK1 (Ahmad et al., 2016), has been implicated in autophagy (Pilli et al., 2012; Thurston et al., 2009; Wild et al., 2011). Some of these studies have focused on interactions between TBK1 and selective autophagy receptors (Thurston et al., 2009; Wild et al., 2011), whereas other studies have suggested a more generalized role in autophagosomal maturation (Pilli et al., 2012) or in trafficking events associated with ATG9 (Saitoh et al., 2009). TBK1 in principle works with a number of adaptors in innate immunity responses such as type I interferon activation (Liu et al., 2015), whereas its interactions with autophagy receptors and regulators expands its repertoire beyond the interferon stimulation.
In this work, we show that TBK1 interacts with and modulates another autophagy factor, Stx17, beside the known selective autophagy receptors. The interaction of Stx17 and TBK1 is further reflected in phosphorylation of Stx17 by TBK1 and modulation of its function. Surprisingly, these interactions and phosphorylation of Stx17 by TBK1 occur at the earliest stages of autophagy, i.e. at its initiation. We demonstrate that phosphorylation of Stx17 is important for assembly of the ULK1 complex and that it is critical for autophagy initiation. We show that phosphorylated Stx17 and components of the ULK1 complex, localized to the Golgi in the resting state, respond to induction of autophagy by translocating from the Golgi to participate in the formation of mPAS during autophagy initiation.
RESULTS
Stx17 and TBK1 interact and TBK1 phosphorylates Stx17 at Ser-202
A set of proteomic analyses (Figure 1A; Table S1) indicated that TBK1 was found in complexes with Stx17. Pull-down experiments comparing GFP vs GFP-Stx17 (Table S1, Tabs 1 and 2) showed 6 or 7 exclusive unique TBK1 peptides (Figure S1A) present only with GFP-Stx17 in 2 out of 3 biological repeats (Figure 1A). This was confirmed by co-immunoprecipitation (co-IP) of endogenous proteins (Figure 1A, bottom panel) and FLAG-Stx17 co-IP with Myc-TBK1 (Fig. 1B). A band with lower electrophoretic mobility (a band shift) recognized by FLAG antibody appeared in FLAG-Stx17 co-IPs with enzymatically active Myc-TBK1 but not in co-IPs with enzymatically dead mutant Myc-TBK1K38D (Figure 1B). Co-expression of FLAG-Stx17 with Myc-tagged proteins (Myc-TBK1 and Myc-TBK1K38D) in TBK1KO HEK293 cells resulted in a similar FLAG-Stx17 mobility shift in cells expressing enzymatically active TBK1 but not in cells expressing TBK1K38D (Figure S1B). A mass spectrometric (MS) analysis of FLAG-Stx17 immunoprecipitates from TBK1KO HEK293 cells identified a precursor ion at m/z 717.3318 corresponding to a triply charged trypsin generated Stx17 peptide IDSIADHVNSAAVNVEEGTK with a phospho-Ser-202 (Stx17pS202) modification (theoretical average at m/z 717.4096). Phosphorylation sites were verified using the PTMrs module in Proteome Discoverer. The MS/MS spectra from Proteome Discoverer indicated that it was Ser-202 that was phosphorylated and not the other potential sites (Table S1, Tab3). The phospho-IDSIADHVNSAAVNVEEGTK (Stx17pS202) peptide was 97–153 and 148–205 times (range from two experiments) more abundant in TBK1 samples relative to samples with Myc or Myc-TBK1K38D (Figure S1C), indicating that TBK1 is a kinase acting on Ser-202 of Stx17. There were additional phosphorylated residues, but they either did not depend on TBK1 or had low post-translational modification probability or low peptide identification confidence.
Figure 1. TBK1 interacts with and phosphorylates Stx17 at Ser-202.

(A) MS analysis showing comparison of GFP or GFP-Stx17 peptides in co-IPs with TBK1, extracted from Table S1(upper panel). Co-IP between endogenous Stx17 and TBK1 in 293T cells (lower panel). (B) Co-IP of FLAG-Stx17 with Myc-TBK1WT or Myc-TBK1K38D in 293 T cells. * indicates the phospho-shift in FLAG-Stx17 induced by Myc-TBK1WT (lane 2) and not by Myc-TBK1K38D (lane 3). (C) Mass-spec analysis showing phosphorylation of FLAG-Stx17 at Ser-202 residue induced by Myc-TBK1 (right panel) and not by Myc alone (left panel). (D) Western blot analysis of Stx17pS202 levels in WT, Stx17KO and TBK1KO HeLa cells treated with 500 ng/ml of LPS for 4h. White asterisk, Stx17pS202 (note minor levels in TBK1 knockout cells). (E) A schematic showing phosphorylation of Stx17 at Ser-202 residue by TBK1. See also Figure S1 and Table S1.
The Ser-202 residue is within an evolutionarily highly conserved sequence in Stx17 from fish to humans (Figure S1D), located between the SNARE layers +1 and +2 (“1.5”) and predicted to face outwards of the 4-helix bundle (Figure S1E). We raised an antibody against a pSer-202 phosphopeptide spanning this region of Stx17 and obtained antibodies recognizing a band on Western blots that was absent in Stx17 CRISPR knockout HeLa cells (Figures 1D and S1F), and strongly diminished in TBK1KO HeLa cells (Figure 1D, S1G and S1I). The Stx17pS202 band was responsive to agonists of TBK1 (muramyl-dipeptide/MDP and LPS), albeit it was also detectable in resting cells (Figure S1H). A TBK1 inhibitor BX795 inhibited Stx17 phosphorylation (Stx17pS202) in cells stimulated with LPS, and also reduced the low baseline levels seen in unstimulated cells (Figure S1I). Thus, TBK1 phosphorylates Stx17 at Ser202 (Figure 1E).
Phosphorylated Stx17 localizes to the Golgi
Using the antibody against Stx17pS202 we found that it labeled specifically Stx17 at the Golgi apparatus. Figure 2A shows that Stx17pS202 colocalizes in resting cells with the Golgi marker GM130. Antibody labeling of Stx17pS202 was not detected in Stx17KO cells (Figure 2A) and the signal was absent in cells pretreated with λ phosphatase (Figure S2A). In TBK1KO cells, there was still some labeling, but the signal was dramatically reduced (Figure S2A). We could not compare Stx17pS202 with the distribution of total endogenous Stx17 by immunofluorescence since there are at present no commercial antibodies that can reveal authentic endogenous Stx17, but it is in general known to be in various membranes including ER (Steegmaier et al., 2000; Steegmaier et al., 1998), mitochondria (Arasaki et al., 2015; Hamasaki et al., 2013; Itakura et al., 2012) ER-mitochondria contact sites (Hamasaki et al., 2013), and, when Stx17’s putative C-terminal ER retrieval signal sequence (Popoff et al., 2011), KKCS, is deleted, in the Golgi (Itakura et al., 2012). A question arose whether Stx17 changes, i.e. its knockout, can affect other SNAREs implicated in autophagy. We tested but did not detect changes in levels of SNAREs, VAMP7 (Moreau et al., 2011) and SNAP29 (Itakura et al., 2012) (Figure S2B,C), albeit as expected SNAP29 and VAMP8 complexes were reduced in Stx17KO cells (Figure S2D), in keeping with prior reports in the context of autophagosmal maturation (Diao et al., 2015; Itakura et al., 2012). Thus, changes in other SNAREs or their complexes, are unlikely to explain the Golgi localization of Stx17pS202. Further confirmation that Stx17pS202 localized to the Golgi was established by subcellular membrane fractionation (Figure 2B). Thus, the data shown here indicate that Stx17pS202 specifically localizes to the Golgi apparatus.
Figure 2. Stx17pS202 is localized in the Golgi.

(A) Confocal microscopy analysis of colocalization between Stx17pS202 and GM130 in WT (upper panel) or Stx17KO HeLa cells (lower panel). (B) Membrane fractionation using OptiPrep gradients to analyze sub cellular fractionation of Stx17pS202. (C) Confocal microscopy analysis of Stx17pS202 redistribution to peripheral puncta in response to autophagy induction by incubation with EBSS for 1h (Lower panel). (D, E) High content microscopy (HC) of HeLa cells showing colocalization between Stx17pS202 and GM130 in full and starved (1h EBSS) conditions. **, p < 0.01, (n=3) t-test, from 3 independent experiments (>500 primary object examined per well; minimum number of wells, 30). Green masks, algorithm-defined cell boundaries (primary objects); yellow masks, computer-identified overlap between Stx17pS202 and GM130 (target objects); green masks, computer-identified Stx17pS202 dots. Images, a detail form a large database of machine-collected and computer-processed images. (F, G) High content microscopy and quantification to analyze the redistribution of Stx17pS202 to peripheral puncta in response to autophagy induction by starvation. **, p < 0.01, (n=3) t-test. from 3 independent experiments (>500 primary object examined per well; minimum number of wells, 30). White masks, algorithm-defined cell boundaries (primary objects); yellow masks, computer-identified Stx17pS202 dots. Images, a detail form a large database of machine-collected and computer-processed images. (H) A model depicting translocation of Stx17pS202 from Golgi to peripheral puncta upon induction of autophagy with starvation. Scale bars: confocal images 5 μm; HC images, 10 μm. See also Figure S2.
Upon starvation, which is a classical inducer of autophagy, Stx17pS202 partially translocated from the Golgi to peripheral puncta and lost its tight Golgi-ribbon like morphology otherwise observed in resting cells (Figure 2C, S2E). When this was quantified by high content microscopy (HC), a significant reduction in colocalization between Stx17pS202 and GM130 was observed (Figure 2D,E), whereas the total number of peripheral Stx17pS202 increased (Figure 2F,G). The total level of Stx17pS202 did not change with starvation (Figure S2F). Thus, starvation-induced autophagy (Figure S2G,H) is not associated with changes in Stx17pS202 levels but is associated with redistribution of Stx17pS202 from the Golgi apparatus to peripheral punctate sites (Figure 2H).
Stx17 and TBK1 affect mammalian PAS formation
The intriguing phenotype of Stx17pS202 translocation to peripheral puncta during induction of autophagy prompted us to test whether the mPAS formation was affected in Stx17 and TBK1 knockouts. Using ATG13, a component of the mammalian ULK1-ATG13-FIP200 complex often used as an early surrogate marker for mPAS (Ganley et al., 2009; Jung et al., 2009; Karanasios et al., 2013; Karanasios et al., 2016; Koyama-Honda et al., 2013; Lamb et al., 2013), we observed that endogenous ATG13 puncta formation in response to starvation is severely reduced in Stx17KO and cells (Figures 3A-C and S3A). Along with ATG13, another component of the ULK1 autophagosomal initiation complex is FIP200/RB1CC1 (Ganley et al., 2009; Jung et al., 2009). Endogenous FIP200 puncta were also severely reduced in Stx17KO and TBK1KO cells (Figures 3D-F and S3B). The ULK1 puncta (GFP-ULK1) were correspondingly reduced in Stx17KO cells (Figure S3C-E). DFCP1 (Axe et al., 2008) profiles were reduced in Stx17KO and TBK1KO cells (Figures S3F-H). Another well-known marker of early stages of autophagy, WIPI2, displayed reduced number of puncta in Stx17 knockout cells (Figure S3 I-K). Thus, Stx17 and TBK1 are required for formation of mPAS and early autophagosomal intermediate structures.
Figure 3. Stx17 and TBK1 are required for formation of mPAS.

(A,B) HC analysis of effect of Stx17 and TBK1 knockouts on formation of ATG13 puncta in HeLa cells induced for autophagy by incubating in EBSS for 1h. White masks, algorithm-defined cell boundaries (primary objects); green masks, computer-identified ATG13 dots. Images, a detail from a large database of machine-collected and computer-processed images (see B). Western blot panel shows Stx17 and TBK1 knockouts in HeLa cells. Panel to the right, Western blot showing TBK1 and Stx17 knockouts in HeLa cells. (B) High content quantifications showing the effect of Stx17 and TBK1 knockouts on formation of ATG13 puncta in HeLa cells induced for autophagy by incubating in EBSS for 1h. Scale bar 10 μm. **, p < 0.01, (n=3) ANOVA; from 4 independent experiments (>500 primary object examined per well; minimum number of wells, 60). (C) Confocal microscopy showing the effect of Stx17 and TBK1 knockouts on formation of ATG13 puncta in HeLa cells incubated in full media or induced for autophagy by incubation with EBSS for 1h. Scale bar 5 μm. (D, E) High content microscopy and quantifications showing the effect of Stx17 and TBK1 knockouts on formation of FIP200 puncta in HeLa cells incubated in full media or EBSS for 1h. Scale bar 10 μm. **, p < 0.01, (n=3) ANOVA; from 4 independent experiments (>500 primary object examined per well; minimum number of wells, 60). Blue masks, algorithm-defined cell boundaries (primary objects); green masks, computer-identified FIP200 dots. Images, a detail form a large database of machine-collected and computer-processed images. (F) Confocal microscopy analysis of the effect of Stx17 and TBK1 knockouts on formation of FIP200 puncta in HeLa cells induced for autophagy by incubating in EBSS for 1h. Scale bar 5 μm. See also Figure S3.
Only phosphorylatable or phosphomimetic Stx17 can complement ATG13 and FIP200 phenotypes in Stx17KO cells
We next asked the question of whether Stx17KO can be complemented to restore ATG13 and FIP200 responses to autophagy induction by starvation. We generated phosphomimetic and unphosphorylatable mutants of Stx17, Stx17S202D and Stx17S202A and used FLAG-Stx17 WT, S202A, and S202D variants in subsequent experiments. Only Stx17WT and Stx17S202D complemented Stx17KO in HeLa cells, as quantified by HC analysis of cells gated for transfected cells and judged by both markers, ATG13 and FIP200 puncta, in starved cells (Figures 4A-D and S4A), these data were further confirmed by confocal microscopy, where Stx17KO cells complemented with Stx17WT and Stx17S202D restored ATG13 and FIP200 response to autophagy (Figure S4B,C). Furthermore, we cross-complemented TBK1 knockout cells with FLAG-Stx17WT, FLAG-Stx17S202A, and FLAG-Stx17202D variants, HC microscopy quantification revealed that Stx17S202D fully complemented the reduced ATG13 and FIP200 puncta formation in TBK1KO cells whereas Stx17S202A had no effect. Nevertheless, FLAG-Stx17WT showed lower in magnitude but measurable cross-complementation in TBK1KO, likely due to another kinase (Figure 4E-H). Thus, preventing Stx17 from being phosphorylated at the S202 site precludes its functionality in autophagy initiation. Stx17 and its phosphorylation by TBK1 affect autophagy initiation as summarized in Figure 4I.
Figure 4. Phosphorylation of Stx17 by TBK1 is required for formation of ATG13 and FIP200 puncta.

(A,B) HC analysis of effect of complementation of Stx17KO cells with FLAG-Stx17WT, FLAG-Stx17S202A and FLAG-Stx17S202D on formation of ATG13 dots in response to autophagy induction by incubation with EBSS for 1h. White masks, computer-identified FLAG positive cells (primary objects); red masks, computer-identified ATG13 dots in FLAG transfected cells. HeLa WT (left) were left un-transfected for control. (Scale bar 10 μm). **, p < 0.01, (n=3) ANOVA. (C,D) HC analysis to analyze the effect of complementation of Stx17KO with FLAG-Stx17 WT, FLAG-Stx17S202A and FLAG-Stx17S202D on formation of FIP200 dots in response to autophagy induction by incubation with EBSS for 1h. White masks, computer-identified FLAG positive cells (primary objects); red masks, computer-identified FIP200 dots in FLAG transfected cells. Scale bar 10 μm. **, p < 0.01, (n=3) ANOVA. (E,F). HC analysis of effect of cross-complementation of TBK1KO cells with FLAG-Stx17WT, FLAG-Stx17S202A and FLAG-Stx17S202D on formation of FIP200 dots in response to autophagy induction by incubation with EBSS for 1h. White masks, computer-identified FLAG positive cells (primary objects); red masks, computer-identified ATG13 dots in FLAG transfected cells.White masks, computer-identified FLAG positive cells (primary objects); red masks, computer-identified ATG13 dots in FLAG transfected cells. Scale bar 10 μm. **, p < 0.01, (n=3) ANOVA. (G,H) HC analysis of effect of cross-complementation of TBK1KO cells with FLAG-Stx17WT, FLAG-Stx17S202A and FLAG-Stx17S202D on formation of FIP200 dots in response to autophagy induction by incubation with EBSS for 1h. White masks, computer-identified FLAG positive cells (primary objects); red masks, computer-identified ATG13 dots in FLAG transfected cells. Scale bar 10 μm. **, p < 0.01, (n=3) ANOVA. (I) A model depicting the effect of Stx17 on formation of mammalian pre-autophagosomal structures and omegasomes. In HC experiments (A-H), Images are details from a large database of machine-collected and computer-processed images; data are from 3–5 independent experiments (>500 primary object examined per well; minimum number of wells, 12). See also Figure S4.
Phosphorylated Stx17 interacts with ATG13 and FIP200
We next tested whether Stx17pS202 associated with members of the mPAS complex. Stx17pS202 co-IP’ed with endogenous ATG13 (Figure 5A). It also interacted with FIP200 (Figure 5B). We therefore used phosphomimetic and unphosphorylatable mutants of Stx17, Stx17S202D and Stx17S202A, to test their capacity in these interactions. Only Stx17S202D and wild type Stx17 were found in co-IPs with ATG13 (with Stx17S202D showing enhanced binding; Figures 5C,D), and with FIP200 (Figures 5E,F). We tested whether Stx17pS202, which translocates from the Golgi to peripheral sites/puncta (Figure 2B), colocalized with ATG13 upon induction of autophagy. For this, antibodies were not compatible for testing in HeLa cells and thus we resorted to mouse cells, using primary macrophages (bone marrow-derived macrophages; BMMs). In BMMs, Stx17pS202 colocalized with ATG13 puncta and this colocalization increased upon induction of autophagy (Figure 5G-I, Figure S4D). Stx17pS202 also colocalized with GFP-FIP200 and GFP-ULK1 (Figures 5J-O and S4E,F). GFP-FIP200 and Stx17pS202 colocalized in resting cells and the colocalization appeared to be in the Golgi, where pools of Stx17pS202 reside. Subcellular membrane separation showed co-fractionation of FIP200 and Stx17pS202 with the Golgi marker GM130 (Fig S4G). Thus, not only does Stx17 affect mPAS components but it also interacts and colocalizes with them (Figure 5P).
Figure 5. Stx17pS202 interacts with ATG13 and FIP200.

(A, B) Co-IP showing interactions of endogenous ATG13 (A) or FIP200 (B) with Stx17pS202 in 293 T cells. (C) Co-IP analysis of interactions between FLAG tagged Stx17 WT, Stx17 S202A or Stx17 S202D and ATG13 in 293T cells. (D) Graph showing quantifications of interactions between ATG13 and FLAG-Stx17 variants. **, p < 0.01, (n=3) ANOVA. (E) Co-IP analysis of interactions between FLAG tagged Stx17 WT, Stx17 S202A or Stx17 S202D with endogenous FIP200 in 293T cells. (F) Graph showing quantifications between FIP200 and FLAG-Stx17 variants. **, p < 0.01, (n=3) ANOVA. (G) Confocal microscopy analysis of colocalization between endogenous ATG13 and Stx17pS202 in BMMs incubated with EBSS for 1h. Scale bar 5 μm. (H,I) HC microscopy analysis and quantifications of colocalization between ATG13 and Stx17pS202 in BMMs incubated in full media or induced for autophagy by incubation with EBSS for 1h. Blue masks, algorithm-defined cell boundaries (primary objects); yellow masks, computer-identified overlap between Stx17pS202 and ATG13 dots. **, p < 0.01, (n=3) t-test. (J) Confocal microscopy analysis of colocalization between GFP-FIP200 and Stx17pS202 in HeLa cells incubated with EBSS for 1h. (K, L) HC microscopy analysis and quantifications showing colocalization between GFP-FIP200 and Stx17pS202 in HeLa cells transfected with GFP-FIP200 and incubated in full media or induced for autophagy by incubation with EBSS for 1h. Blue masks, computer-identified GFP-FIP200 positive cells (primary objects); yellow masks, computer-identified overlap between Stx17pS202 and GFP-FIP200 dots in GFP positive cells. **, p < 0.01, (n=3) t-test. (M) Confocal microscopy analysis of colocalization between GFP-ULK1 and Stx17pS202 in HeLa cells incubated with EBSS for 1h. (N, O) High content microscopy and quantifications showing colocalization between GFPULK1 and Stx17pS202 in HeLa cells transfected with GFP-ULKL1 and incubated in full media or induced for autophagy by incubation with EBSS for 1h. White masks, computer-identified GFP-ULK1 positive cells (primary objects); yellow masks, computer-identified overlap between Stx17pS202 and GFP-ULK1 dots in GFP positive cells. **, p < 0.01, (n=3) t-test. Masks; white: GFP-ULK1 positive objects cells; yellow: number of Stx17pS202 dots also positive for GFP-ULK1 dots. (P) A model showing Stx17pS202 as an interacting partner of mPAS complex. In HC experiments (H,I,K,L,M,O), images are details from a large database of machine-collected and computer-processed images; data are from 3 independent experiments (>500 primary object examined per well; minimum number of wells, 20). See also Figure S4.
Translocation of Stx17 to DFCP1 and LC3 profiles in cells induced for autophagy
We next asked the question whether in cells induced for autophagy, Stx17p202 eventually transfers to nascent autophagosomes. Formation of DFCP1+ omegasome heralds formation of autophagosomes (Axe et al., 2008). We found that Stx17p202 colocalized with DFCP1 (Figure S4H,I), which was tested at a time point later than ATG13 colocalization, compatible with the expectation that ATG13-FIP200 mPAS precedes autophagosome formation. Similarly, Stx17p202 colocalized with LC3 (using GFP-LCB; Figure 6A,B). Super-resolution microscopy showed that Stx17p202 colocalizes with LC3 at a distance of 40 nm (Figure 6C,D and S5A), which places them very near each other on the autophagosomes, compatible with our prior report of direct binding between Stx17 and mAtg8s (Kumar et al., 2018). HC analyses further confirmed increased colocalization between Stx17p202 and LC3B (Figure 6E,F). Mutant forms of Stx17 showed differences in colocalization with LC3B, as quantified by HC: WT and the phosphomimetic Stx17S202D mutant colocalized with LC3B more so than the non-phosphorylatable Stx17S202A mutant (Figures 6G, S5B), reflected also in confocal analyses and Pearson’s colocalization coefficients (Figure S5C,D). Stx17S202A showed dispersed cytoplasmic punctate structures (Figure S5C, middle panels) mostly negative for LC3 (Figure S5D), whereas, Stx17S202D showed a Golgi-like localization (Figure S5C, bottom panels; typical of Stx17pS202) along with peripheral puncta which were positive for LC3 (Figure S5C,D). Furthermore, in cells knocked out for TBK1, there was reduced association of Stx17 and GFP-LC3B in co-IP experiments (Figure S5E,F). Consistent with this, HC analyses showed reduced colocalization between FLAG-Stx17 and LC3 in TBK1KO cells (Figure S5G,H). Thus, phosphorylation of Stx17 is important for its colocalization and association with LC3.
Figure 6. Stx17pS202 is on LC3-positive autophagosomes upon induction of autophagy.

(A) Confocal microscopy showing colocalization between GFP-LC3B and Stx17pS202 in HeLa cells incubated with EBSS for 2h. Scale bar 5 μm. (B) Pearson’s correlation coefficient (>20 cells) of colocalization between GFP-LC3B and Stx17pS202. (C, D) Super-resolution microscopy to analyze colocalization between GFP-LC3B and Stx17pS202 in HeLa cells incubated with EBSS for 2h. Scale bar 500nm. (E,F) HC microscopy and quantifications showing colocalization between GFP-LC3B and Stx17pS202 in HeLa cells incubated in full media or in EBSS for 2h. Scale bar 10 μm. **, p < 0.01, (n=3) t-test. Blue masks, algorithm-defined GFP-LC3B positive cells (primary objects); yellow masks, computer-identified overlap between Stx17pS202 and GFP-LC3B dots. Images are details form a large database of machine-collected and computer-processed images, (G) HC quantifications showing colocalization between FLAG-Stx17 WT, FLAG-Stx17 S202A and FLAG-Stx17 S202D with LC3 in HeLa cells incubated in full media or in EBSS for 2h. **, p < 0.01, (n=3) ANOVA; data are from 3 independent experiments (>500 primary object examined per well; minimum number of wells, 12). (H, I) Membrane fractions using OptiPrep gradients to test redistribution of Stx17pS202 from Golgi (H) in full media to LC3-II fraction in EBSS (I). (J) A model depicting translocation of Stx17pS202 to LC3+ phagophore upon induction of autophagy. See also Figure S5.
Finally, we tested by subcellular fractionation and density separation on OptiPrep gradients where Stx17p202 co-fractionates before and after induction of autophagy. We found that most of Stx17p202 in resting (full medium) cells co-fractionates with the Golgi marker GM130 (Figure 6H), compatible with our immunofluorescence findings. In contrast, the spread of total Stx17 in gradients was much wider and it was dis-enriched in the Golgi fractions (Figure 6H). Following induction of autophagy by starvation in EBSS, some of Stx17p202 translocated to a subset of LC3-II+ (autophagosomal) fractions (Figure 6I). Thus, as determined by various methods, Stx17p202 eventually ends in autophagosomal compartments (Figure 6J).
Stx17 and TBK1 are required for efficient assembly of ULK1-ATG13-FIP200 complexes and LC3 puncta formation
We next wondered whether Stx17 affected the formation of ULK1 complexes. HeLa cells knocked out for Stx17 showed less ULK1 in protein complexes with ATG13 when compared to wild type cells (Figure 7A,B). Likewise, HeLa Stx17KO cells showed less FIP200 in complexes with ATG13 (Figure 7C,D). Similarly, TBK1KO HeLa cells displayed reduced ULK1 (Figure 7E,F) and FIP200 (Figure 7G,H) levels in protein complexes with ATG13. Thus, Stx17 and its phosphorylation by TBK1 are necessary for efficient assembly of components of the mPAS. Further, knockouts of Stx17 and TBK1 reduced LC3 puncta formation at 30 min and 1 h post-induction by starvation. This was tested by monitoring endogenous LC3 response (Figure 7I and S6A). We also used fusion of LC3 with fluorescent proteins to monitor autophagy induction. The GFP-LC3 reporter showed no response in Stx17KO cells, and yet parental wild type cells showed a time response (Figure 7J,K and Figure S6B-D). Using Keima-LC3 (An and Harper, 2018; Katayama et al., 2011), we also observed fewer fluorescent puncta detected by excitation at 440 nm in Stx17KO cells relative to wild type cells (Figure 7L,M). Thus, Stx17 matters for autophagy initiation.
Figure 7: Stx17 is required for autophagy initiation.

(A) Co-IP analysis of interactions between ATG13 and ULK1 in HeLaWT or Stx17KO cells. (B) Graph showing quantification of IP/input ratio of ULK1 in Co-IP with ATG13 in HeLa wild type vs Stx17 knockouts. p < 0.01, (n=3) t-test. (C) Co-IP analysis of interactions between ATG13 and FIP200 in HeLaWT or Stx17KO cells. (D) Graph showing quantification of IP/input ratio of ATG13 in Co-IP with FIP200 in HeLa wild type vs Stx17 knockouts. p < 0.01, (n=3) t-test. (E,F) Co-IP analysis of interactions between ATG13 and ULK1 in HeLaWT or TBK1KO cells. (F) Quantifications from three independent experiments showing ULK1 IP/input ratio. p < 0.01, (n=3) t-test. (G,H) Co-IP analysis of interactions between FIP200 and ATG13 in HeLaWT or TBK1KO cells. (H) Quantifications from three independent experiments showing ULK1 IP/input ratio. p < 0.01, (n=3) t-test. (I) HC quantification showing the effect of Stx17 and TBK1 knockouts on formation of LC3 dots in time dependent starvation response. *, p<0.05; **, p < 0.01, (n=3) ANOVA. data are from 4 independent experiments (>500 primary object examined per well; minimum number of wells, 12). (J) HC analysis to test the effect of Stx17KO on GFP-LC3 puncta formation after 30 min or 1h of starvation. *, p<0.05; **, p < 0.01, (n=3) ANOVA, data are from 3 independent experiments (>500 primary object examined per well; minimum number of wells per plate per time point, 16). (K) Screen shot of HC-scanned 96 well plate of HeLa cells transfected with mCherry-GFP-LC3B and incubated with EBSS for 0 min, 30 min or 60 min; HeLaWT (left half of the plate) or in Stx17KO (right half of the plate). For each experimental well, a minimum of 500 valid object/cells per well were counted for GFP-LC3 puncta. (L, M) HC microscopy analysis and quantification of Keima-LC3 fluorescence at 440nm in HeLaWT or Stx17KO cells incubated in full media or in EBSS for 6h. White masks, algorithm-defined Keima-LC3 positive cells (primary objects); purple masks, computer-identified Keima-LC3 dots. *, p<0.05; **, p < 0.01, (n=3) ANOVA. (N) Schematics showing different steps in LDH sequestration assay. (O) )LDH sequestration assay showing the effect of Stx17 and ATG13 knockouts on LDH sequestration in cell induced for autophagy by incubation with EBSS for 2h in presence of bafilomycin A1. 3 methyladenine (10 mM) was used as a positive control. (P) LDH sequestration assay showing the effect of mATG8s knockouts on LDH sequestration in cells induced for autophagy by incubation with EBSS for 2h in presence of bafilomycin A1. (Q, R) HC analysis and quantification of LDH-keima fluorescence at 440nm in HeLa wt or Stx17KO cells incubated in full media or with EBSS for 2h.*, p<0.05; **, p < 0.01, (n=3) ANOVA. White masks, algorithm-defined LDH-Keima positive cells (primary objects); purple masks, computer-identified LDH-Keima dots. (S) Model showing Stx17 in ER membranes and moves to Golgi after its phosphorylation by TBK1. After induction of autophagy Stx17pS202 translocates from Golgi to peripheral puncta and is associated with the FIP200/ATG13/ULK1 complex, which with additional components form mPAS. In HC experiments (L,M,Q,R), images are details form a large database of machinecollected and computer-processed images, and data are from 3 independent experiments (>500 primary object examined per well; minimum number of wells, 30). See also Figure S6.
Stx17 is required for efficient bulk autophagy cargo sequestration
If Stx17 is important for autophagosomal initiation, and not only for autophagosome-lysosome fusion as previously reported (Itakura et al., 2012), one prediction is that Stx17KO cells would display less bulk autophagy cargo sequestration. A classical cargo for this is uptake of cytosolic lactate dehydrogenase (LDH) into autophagosomes, that can be tested in a well-established cargo sequestration assay (Kopitz et al., 1990; Pattingre et al., 2003; Seglen and Gordon, 1984; Seglen et al., 2015). Employing this assay, we found that Stx17KO reduced LDH sequestration in autophagosomes comparably to the reduction in cargo sequestration caused by a knockout in ATG13 (Figure S6E), or upon treatment of WT cells with classical inhibitor of autophagy 3MA (Figure 7N,O). Published knockouts (Nguyen et al., 2016) of mAtg8s in combinations as triple LC3A-C combination, or triple GABARAPs (GABARAP, L1 and L2), or all six mAtg8s (Hexa) also reduced LDH sequestration (Figure 7P and S6F), albeit the effect of LC3 triple knockouts was milder than effects of GABARAP triple knockouts and Hexa knockout cells, in keeping with a prior report (Engedal and Seglen, 2016; Szalai et al., 2015). In all the above experiments the cells were inhibited for autophagosomal maturation using bafilomycin A1. We also employed LDH-mKeima construct (An and Harper, 2018) and observed reduced Keima fluorescence at 440 nm (excitation) in Stx17KO cells (Figure 7Q,R). Thus, Stx17 is necessary for autophagy initiation and for the sequestration of nonselective, bulk autophagy cargo into non-degradative early autophagosomal organelles (Figure 7S).
DISCUSSION
Here, we found that Stx17 is a substrate for TBK1 phosphorylation and that both TBK1 and Stx17 play a role in autophagy initiation. The phosphorylated form of Stx17 is localized to the Golgi in resting cells. During induction of autophagy, these pools of Stx17 redistribute from the Golgi to peripheral vesicles, which are the likely sites contributing to pre-autophagosomal structures, i.e. the FIP200 and ATG13 puncta, the early precursors of autophagosomes in mammalian cells (Alers et al., 2014; Karanasios et al., 2013; Karanasios et al., 2016; Mizushima et al., 2011; Nishimura et al., 2017). Phosphorylation of Stx17 is necessary for efficient formation of the ATG13 and FIP200 puncta in response to starvation, and Stx17 is required for robust interactions between components of the FIP200-ATG13-ULK1 complex. Stx17 knockout cells do not respond to autophagy induction, reflected in diminished LC3 puncta formation and reduced sequestration of LDH, a classical substrate for starvation-induced bulk autophagy (Kopitz et al., 1990; Pattingre et al., 2003; Seglen and Gordon, 1984; Seglen et al., 2015). Thus, TBK1 and Stx17 cooperate in autophagy initiation during starvation responses.
TBK1, a kinase often associated with immune responses such as type I interferon induction and with roles in cancer and neurodegeneration (Ahmad et al., 2016), has been implicated in autophagy in several ways including interactions with or phosphorylation of autophagy receptors such as NDP52 (Thurston et al., 2009), Optineurin (Wild et al., 2011) and p62 (Pilli et al., 2012). Our present study shows that TBK1 has additional substrates implicated in autophagy, such as Stx17. Previously, both TBK1 (Pilli et al., 2012) and Stx17 (Itakura et al., 2012) have been shown to play a role in autophagy maturation. Our new findings do not contradict this role but indicate that TBK1 plays a role at multiple stages of autophagy, as already evident from modifications of selective autophagy receptors by TBK1 (Wild et al., 2011).
Stx17 has been well studied in the context of autophagy maturation (Diao et al., 2015; Guo et al., 2014; Itakura et al., 2012; Takats et al., 2013; Wang et al., 2016), although more recent studies have implicated additional SNAREs, such as Ykt6, in autophagosome-lysosome fusion (Bas et al., 2018; Gao et al., 2018; Matsui et al., 2018; Takats et al., 2018). Furthermore, Stx17 has diverse functions, some of which are compatible with autophagy initiation (Arasaki et al., 2018; Hamasaki et al., 2013). These additional roles include various processes such as mitochondrial fission (Arasaki et al., 2015), fusion with lysosomes of specialized mitochondria-derived vesicles (McLelland et al., 2016), and fusion of ER-derived vesicles with lysosomes (Fregno et al., 2018), the latter being compatible with the early description of Stx17 localization to the ER (Steegmaier et al., 2000).
Our findings place Stx17pS202 at the Golgi. It has previously been shown that mutation of the putative ER-retrieval signal at the C-terminus of Stx17 leads to re-localization of the bulk Stx17 to the Golgi (Itakura et al., 2012). It is possible that the phosphorylated form of Stx17 conformationally escapes recognition by COPI-dependent ER-retrieval machinery (Popoff et al., 2011). Our MS analyses (Table S1), indicate extensive interactions of Stx17 with the components of the COPI complex (COPA, COPB2, COPG2 and COPG1), in keeping with the above trafficking routes of Stx17.
Upon autophagy induction, Stx17pS202 translocates from the Golgi to the peripheral pools where it colocalizes with FIP200, ATG13, and ULK1. Of interest is that FIP200, like Stx17pS202, co-fractionates with the Golgi membranes. It is possible that a fraction of FIP200 destined for mPAS translocates via a route related to that of Stx17pS202. The Golgi apparatus appears to serve as a depot of Stx17 and possibly of FIP200 until they are needed at the sites of autophagosome formation. This is similar to the presence of ATG9 in the Golgi (Saitoh et al., 2009; Young et al., 2006) until it is mobilized into peripheral Atg9 vesicular pools (Lamb et al., 2016; Soreng et al., 2018). Of note, TBK1 responds to various inputs, in combinations with different receptors/adaptors that it interacts with (Liu et al., 2015), and thus Stx17 could play a role of a novel adaptor/effector for TBK1. One of the previously defined pathways with well-studied adaptors (Liu et al., 2015), includes STING, which traffics from the ER to the Golgi and then to post-Golgi compartments (Saitoh et al., 2009). It is likely that Stx17 and TBK1 intersect at some point along such routes. Of note, the response to starvation is not linked to phosphorylation of Stx17 by TBK1, which appears tonic in nature and is prominently present in resting cells. Rather, starvation induces trafficking events relocating phosphorylated Stx17 from the Golgi to mPAS. The mechanism of this is unknown at present but may share the Atg9 route or depend on another membrane trafficking pathway.
We previously reported that Stx17 interacts with LC3 (Kumar et al., 2018), further extended here to the phosphorylated form of Stx17, Stx17pS202. Since TBK1 knockout reduced this interaction, it is likely that phosphorylation by TBK1 of Stx17, affects the ability of Stx17 to associate with early autophagosomal structures, possibly contributing to transitions between mPAS and LC3-positive autophagosomes. In support of this view is the finding that Stx17pS202 also colocalizes with DFCP1, a marker for an intermediate omegasome structure from which nascent autophagosomes emerge (Axe et al., 2008). Thus, Stx17 transits sequential sites along the autophagosomal pathway.
The interconnections between different parts of autophagy initiation machinery have several well-known precedents, expanded through studies presented here whereby Stx17 and TBK1 integrate additional components with previously appreciated ones. For example, FIP200 links the ULK1 complexes (Hara et al., 2008) with ATG16L1 (Fujita et al., 2013; Gammoh et al., 2013), and hence connects the LC3 conjugation machinery with the mPAS. Furthermore, WIPI2, a PI3P-binding factor, directly interacts with ATG16L1 (Dooley et al., 2014). TBK1 binds, phosphorylates and modulates autophagy receptors such as p62 (Pilli et al., 2012), Optineurin (Wild et al., 2011), and NDP52 (Thurston et al., 2009), and, as shown here, phosphorylates Stx17 and modulates its role in mPAS assembly, thus linking selective autophagy with the core mPAS machinery. Stx17 provides multiple links to the PI3K complex as well: Stx17 binds ATG14 (Arasaki et al., 2018; Diao et al., 2015), a component of the PI3K complex engaged in autophagy initiation. Stx17 and TBK1 role in the assembly of FIP200-ATG13-ULK1 mPAS complexes, most likely including the constitutive partner of ATG13, ATG101 (Suzuki et al., 2015) (albeit this was not specifically verified here) may affect ATG13 interactions with ATG14 and the PI3K complex (Park et al., 2016). Our previous report that Stx17 can bind unlipidated LC3/mAtg8s (Kumar et al., 2018) suggests the possibility that Stx17 may present LC3/mAtg8s as substrates to the conjugation/lipidation machinery. However, other roles for LC3 binding to the Stx17 SNARE domain are possible, such as temporarily blocking Stx17’s engagement in a premature SNARE bundle assembly until the later stages, i.e. maturation. The incorporation of Stx17 at the outset, within the autophagy complexes governing the earliest stages of autophagosome formation, coordinates initiation with subsequent autophagy stages culminating in fusion with the lysosome. This ensures that once the cargo sequestration process is initiated it can be completed to accomplish its degradative role.
STAR METHODS
CONTACT FOR REAGENT AND RESOURCE SHARING
Further information and requests for resources and reagents should be directed to and will be fulfilled by the Lead Contact, Vojo Deretic (vderetic@salud.unm.edu).
EXPERIMENTAL MODEL AND SUBJECT DETAILS
Cell culture
HEK 293T and HeLa cells were obtained from ATCC and maintained in recommended media. Mouse bone marrow macrophages (BMMs) were extracted from mouse bone marrow and cultured in DMEM media supplemented with high glucose, sodium bicarbonate and 20% FBS in presence of mouse macrophage colony stimulating factor (mM-CSF). LC3TKO, GABARAPTKO, HexaKO (all six mATG8KO) and wild type control HeLa cells were from Michael Lazarou (Monash University, Melbourne). Cells were induced for autophagy by incubating in EBSS (Earle’s Balanced Salt Solution). Cell lines sex: HeLa, female origin; other cell lines, sex for other cells has not been determined.
METHODS DETAILS
Antibodies and reagents
The following antibodies and dilutions were used: Stx17 (rabbit; Sigma, HPA001204; 1:1000 (WB)); Flag (mouse;Sigma, F1804; 1:1,000 for (WB); 1:250 (IF)); GFP (rabbit; Abcam, ab290; 0.5 μg/ml (IP) and 1:1000 (WB)); LC3 (rabbit; MBL International PM036 1:500 (IF)); ATG13 (rabbit; Cell Signaling Technology, #13468, 1:1000 (WB); 1:150 (IF)); ATG13 (mouse; Millipore, MABC46, 1:200 (IF)); FIP200 (rabbit; Proteintech, 17250–1-AP; 1:200 (IF)); TBK1(rabbit; Cell Signaling Technology,#3504; 1:1000 (WB, 1:200 (IP)); TBK1PS172 (rabbit; Cell Signaling Technology,#5483, 1:1000 (WB)); FIP200 (rabbit; Cell Signaling Technology,#12436, 1:1000 (WB)); ULK1 (rabbit; Cell Signaling Technology,# 6439, 1:750 (WB)); Stx17pS202 (developed from rabbit BL31269, affinity purified over phospho-peptide. Prep: PP1) 1:250 (IF); 1:1000 (WB)); GFP-Trap (ChromoTek, Gtm-20). Goat anti-mouse IRDye 680 (LI-COR, 925–68020, 1:5000); Goat anti- Rabbit IRDye 800 (LI-COR, 926–32211, 1:5000); Trueblot anti-mouse DyLight 680, (Rockland, 18–4516-32, 1:2000); Trueblot anti-rabbit DyLight 800 (Rockland, 18–8816-31, 1:2000).
Reagents: Lambda Protein Phosphatase (NEW ENGLAND BioLabs Inc.; P0753S); GM 130 (mouse BD Biosciences, RUO-610822, 1:500 (IF)); Dynabeads Protein G (Thermo Fisher Scientific 10003D 50μl/ IP); Bafilomycin A1 (InvivoGen, 13D02-MM); OptiPrep Density Gradient Medium (Sigma, D1556); Lipofectamine 2000, Thermo Scientific, 11668019; DMEM, RPMI and EBSS medias from Life Technologies. Gateway Vector Conversion System (ThermoFisher, 11828–029); LDH Assay kit (Promega, G1780).
Plasmids and transfections
pDest-GFP-Stx17 (Kumar et al., 2018), pDest-Myc-TBK1 and pDest-Myc-TBK1K38D (Pilli et al., 2012), pDest-mCherry-EGFP-LC3B (Pankiv et al., 2007), pEGFP-DFCP1 (Axe et al., 2008), pDest-EGFP-LC3B (Kirkin et al., 2009) have been described earlier. pMXs-IP-EGFP-hFIP200 was from Addgene (Addgene #38192), Keima-LC3 and LDH- Keima was from Heeseon An and J. Wade Harper (Harvard Medical School, Boston MA) (An and Harper, 2018), EGFP-WIPI2 was from T. Proikas-Cezanne (Eberhard Karls University Tübingen, Tübingen, Germany). GFP-ULK1 wad from N. Mizushima (The University of Tokyo, Tokyo, Japan). Plasmids and corresponding mutants used in this study, were cloned into pDONR221 using BP cloning, and expression vectors were made utilizing LR cloning (Gateway, ThermoFisher Scientific) in appropriate pDEST vectors for immunoprecipitation and other assays. Point-mutants were generated using the QuikChange Site-directed Mutagenesis Kit (Agilent, 200523). Plasmid constructs were verified by conventional restriction enzyme digestion and/or by DNA-sequencing. Plasmids were transfected using ProFection Mammalian Transfection System from Promega or using Lipofectamine 2000 (Thermo Fisher Scientific).
Mass spectrometry analysis of Stx17 phosphorylation by TBK1
TBK1 knockout HEK293 cells were transfected with FLAG-Stx17 and cotransfected with either empty Myc-tag vector, wild-type Myc-TBK1 or kinase-dead mutant Myc-TBK1 K38D. Cells were lysed and lysates were incubated with anti-FLAG M2 affinity agarose gel (Sigma-Aldrich, # A2220) for 2 hr and washed three times with Lysis buffer. Bound proteins were eluted by boiling in 2x SDS loading buffer for 10 mins. Eluted proteins were separated by SDS-PAGE. Gel pieces were subjected to in gel reduction with DTT, alkylation with iodoacetamide, and digestion using 6 ng/μl trypsin (Promega, #V511A) or chymotrypsin (Promega, #V1062) (Shevchenko et al., 1996). Peptide mixtures containing 0.1% formic acid were loaded onto a Thermo Fisher Scientific EASYnLC1000 system and EASY-Spray column (C18, 2μm, 100 Å, 50μm, 50 cm). Peptides were fractionated using a 2–100% acetonitrile gradient in 0.1 % formic acid over 50 min at a flow rate of 250 nl/min. The separated peptides were analysed using a Thermo Fisher Scientific Q-Exactive™ mass spectrometer. Data were collected in data dependent mode using a Top10 method. Processing of raw data was done using the Thermo Fisher Scientific Proteome Discoverer 2.2 software. The fragmentation spectra were searched against the current UniProt database using an in-house Mascot server (Matrix Sciences, UK). Peptide mass tolerances used in the search were 10 ppm, and fragment mass tolerance was 0.02 Da. Methionine oxidation and carbamidomethylation was set as variable modifications. Phosphorylation sites were verified using the PTMrs module in Proteome Discoverer™. Visualization of mass spectra was done with the Thermo Fisher Scientific Xcalibur™ software.
Mass spectrometry analysis of Stx17 interactors
HEK293T cells were transfected with plasmids (pDest-EGFP or pDest-EGFP-Stx17) using Lipofectamine 2000 and immunoprecipitation was performed 48 h after transfection using ChromoTek GFP-Trap following the supplier’s instructions. Immunoprecipitated (IPed) samples were loaded on a 12% SDS-polyacrylamide- gel and Coomassie stained. Subsequently each lane was cut into 5 slices and destained. Reduction, alkylation and proteinase digestion was carried out with trypsin overnight at 37ºC as previously described (Faeste et al., 2014; Faeste et al., 2016). Subsequent extraction of protease-generated peptides was performed as previously described (Anonsen et al., 2012). Analyses of in-gel digested peptides were done by reverse phase nanoflow liquid chromatography coupled to a nanoelectrospray QExactive mass spectrometer utilizing a Higher energy induced dissociation (HCD) fragmentation (RP nLC-ESI MS2). The RP nLC was performed as previously described (Faeste et al., 2016).
Generation of CRISPR mutant cells
Stx17 and ATG13 CRISPR in HeLa cells were generated as described (Kumar et al., 2018). Briefly, the lentiviral vector carrying both Cas9 enzyme and a gRNA targeting Stx17 (GATAGTAATCCCAACAGACC), and ATG13 (TCACCCTAGTTATAGCAAGA) were transfected into HEK293T cells together with the packaging plasmids psPAX2 and pCMV-VSV-G at the ratio of 5: 3: 2. Two days after transfection, the supernatant containing lentiviruses was collected and used to infect the cells. 36 hours after infection, the cells were treated with puromycin (1 μg/ml) for one week to select Stx17knockout cells. The knockouts were confirmed by western blotting. To generate TBK1 KO cells in HeLa and HEK293 cells, TBK1 gRNA (GATGAAGATCAACCTGGAAG) was annealed and ligated into a Bbs1 linearized PX459 vector (Addgene #62988) carrying both wild-type Cas9 and puromycin resistance genes. The gRNA containing vector was transfected into both cells using Metafectene Pro (Biontex #T020). 24 hours after transfection, cells were treated with 1 μg/ml of puromycin for 36 h to select transfected cells. Following selection, single cells were sorted into 96-well plates and expanded. The KO cells were confirmed by immunoblotting.
High content microscopy
Cells were plated in 96 well plates and were transfected with plasmids whenever required. Cells were stimulated for autophagy by incubating in EBSS for 1 h or 2 h followed by fixation with 4% paraformaldehyde for 10 mins. Cells were permeabilized with 0.1% saponin and blocked in 3% BSA for 20 mins followed by incubation with primary antibody for 4 h and secondary antibody for 1 h. High content microscopy with automated image acquisition and quantification was carried out using a Cellomics HCS scanner and iDEV software (Thermo Fisher Scientific) using a minimum of 500 cells per well. Scanning parameters and object mask were preset and predefined to analyze images. Hoechst 33342 staining was used for autofocusing and to define object/cells based on background staining of the cytoplasm. Regions of interest (ROI) or targets in primary objects (cells) were algorithm-defined to automatically identify puncta within valid primary objects. For transfected cells, after transfection with GFP or FLAG, cells were stained with required antibodies and HC analysis was used in a mode discriminating GFP or FLAG positive cells from non-transfected cells. A minimum of 500 transfected cells (valid primary objects determined by gating) per well were analyzed within the subpopulation of transfected cells (Mandell et al., 2014).
High content microscopy for Keima probes
WT HeLa and Stx17KO cells were plated in 96 well plates and transfected with Keimaexpression plasmids as indicated in figures. Cells were incubated in full media or induced for autophagy by incubating with EBSS for the times indicated in figures. After autophagy induction cells were incubated with Hoechst 33342 for ten minutes and then images acquired for Keima fluorescence at 440nm and 560 nm using the Cell Insight CX7 High-Content Screening (HCS) Platform (Thermo Fisher Scientific).
Super-resolution microscopy
Super-resolution imaging, and analysis were done as described previously (Kumar et al., 2018). HeLa cells were plated on 25 mm round coverslips (Warner instruments) and allowed to adhere overnight, followed by transfection with GFP-LC3B plasmid. Cells were induced for autophagy by incubating with EBSS for 2h. After fixation, cells were incubated with anti-rabbit-Stx17pS202 antibody for 4h and washed with PBS, followed by labeling with Alexa Fluor 647 (Invitrogen, A21245). The coverslip was mounted on an Attofluor cell chamber (A-7816, Life technologies) with 1.1 ml of the imaging buffer. The imaging and center-to-center distances between GFP-LC3B and Stx17pS202 cluster centroids per ROI (region of interest) were calculated as described earlier (Kumar et al., 2018).
Immunofluorescence confocal microscopy
For immunofluorescence confocal microscopy, cells were plated onto coverslips in 12well plates. Cells were transfected with plasmids indicated in figures. Transfected cells were incubated in full media or EBSS for times indicated in figures and fixed in 4% paraformaldehyde for 10 min followed by permeabilization with 0.1% saponin in 3% BSA. Cells were then blocked in PBS containing 3% BSA and then incubated with primary antibodies for 4 h. Cells were washed three times with PBS and then incubated with appropriate secondary antibodies (Invitrogen) for 1 h at room temperature. Coverslips were then mounted using ProLong Gold Antifade Mountant (Invitrogen) and analyzed by confocal microscopy using the Zeiss LSM510 Laser Scanning Microscope.
LDH (Lactate dehydrogenase) sequestration assay
LDH sequestration assay was done as described previously (Pattingre et al., 2003); (Seglen et al., 2015). Briefly, 3×10⁶ HelaWT, Stx17KO or ATG13KO cells were plated in 10 cm dishes, induced for autophagy using EBSS in presence of Bafilomycin A1 for 2 h. Cells were collected and washed twice with phosphate-buffered saline and then once with homogenization buffer (50 mM potassium phosphate, 1 mM EDTA, 1 mM dithiothreitol, 1 mM phenylmethylsulfonyl fluoride (PMSF), 300 mM sucrose, 100 μg/ml bovine serum albumin, and 0.01% Tween 20. Cells were homogenized in 1 ml of cold homogenization buffer by 15 strokes in a glass/Teflon homogenizer on ice, followed by centrifugation at 300 × g for 10 min at 4°C. Post-nuclear material was layere d on 3.5 ml of buffered Nycodenz/ sucrose (10% sucrose, 8% Nycodenz, 1 mM EDTA, 100 μg/ml bovine serum albumin, and 0.01% Tween 20) and centrifuged at 7000 × g for 1 h. The pellet was washed with homogenization buffer and resuspended in buffer containing 2 mM Tris-HCl (pH 7.4), 50 mM mannitol, 1 mM PMSF, 0.5 μg/ml leupeptin, 0.1 μg/ml aprotinin, and 0.7 μg/ml pepstatin. The suspension was sonicated and centrifuged at 15,000 × g for 10 min. The lactate dehydrogenase activity was measured using an LDH assay kit from Promega using the manufacturer’s protocols.
Membrane fractionation
Membrane fractionation was carried out as described previously (Ge et al., 2013; Kumar et al., 2018). Briefly, HEK 293T cells (5 dishes per sample) were plated in 10 cm dishes, harvested, and homogenized by passing through a 22-G needle. Homogenates were subjected to sequential differential centrifugation at 3,000 × g (10 min) and 25,000 × g (20 min) to collect the pelleted membranes (TLA100.3 rotor, Beckman, polypropylene tubes; Beckman). 25K membrane pellets were suspended in 1 ml 19% OptiPrep for a step gradient containing 0.5 ml 22.5%, 1 ml 19% (sample), 0.9 ml 16%, 0.9 ml 12%, 1 ml 8%, 0.5 ml 5% and 0.2 ml 0% OptiPrep each. The OptiPrep gradient was centrifuged at 150,000 × g for 3 h. Subsequently eight fractions, 0.5 ml each, were collected from the top. Fractions were diluted with B88 buffer (20 mM Hepes, pH 7.2, 150 mM potassium acetate, 5 mM magnesium acetate, 250 mM sorbitol) and membranes were collected by centrifugation at 100,000 × g for 1 h. Sample were subjected to SDS-PAGE and western blot for Stx17, Stx17pS202, GM130 and LC3 was done as described under immunoblotting.
Immunoblotting and co-immunoprecipitation assays
Immunoblotting and co-immunoprecipitation (co-IP) were performed as described previously (Chauhan et al., 2016). Cells were lysed in NP40 buffer containing protease inhibitors cocktail (Roche, cat# 11697498001) and PMSF (Sigma, cat# 93482). Protein samples were boiled for 5 minutes at 100°C followed by separation on SDS-PAGE and transfer onto PVDF membranes. The PVDF membranes were subjected to western blot analysis. Blots were developed using an ECL detection method. Alternatively, the membranes were labelled with fluorescent secondary antibody and analyzed with a LICOR-Odyssey apparatus using IMAGE STUDIO Lite software. For co-IP, cells were transfected with 10 μg of plasmids, wherever stated, and lysed as stated above. 10% input was saved, and remaining lysates were mixed with 2–5 μg antibody and incubated at 4°C for 4 h followed by incubation with Dynabead s protein G (Life Technologies) for 2 h at 4°C. Beads were washed three times with PBS an d then boiled with SDS-PAGE buffer for analysis of interacting protein by immunoblotting. Blots were quantified using Image J software.
QUANTIFICATION AND STATISTICAL ANALYSIS
MS raw files data were analyzed with Proteome Discoverer (v.1.4.7) utilizing the SEQUEST search engine and with MASCOT (version 2.4.0, Matrix Science, London, UK). Trypsin was selected as enzyme for samples treated with the respective enzymes allowing one missed cleavage site. Tolerance of 10 ppm for the precursor ion in the first search and 0.05 Da for the MS/MS fragments was applied. In addition to methionine oxidation, acetylation at protein N-terminus was allowed as variable modifications. Cysteine carbamidomethylation was set as fixed modification. High confidence peptides set at FDR <0.01 and medium confidence peptide set at FDR <0.05. Quantitative analyses using spectral counting were performed with Scaffold (version, 4.4.0, Proteome Software Inc., Portland, OR, USA). Peptide identifications were accepted at greater than 95.0% probability and protein identifications were accepted at greater than 99.0% probability. Only proteins with >1 peptide identification were considered for quantitation.
Data are expressed as means ± SEM (n ≥ 3). Data were analyzed with a paired two-tailed Student’s t-test or analysis of variance (ANOVA) and multi-comparison analysis was performed with post hoc Tukey’s test. Statistical significance was defined as *P < 0.05, **p<0.01.
Data and Software Availability
The mass spectrometry data reported in this study have been deposited in MassIVE repository (https://massive.ucsd.edu) with the accession number for MSV000083251.
Supplementary Material
Table S1, Related to Figures 1 and S1. Mass spectrometry proteomic identification of GFP-Stx17 interactors (Tab1 and Tab 2) and mass spectrometric identification of S202 in Stx17 as phosphorylated by TBK1 (Tab 3).
KEY RESOURCES TABLE.
| REAGENT or RESOURCE | SOURCE | IDENTIFIER |
|---|---|---|
| Antibodies | ||
| Rabbit anti-ATG13 | Cell Signaling Technology | #13468 |
| Rabbit anti-TBK1 | Cell Signaling Technology | #3504 |
| Rabbit anti-ULK1 | Cell Signaling Technology | #6439 |
| Rabbit anti- TBK1PS172 | Cell Signaling Technology | #5483 |
| Rabbit anti-GABARAP | Cell Signaling Technology | #13733 |
| Rabbit anti-GABARAPL2 | Cell Signaling Technology | #14256 |
| Rabbit anti-LC3B | Cell Signaling Technology | #3868 |
| Rabbit anti-Stx17pS202 | This work | Rabbit No: BL31269 and prep PP1 |
| Rabbit anti- Atg1/ULK1 | Sigma Aldrich | A7481 |
| Rabbit anti-Stx17 | Sigma Aldrich | HPA001204 |
| Rabbit anti-GFP | Abcam | ab290 |
| Rabbit anti-GFP | Abcam | ab38689 |
| Rabbit anti-LC3 | MBL International | PM036 |
| Rabbit anti-FIP200 | Proteintech | 17250–1-AP |
| Mouse anti-GM130 | BD Biosciences | RUO-610822 |
| Mouse anti-ATG13 | Millipore | MABC46 |
| Mouse anti-FLAG | Sigma Aldrich | F1804 |
| Mouse anti-ERGIC53 | Santa Cruz Biotechnology | sc-365158 |
| Mouse anti- β actin | Santa Cruz Biotechnology | sc-47778 |
| Mouse anti-Myc | Santa Cruz Biotechnology | sc-40 |
| Goat anti mouse IRDye 680 | LI-COR | 925–68020 |
| Goat a Rabbit IRDye 800 | LI-COR | 926–32211 |
| Trueblot anti-mouse DyLight 680 | Rockland | 18-4516-32 |
| Trueblot anti-rabbit DyLight 800 | Rockland | 18-8816-31 |
| Alexa Fluor 488 secondary antibody | ThermoFisher | A-11029 |
| Alexa Fluor 568 secondary antibody | ThermoFisher | A-11036 |
| Bacterial and Virus Strains | ||
| NEB 5-alpha Competent E.coli (High Efficiency) | New England Biolabs | C2987 |
| One Shot Mach1 Phage-Resistant Competent E.coli | ThermoFisher | C862003 |
| SoluBL21 Competent E.coli | Genlantis | C700200 |
| LentiCRISPRv2 | GeneScript | N/A |
| Chemicals, Peptides, and Recombinant Proteins | ||
| LR Clonase II Plus Enzyme Mix | ThermoFisher | 11791100 |
| BP Clonase II Plus Enzyme Mix | ThermoFisher | 11789100 |
| Lambda Protein Phosphatase | NEW ENGLAND BioLabs Inc. | P0753S |
| Bafilomycin A1 | InvivoGen | tlrl-baf1 |
| 3-Methyladenine | Sigma | M9281 |
| mouse macrophage colony stimulating factor (mM-CSF) | Cell Signaling Technology | #5228 |
| OptiPrep Density Gradient Medium | Sigma | D1556 |
| Critical Commercial Assays | ||
| Gateway Vector Conversion System | ThermoFisher | 11828–029 |
| ProFection Mammalian Transfection System | Promega | E1200 |
| Amaxa Cell Line Nucleofector Kit R | Lonza | VCA-1001 |
| Lipofectamine 2000 | ThermoFisher | 11668019 |
| LDH Assay kit (CytoTox 96® Non-Radioactive Cytotoxicity Assay) | Promega | G1780 |
| GFP-TRAP | Chromotek | Gtm-20 |
| Deposited Data | ||
| Raw MS data | https://massive.ucsd.edu | MSV000083251 |
| Experimental Models: Cell Lines | ||
| HeLa | ATCC | CCL-2 |
| HEK-293T | ATCC | CRL-11268 |
| Bone marrow macrophages | From C57BL/6 Mouse femur | N/A |
| HeLa Stx17KO | This work | N/A |
| HeLa TBK1KO | This work | N/A |
| HeLa ATG13KO | This work | N/A |
| HeLa WT | (Nguyen et al., 2016) | N/A |
| HeLa LC3TKO | (Nguyen et al., 2016) | N/A |
| HeLa GABARAPTKO | (Nguyen et al., 2016) | N/A |
| HeLaHexaKO | (Nguyen et al., 2016) | N/A |
| 293T TBK1KO | This work | N/A |
| Experimental Models: Organisms/Strains | ||
| C57BL/6J mice | Jackson Laboratories | C57BL/6J |
| Oligonucleotides | ||
| Primers for Stx17 S202A sense: 5′GTTGACATGGTCTGCAATGGCGTCAATCTTCT CCTGCTGA-3′ | Integrated DNA Technologies | N/A |
| Primers for Stx17 S202A anti-sense: 5′TCAGCAGGAGAAGATTGACGCCATTGCAGAC CATGTCAAC-3′ | Integrated DNA Technologies | N/A |
| Primers for Stx17 S202D sense: 5′GTTGACATGGTCTGCAATGTCGTCAATCTTCT CCTGCTGA-3′ | Integrated DNA Technologies | N/A |
| Primers for Stx17 S202D anti-sense: 5′TCAGCAGGAGAAGATTGACGACATTGCAGAC CATGTCAAC-3′ | Integrated DNA Technologies | N/A |
| ATG13 CRISPR sgRNA: TCACCCTAGTTATAGCAAGA | Custom order (Harvard GEPG) | N/A |
| Stx17 CRISPR sgRNA: GATGAAGATCAACCTGGAAG | Custom order (Harvard GEPG) | N/A |
| TBK1 CRISPR sgRNA: GATAGTAATCCCAACAGACC | Custom order (Invitrogen) | N/A |
| Recombinant DNA | ||
| pDest-GFP-Stx17 | (Kumar et al., 2018) | N/A |
| pDest-GFP-Stx17S202A | This work | N/A |
| pDest-GFP-Stx17S202D | This work | N/A |
| pDest-FLAG-Stx17 | (Kumar et al., 2018) | N/A |
| pDest-FLAG-Stx17S202A | This work | N/A |
| pDest-FLAG-Stx17S202D | This work | N/A |
| pDest-Myc-TBK1 | (Pilli et al., 2012) | N/A |
| pDest-Myc-TBK1K38D | (Pilli et al., 2012) | N/A |
| pDest-mCherry-EGFP-LC3B | (Pankiv et al., 2007) | N/A |
| EGFP-WIPI2 | Tassula Proikas-Cezanne (Eberhard Karls University Tübingen, Tübingen, Germany) | N/A |
| GFP-ULK1 | N. Mizushima (The University of Tokyo, Tokyo, Japan) | N/A |
| pMXs-IP-EGFP-hFIP200 | Addgene | #38192 |
| pEGFP-DFCP1 | (Axe et al., 2008) | N/A |
| pDest-EGFP-LC3B | (Kirkin et al., 2009) | N/A |
| Keima-LC3 | (An and Harper, 2018) | N/A |
| LDH-Keima | (An and Harper, 2018) | N/A |
| Software and Algorithms | ||
| iDEV software | ThermoFisher | N/A |
| AIM software | Carl Zeiss | N/A |
| Scaffold software | Proteome Software Inc | N/A |
| Image Studio Software | LI-COR | N/A |
| Prism 6 | GraphPad | N/A |
| ImageJ | National Institute of Health, USA | N/A |
| Other | ||
| RIPA Lysis Buffer | ThermoFisher | 89900 |
| NP40 Cell Lysis Buffer | ThermoFisher | FNN0021 |
| Protease Inhibitor Cocktail Tablets | Roche | 11697498001 |
| PMSF | Sigma Aldrich | 93482 |
| Dynabeads Protein G | ThermoFisher | 10003D |
Highlights.
Syntaxin 17 functions during autophagy initiation and bulk cargo sequestration
TBK1 phosphorylates syntaxin 17 at Ser202 (Stx17pS202)
Stx17pS202 translocates from Golgi to pre-autophagosomal structure opon starvation
Stx17pS202 controls formation of FIP200-ATG13 preautophagosomal structures
Acknowledgments
We thank H. An and J.W. Harper for keima constructs and M. Lazarou for mAtg8 knockout cells. This work was supported by NIH grants R37AI042999 and R01AI042999 and center grant P20GM121176 to V.D., and by grant 249884 from the Research Council of Norway to T.J.
Footnotes
Declaration of Interest: Gary Kasof is employed by Cell Signaling Technology.
Publisher's Disclaimer: This is a PDF file of an unedited manuscript that has been accepted for publication. As a service to our customers we are providing this early version of the manuscript. The manuscript will undergo copyediting, typesetting, and review of the resulting proof before it is published in its final citable form. Please note that during the production process errors may be discovered which could affect the content, and all legal disclaimers that apply to the journal pertain.
REFERENCES
- Ahmad L, Zhang SY, Casanova JL, and Sancho-Shimizu V (2016). Human TBK1: A Gatekeeper of Neuroinflammation. Trends Mol Med 22, 511–527. [DOI] [PMC free article] [PubMed] [Google Scholar]
- Alers S, Wesselborg S, and Stork B (2014). ATG13: just a companion, or an executor of the autophagic program? Autophagy 10, 944–956. [DOI] [PMC free article] [PubMed] [Google Scholar]
- An H, and Harper JW (2018). Systematic analysis of ribophagy in human cells reveals bystander flux during selective autophagy. Nat Cell Biol 20, 135–143. [DOI] [PMC free article] [PubMed] [Google Scholar]
- Anonsen JH, Egge-Jacobsen W, Aas FE, Borud B, Koomey M, and Vik A (2012). Novel protein substrates of the phospho-form modification system in Neisseria gonorrhoeae and their connection to O-linked protein glycosylation. Infect Immun 80, 22–30. [DOI] [PMC free article] [PubMed] [Google Scholar]
- Arasaki K, Nagashima H, Kurosawa Y, Kimura H, Nishida N, Dohmae N, Yamamoto A, Yanagi S, Wakana Y, Inoue H, et al. (2018). MAP1B-LC1 prevents autophagosome formation by linking syntaxin 17 to microtubules. EMBO Rep. [DOI] [PMC free article] [PubMed] [Google Scholar]
- Arasaki K, Shimizu H, Mogari H, Nishida N, Hirota N, Furuno A, Kudo Y, Baba M, Baba N, Cheng J, et al. (2015). A role for the ancient SNARE syntaxin 17 in regulating mitochondrial division. Dev Cell 32, 304–317. [DOI] [PubMed] [Google Scholar]
- Axe EL, Walker SA, Manifava M, Chandra P, Roderick HL, Habermann A, Griffiths G, and Ktistakis NT (2008). Autophagosome formation from membrane compartments enriched in phosphatidylinositol 3-phosphate and dynamically connected to the endoplasmic reticulum. J Cell Biol 182, 685–701. [DOI] [PMC free article] [PubMed] [Google Scholar]
- Bas L, Papinski D, Licheva M, Torggler R, Rohringer S, Schuschnig M, and Kraft C (2018). Reconstitution reveals Ykt6 as the autophagosomal SNARE in autophagosome-vacuole fusion. J Cell Biol. [DOI] [PMC free article] [PubMed] [Google Scholar]
- Baskaran S, Carlson LA, Stjepanovic G, Young LN, Kim do J, Grob P, Stanley RE, Nogales E, and Hurley JH (2014). Architecture and dynamics of the autophagic phosphatidylinositol 3-kinase complex. Elife 3. [DOI] [PMC free article] [PubMed] [Google Scholar]
- Chan EY, Kir S, and Tooze SA (2007). siRNA screening of the kinome identifies ULK1 as a multidomain modulator of autophagy. J Biol Chem 282, 25464–25474. [DOI] [PubMed] [Google Scholar]
- Chauhan S, Kumar S, Jain A, Ponpuak M, Mudd MH, Kimura T, Choi SW, Peters R, Mandell M, Bruun JA, et al. (2016). TRIMs and Galectins Globally Cooperate and TRIM16 and Galectin-3 Co-direct Autophagy in Endomembrane Damage Homeostasis. Dev Cell 39, 13–27. [DOI] [PMC free article] [PubMed] [Google Scholar]
- Diao J, Liu R, Rong Y, Zhao M, Zhang J, Lai Y, Zhou Q, Wilz LM, Li J, Vivona S, et al. (2015). ATG14 promotes membrane tethering and fusion of autophagosomes to endolysosomes. Nature 520, 563–566. [DOI] [PMC free article] [PubMed] [Google Scholar]
- Dooley HC, Razi M, Polson HE, Girardin SE, Wilson MI, and Tooze SA (2014). WIPI2 Links LC3 Conjugation with PI3P, Autophagosome Formation, and Pathogen Clearance by Recruiting Atg12–5-16L1. Mol Cell 55, 238–252. [DOI] [PMC free article] [PubMed] [Google Scholar]
- Engedal N, and Seglen PO (2016). Autophagy of cytoplasmic bulk cargo does not require LC3. Autophagy 12, 439–441. [DOI] [PMC free article] [PubMed] [Google Scholar]
- Faeste CK, Jonscher KR, Dooper MM, Egge-Jacobsen W, Moen A, Daschner A, Egaas E, and Christians U (2014). Characterisation of potential novel allergens in the fish parasite Anisakis simplex. EuPA Open Proteom 4, 140–155. [DOI] [PMC free article] [PubMed] [Google Scholar]
- Faeste CK, Moen A, Schniedewind B, Haug Anonsen J, Klawitter J, and Christians U (2016). Development of liquid chromatography-tandem mass spectrometry methods for the quantitation of Anisakis simplex proteins in fish. J Chromatogr A 1432, 58–72. [DOI] [PubMed] [Google Scholar]
- Fregno I, Fasana E, Bergmann TJ, Raimondi A, Loi M, Solda T, Galli C, D’Antuono R, Morone D, Danieli A, et al. (2018). ER-to-lysosome-associated degradation of proteasomeresistant ATZ polymers occurs via receptor-mediated vesicular transport. EMBO J 37. [DOI] [PMC free article] [PubMed] [Google Scholar]
- Fujita N, Morita E, Itoh T, Tanaka A, Nakaoka M, Osada Y, Umemoto T, Saitoh T, Nakatogawa H, Kobayashi S, et al. (2013). Recruitment of the autophagic machinery to endosomes during infection is mediated by ubiquitin. J Cell Biol 203, 115–128. [DOI] [PMC free article] [PubMed] [Google Scholar]
- Gammoh N, Florey O, Overholtzer M, and Jiang X (2013). Interaction between FIP200 and ATG16L1 distinguishes ULK1 complex-dependent and -independent autophagy. Nat Struct Mol Biol 20, 144–149. [DOI] [PMC free article] [PubMed] [Google Scholar]
- Ganley IG, Lam du H, Wang J, Ding X, Chen S, and Jiang X (2009). ULK1.ATG13.FIP200 complex mediates mTOR signaling and is essential for autophagy. J Biol Chem 284, 12297–12305. [DOI] [PMC free article] [PubMed] [Google Scholar]
- Gao J, Reggiori F, and Ungermann C (2018). A novel in vitro assay reveals SNARE topology and the role of Ykt6 in autophagosome fusion with vacuoles. J Cell Biol. [DOI] [PMC free article] [PubMed] [Google Scholar]
- Ge L, Melville D, Zhang M, and Schekman R (2013). The ER-Golgi intermediate compartment is a key membrane source for the LC3 lipidation step of autophagosome biogenesis. Elife 2, e00947. [DOI] [PMC free article] [PubMed] [Google Scholar]
- Guo B, Liang Q, Li L, Hu Z, Wu F, Zhang P, Ma Y, Zhao B, Kovacs AL, Zhang Z, et al. (2014). O-GlcNAc-modification of SNAP-29 regulates autophagosome maturation. Nat Cell Biol 16, 1215–1226. [DOI] [PubMed] [Google Scholar]
- Hamasaki M, Furuta N, Matsuda A, Nezu A, Yamamoto A, Fujita N, Oomori H, Noda T, Haraguchi T, Hiraoka Y, et al. (2013). Autophagosomes form at ER-mitochondria contact sites. Nature 495, 389–393. [DOI] [PubMed] [Google Scholar]
- Hara T, Takamura A, Kishi C, Iemura S, Natsume T, Guan JL, and Mizushima N (2008). FIP200, a ULK-interacting protein, is required for autophagosome formation in mammalian cells. J Cell Biol 181, 497–510. [DOI] [PMC free article] [PubMed] [Google Scholar]
- Inoki K, Kim J, and Guan KL (2012). AMPK and mTOR in cellular energy homeostasis and drug targets. Annu Rev Pharmacol Toxicol 52, 381–400. [DOI] [PubMed] [Google Scholar]
- Itakura E, Kishi-Itakura C, and Mizushima N (2012). The hairpin-type tail-anchored SNARE syntaxin 17 targets to autophagosomes for fusion with endosomes/lysosomes. Cell 151, 12561269. [DOI] [PubMed] [Google Scholar]
- Jung CH, Jun CB, Ro SH, Kim YM, Otto NM, Cao J, Kundu M, and Kim DH (2009). ULK-Atg13-FIP200 complexes mediate mTOR signaling to the autophagy machinery. Mol Biol Cell 20, 1992–2003. [DOI] [PMC free article] [PubMed] [Google Scholar]
- Kabeya Y, Mizushima N, Ueno T, Yamamoto A, Kirisako T, Noda T, Kominami E, Ohsumi Y, and Yoshimori T (2000). LC3, a mammalian homologue of yeast Apg8p, is localized in autophagosome membranes after processing. Embo J 19, 5720–5728. [DOI] [PMC free article] [PubMed] [Google Scholar]
- Karanasios E, Stapleton E, Manifava M, Kaizuka T, Mizushima N, Walker SA, and Ktistakis NT (2013). Dynamic association of the ULK1 complex with omegasomes during autophagy induction. J Cell Sci 126, 5224–5238. [DOI] [PubMed] [Google Scholar]
- Karanasios E, Walker SA, Okkenhaug H, Manifava M, Hummel E, Zimmermann H, Ahmed Q, Domart MC, Collinson L, and Ktistakis NT (2016). Autophagy initiation by ULK complex assembly on ER tubulovesicular regions marked by ATG9 vesicles. Nature communications 7, 12420. [DOI] [PMC free article] [PubMed] [Google Scholar]
- Katayama H, Kogure T, Mizushima N, Yoshimori T, and Miyawaki A (2011). A sensitive and quantitative technique for detecting autophagic events based on lysosomal delivery. Chem Biol 18, 1042–1052. [DOI] [PubMed] [Google Scholar]
- Kirkin V, Lamark T, Sou YS, Bjorkoy G, Nunn JL, Bruun JA, Shvets E, McEwan DG, Clausen TH, Wild P, et al. (2009). A role for NBR1 in autophagosomal degradation of ubiquitinated substrates. Mol Cell 33, 505–516. [DOI] [PubMed] [Google Scholar]
- Kopitz J, Kisen GO, Gordon PB, Bohley P, and Seglen PO (1990). Nonselective autophagy of cytosolic enzymes by isolated rat hepatocytes. J Cell Biol 111, 941–953. [DOI] [PMC free article] [PubMed] [Google Scholar]
- Koyama-Honda I, Itakura E, Fujiwara TK, and Mizushima N (2013). Temporal analysis of recruitment of mammalian ATG proteins to the autophagosome formation site. Autophagy 9, 1491–1499. [DOI] [PubMed] [Google Scholar]
- Kumar S, Jain A, Farzam F, Jia J, Gu Y, Choi SW, Mudd MH, Claude-Taupin A, Wester MJ, Lidke KA, et al. (2018). Mechanism of Stx17 recruitment to autophagosomes via IRGM and mammalian Atg8 proteins. J Cell Biol 217, 997–1013. [DOI] [PMC free article] [PubMed] [Google Scholar]
- Lamb CA, Nuhlen S, Judith D, Frith D, Snijders AP, Behrends C, and Tooze SA (2016). TBC1D14 regulates autophagy via the TRAPP complex and ATG9 traffic. EMBO J 35, 281–301. [DOI] [PMC free article] [PubMed] [Google Scholar]
- Lamb CA, Yoshimori T, and Tooze SA (2013). The autophagosome: origins unknown, biogenesis complex. Nat Rev Mol Cell Biol 14, 759–774. [DOI] [PubMed] [Google Scholar]
- Liu S, Cai X, Wu J, Cong Q, Chen X, Li T, Du F, Ren J, Wu YT, Grishin NV, et al. (2015). Phosphorylation of innate immune adaptor proteins MAVS, STING, and TRIF induces IRF3 activation. Science 347, aaa2630. [DOI] [PubMed] [Google Scholar]
- Mandell MA, Jain A, Arko-Mensah J, Chauhan S, Kimura T, Dinkins C, Silvestri G, Munch J, Kirchhoff F, Simonsen A, et al. (2014). TRIM proteins regulate autophagy and can target autophagic substrates by direct recognition. Dev Cell 30, 394–409. [DOI] [PMC free article] [PubMed] [Google Scholar]
- Matsui T, Jiang P, Nakano S, Sakamaki Y, Yamamoto H, and Mizushima N (2018). Autophagosomal YKT6 is required for fusion with lysosomes independently of syntaxin 17. J Cell Biol 217, 2633–2645. [DOI] [PMC free article] [PubMed] [Google Scholar]
- McLelland GL, Lee SA, McBride HM, and Fon EA (2016). Syntaxin-17 delivers PINK1/parkin-dependent mitochondrial vesicles to the endolysosomal system. J Cell Biol 214, 275–291. [DOI] [PMC free article] [PubMed] [Google Scholar]
- Mizushima N, Yoshimori T, and Ohsumi Y (2011). The role of Atg proteins in autophagosome formation. Annu Rev Cell Dev Biol 27, 107–132. [DOI] [PubMed] [Google Scholar]
- Moreau K, Ravikumar B, Renna M, Puri C, and Rubinsztein DC (2011). Autophagosome precursor maturation requires homotypic fusion. Cell 146, 303–317. [DOI] [PMC free article] [PubMed] [Google Scholar]
- Nguyen TN, Padman BS, Usher J, Oorschot V, Ramm G, and Lazarou M (2016). Atg8 family LC3/GABARAP proteins are crucial for autophagosome-lysosome fusion but not autophagosome formation during PINK1/Parkin mitophagy and starvation. J Cell Biol 215, 857–874. [DOI] [PMC free article] [PubMed] [Google Scholar]
- Nishimura T, Tamura N, Kono N, Shimanaka Y, Arai H, Yamamoto H, and Mizushima N (2017). Autophagosome formation is initiated at phosphatidylinositol synthase-enriched ER subdomains. EMBO J 36, 1719–1735. [DOI] [PMC free article] [PubMed] [Google Scholar]
- Pankiv S, Clausen TH, Lamark T, Brech A, Bruun JA, Outzen H, Overvatn A, Bjorkoy G, and Johansen T (2007). p62/SQSTM1 binds directly to Atg8/LC3 to facilitate degradation of ubiquitinated protein aggregates by autophagy. J Biol Chem 282, 24131–24145. [DOI] [PubMed] [Google Scholar]
- Park JM, Jung CH, Seo M, Otto NM, Grunwald D, Kim KH, Moriarity B, Kim YM, Starker C, Nho RS, et al. (2016). The ULK1 complex mediates MTORC1 signaling to the autophagy initiation machinery via binding and phosphorylating ATG14. Autophagy 12, 547–564. [DOI] [PMC free article] [PubMed] [Google Scholar]
- Pattingre S, Bauvy C, and Codogno P (2003). Amino acids interfere with the ERK1/2-dependent control of macroautophagy by controlling the activation of Raf-1 in human colon cancer HT-29 cells. J Biol Chem 278, 16667–16674. [DOI] [PubMed] [Google Scholar]
- Petiot A, Ogier-Denis E, Blommaart EF, Meijer AJ, and Codogno P (2000). Distinct classes of phosphatidylinositol 3’-kinases are involved in signaling pathways that control macroautophagy in HT-29 cells. J Biol Chem 275, 992–998. [DOI] [PubMed] [Google Scholar]
- Pilli M, Arko-Mensah J, Ponpuak M, Roberts E, Master S, Mandell MA, Dupont N, Ornatowski W, Jiang S, Bradfute SB, et al. (2012). TBK-1 Promotes Autophagy-Mediated Antimicrobial Defense by Controlling Autophagosome Maturation. Immunity 37, 223–234. [DOI] [PMC free article] [PubMed] [Google Scholar]
- Popoff V, Adolf F, Brugger B, and Wieland F (2011). COPI budding within the Golgi stack. Cold Spring Harb Perspect Biol 3, a005231. [DOI] [PMC free article] [PubMed] [Google Scholar]
- Saitoh T, Fujita N, Hayashi T, Takahara K, Satoh T, Lee H, Matsunaga K, Kageyama S, Omori H, Noda T, et al. (2009). Atg9a controls dsDNA-driven dynamic translocation of STING and the innate immune response. Proc Natl Acad Sci U S A 106, 20842–20846. [DOI] [PMC free article] [PubMed] [Google Scholar]
- Seglen PO, and Gordon PB (1984). Amino acid control of autophagic sequestration and protein degradation in isolated rat hepatocytes. J Cell Biol 99, 435–444. [DOI] [PMC free article] [PubMed] [Google Scholar]
- Seglen PO, Luhr M, Mills IG, Saetre F, Szalai P, and Engedal N (2015). Macroautophagic cargo sequestration assays. Methods 75, 25–36. [DOI] [PubMed] [Google Scholar]
- Shevchenko A, Wilm M, Vorm O, and Mann M (1996). Mass spectrometric sequencing of proteins silver-stained polyacrylamide gels. Analytical chemistry 68, 850–858. [DOI] [PubMed] [Google Scholar]
- Soreng K, Munson MJ, Lamb CA, Bjorndal GT, Pankiv S, Carlsson SR, Tooze SA, and Simonsen A (2018). SNX18 regulates ATG9A trafficking from recycling endosomes by recruiting Dynamin-2. EMBO Rep. [DOI] [PMC free article] [PubMed] [Google Scholar]
- Steegmaier M, Oorschot V, Klumperman J, and Scheller RH (2000). Syntaxin 17 is abundant in steroidogenic cells and implicated in smooth endoplasmic reticulum membrane dynamics. Mol Biol Cell 11, 2719–2731. [DOI] [PMC free article] [PubMed] [Google Scholar]
- Steegmaier M, Yang B, Yoo JS, Huang B, Shen M, Yu S, Luo Y, and Scheller RH (1998). Three novel proteins of the syntaxin/SNAP-25 family. J Biol Chem 273, 34171–34179. [DOI] [PubMed] [Google Scholar]
- Suzuki H, Kaizuka T, Mizushima N, and Noda NN (2015). Structure of the Atg101-Atg13 complex reveals essential roles of Atg101 in autophagy initiation. Nat Struct Mol Biol 22, 572–580. [DOI] [PubMed] [Google Scholar]
- Szalai P, Hagen LK, Saetre F, Luhr M, Sponheim M, Overbye A, Mills IG, Seglen PO, and Engedal N (2015). Autophagic bulk sequestration of cytosolic cargo is independent of LC3, but requires GABARAPs. Exp Cell Res 333, 21–38. [DOI] [PubMed] [Google Scholar]
- Takats S, Glatz G, Szenci G, Boda A, Horvath GV, Hegedus K, Kovacs AL, and Juhasz G (2018). Non-canonical role of the SNARE protein Ykt6 in autophagosome-lysosome fusion. PLoS Genet 14, e1007359. [DOI] [PMC free article] [PubMed] [Google Scholar]
- Takats S, Nagy P, Varga A, Pircs K, Karpati M, Varga K, Kovacs AL, Hegedus K, and Juhasz G (2013). Autophagosomal Syntaxin17-dependent lysosomal degradation maintains neuronal function in Drosophila. J Cell Biol 201, 531–539. [DOI] [PMC free article] [PubMed] [Google Scholar]
- Thurston TL, Ryzhakov G, Bloor S, von Muhlinen N, and Randow F (2009). The TBK1 adaptor and autophagy receptor NDP52 restricts the proliferation of ubiquitin-coated bacteria. Nat Immunol 10, 1215–1221. [DOI] [PubMed] [Google Scholar]
- Wang Z, Miao G, Xue X, Guo X, Yuan C, Wang Z, Zhang G, Chen Y, Feng D, Hu J, et al. (2016). The Vici Syndrome Protein EPG5 Is a Rab7 Effector that Determines the Fusion Specificity of Autophagosomes with Late Endosomes/Lysosomes. Mol Cell 63, 781–795. [DOI] [PubMed] [Google Scholar]
- Wild P, Farhan H, McEwan DG, Wagner S, Rogov VV, Brady NR, Richter B, Korac J, Waidmann O, Choudhary C, et al. (2011). Phosphorylation of the autophagy receptor optineurin restricts Salmonella growth. Science 333, 228–233. [DOI] [PMC free article] [PubMed] [Google Scholar]
- Young AR, Chan EY, Hu XW, Kochl R, Crawshaw SG, High S, Hailey DW, LippincottSchwartz J, and Tooze SA (2006). Starvation and ULK1-dependent cycling of mammalian Atg9 between the TGN and endosomes. J Cell Sci 119, 3888–3900. [DOI] [PubMed] [Google Scholar]
Associated Data
This section collects any data citations, data availability statements, or supplementary materials included in this article.
Supplementary Materials
Table S1, Related to Figures 1 and S1. Mass spectrometry proteomic identification of GFP-Stx17 interactors (Tab1 and Tab 2) and mass spectrometric identification of S202 in Stx17 as phosphorylated by TBK1 (Tab 3).
Data Availability Statement
The mass spectrometry data reported in this study have been deposited in MassIVE repository (https://massive.ucsd.edu) with the accession number for MSV000083251.