

Abstract
Glucagon-like peptide 1 receptors (GLP-1Rs) have been found in the brain, but whether GLP-1R agonists (GLP-1RAs) influence brain glucose metabolism is currently unknown. The study aim was to evaluate the effects of a single injection of the GLP-1RA exenatide on cerebral and peripheral glucose metabolism in response to a glucose load. In 15 male subjects with HbA1c of 5.7 ± 0.1%, fasting glucose of 114 ± 3 mg/dL, and 2-h glucose of 177 ± 11 mg/dL, exenatide (5 μg) or placebo was injected in double-blind, randomized fashion subcutaneously 30 min before an oral glucose tolerance test (OGTT). The cerebral glucose metabolic rate (CMRglu) was measured by positron emission tomography after an injection of [18F]2-fluoro-2-deoxy-d-glucose before the OGTT, and the rate of glucose absorption (RaO) and disposal was assessed using stable isotope tracers. Exenatide reduced RaO0–60 min (4.6 ± 1.4 vs. 13.1 ± 1.7 μmol/min ⋅ kg) and decreased the rise in mean glucose0–60 min (107 ± 6 vs. 138 ± 8 mg/dL) and insulin0–60 min (17.3 ± 3.1 vs. 24.7 ± 3.8 mU/L). Exenatide increased CMRglu in areas of the brain related to glucose homeostasis, appetite, and food reward, despite lower plasma insulin concentrations, but reduced glucose uptake in the hypothalamus. Decreased RaO0–60 min after exenatide was inversely correlated to CMRglu. In conclusion, these results demonstrate, for the first time in man, a major effect of a GLP-1RA on regulation of brain glucose metabolism in the absorptive state.
Introduction
Increasing experimental and clinical evidence suggests that brain glucose metabolism is altered in patients with type 2 diabetes mellitus (T2DM) and contributes to the disturbance in whole-body glucose homeostasis (1,2).
The brain receives multiple inputs including 1) hormones, such as leptin, ghrelin, peptide YY (PYY), glucagon like peptide-1 (GLP-1), and insulin, 2) nutrient-related signals that regulate fat accumulation in adipose tissue and hepatic and peripheral glucose metabolism, and 3) signals from the gastrointestinal tract through sensory nerves (1,2).
GLP-1 receptors (GLP-1Rs) have been found in several brain areas (3). Intestinal cells secrete GLP-1 in response to glucose, and deficiency of and resistance to GLP-1 have both been described in patients with T2DM (4,5). The main actions of GLP-1 are to stimulate insulin and inhibit glucagon secretion, although other pleiotropic effects of GLP-1 have been described (2,5). Secreted GLP-1 can gain access to the central nervous system (CNS), bind to GLP-1Rs, and modulate neuronal activity in different areas of human brain (3,6). After administration of radiolabeled GLP-1, nonsaturable uptake has been demonstrated in the CNS (6). We have shown that native GLP-1, secreted in response to a meal, potentiates insulin secretion and glucose sensing (7) and inhibits hepatic glucose production without altering peripheral glucose disposal (8).
Although GLP-1 and some GLP-1R agonists (GLP-1RAs) can cross the blood-brain barrier (9,10), their effects on the CNS are poorly understood. Exenatide (EX), a GLP-1RA, readily crosses the blood brain barrier, even more efficiently than native GLP-1 (10). Liraglutide and lixisenatide both accumulate in mouse brain and increase functional hypothalamic connectivity in brain areas involved in glucose homeostasis (11). Most previously published studies were performed under fasting conditions or during intravenous glucose and/or insulin administration and not after a meal or glucose ingestion, which represents the normal physiologic route. In the current study, we used positron emission tomography (PET) and stable isotope tracers to measure glucose fluxes to examine whether subcutaneous EX injection stimulates cerebral, as well as peripheral, glucose metabolism in patients with prediabetes/newly discovered diabetes.
Research Design and Methods
Subjects
Fifteen male subjects with HbA1c 5.7–6.4%, fasting plasma glucose (FPG) 100–125 mg/dL, and 2-h plasma glucose (2h-PG) during an oral glucose tolerance test (OGTT) >140 mg/dL were included in this randomized, double-blind, placebo-controlled trial. The protocol was approved by the University of Texas Health Science Center Institutional Review Board, and informed written consent was obtained from all subjects before participation.
The primary aim was to examine the acute effect of EX on brain glucose metabolism after a glucose load. The relation between brain glucose metabolism and postprandial peripheral and hepatic glucose metabolism was the secondary aim.
Study Protocol
The study design, represented in Fig. 1, is a randomized, double-blinded, placebo-controlled crossover study. After screening, subjects underwent two PET scans during a double-tracer 75-g OGTT, as previously described (7). Before the double-tracer OGTT, subjects received a subcutaneous injection of EX (5 μg) or PLC in random order. The two OGTTs were completed within 26 days.
Figure 1.

Protocol of the study: each subject underwent two studies, one with EX and one with PLC (in double-blind order). In each session, tracer infusion and a 75-g OGTT were performed.
A primed-constant infusion of [6,6-2H2]glucose was started at t = −120 min and continued throughout the study to measure the total rate of glucose appearance (RaT), rate of glucose disposal (Rd), and glucose clearance (Cglu) (Fig. 1). At t = −30 min, EX (5 μg) or PLC (Amylin Pharmaceuticals, San Diego, CA) was injected, and the subject was positioned in the PET scanner. At t = 0, subjects received an intravenous injection of 185 ± 37 mBq (5 mCi) of [18F]2-fluoro-2-deoxy-d-glucose (18F-FDG) over 15 s while laying supine, and PET scanning was started. Simultaneously with 18F-FDG, subjects drank 75 g glucose containing 1.5 g U-13C6-glucose in 5 min (Fig. 1) to measure endogenous glucose production (EGP). Arterialized venous samples were drawn for determination of plasma 18F-FDG radioactivity and glucose concentrations at −10, 0, 5, 10, 15, 30, 45, 60, 65, 70, 75, 80, 85, 90, 105, and 120 min. Plasma insulin and tracer enrichments were measured every 15 min, as previously described (7). Urine was collected at the end of the OGTT, and urine volume, 18F-FDG radioactivity, and glucose concentrations were measured.
PET
At t = 0 min, a dynamic scan of the heart was performed (34 frames: 12 × 120, 6 × 180, 5 × 300, 4 × 600, 6 × 1,800, 1 × 600 s). At t = 60 min, a two-dimensional dynamic brain scan was performed (6 frames of 300 s each), followed by a 10-min static three-dimensional scan using a 63-slice Siemens/CTI HR+ scanner. Regions of interest (ROI) were drawn in the left ventricular heart chamber for radioactivity measurement in arterial blood and in cortical and subcortical gray-matter regions of the brain. In addition, two main ROIs were defined to pool brain regions/nuclei involved in specific and similar brain functions: 1) glucose homeostasis regulation areas consisting of the nucleus of solitary tract, brainstem, insula, putamen, caudate, amygdala, limbic system, and hypothalamus, and 2) food reward system consisting of the orbitofrontal lobe, thalamus, anterior and posterior cingulate, putamen, caudate, amygdala, and limbic system.
Imaging and Data Analysis
Cerebral glucose metabolic rate (CMRglu) was calculated from the slope Ki of the linear phase of a Gjedde-Patlak plot. To account for 18F-FDG/substrate competition, we used a model based on the integral of plasma specific activity, SA(t), rather than of the plasma 18F-FDG concentration:
 |
where Ct and Cp are tissue and plasma radioactivity levels at time (t) SA(t) = Cp(t)/G(t), and Ki represents the uptake rate expressed in change unit as μmol/(mL⋅min) (see the Supplementary Data for details). CMRglu is calculated as Ki divided by appropriate lumped constant (0.81).
RaT, Rd, and Clglu were calculated from [6,6-2H2]glucose kinetics, and the rate of oral glucose absorption (RaO) was calculated from U-13C-glucose kinetics using non–steady state modeling, as previously described (7).
Data are expressed as mean ± SE. Comparison between study variables was performed using parametric or nonparametric tests (e.g., paired t test or Wilcoxon test) for variables normally or nonnormally distributed, respectively. Nonnormally distributed variables were log-transformed (natural logarithm) before correlation analysis.
Results
Subject Characteristics
We studied 15 male subjects age 57 ± 2 years, with BMI 29.4 ± 0.9 kg/m2, FPG 114 ± 3 mg/dL, and 2-h PG 177 ± 11 mg/dL. The group included 10 with impaired fasting glucose/impaired glucose tolerance (IGT), 2 with IGT, and 3 with newly discovered T2DM during the screening OGTT. At screening, HbA1c was 5.5 ± 0.1 in IGT and 5.7 ± 0.2% in T2DM (P = 0.45), and fasting plasma insulin (FPI) was 10.4 ± 1.4 mU/L.
Effect of EX on Peripheral Glucose Metabolism
EX did not affect FPG or FPI. At t = 0 (i.e., 30 min after EX or PLC), FPG was 105 ± 8 and 105 ± 3 mg/dL, respectively, and FPI was 8.2 ± 1.4 and 7.0 ± 1.3 mU/L, respectively.
During the 2-h OGTT, the plasma glucose concentration remained close to the fasting level after EX, but rose progressively to ∼200 mg/dL after PLC. In both EX and PLC, plasma insulin levels increased, reaching a plateau between 60 and 120 min, with an approximately twofold greater rise in PLC versus EX. The lower rise in plasma glucose after EX was explained by a significant delay/reduction in postprandial RaO0–120 [5.5 ± 1.4 vs. 15.4 ± 1.2 μmol/(kg⋅min)]. Cglu0–120 was similar in EX and PLC studies [1.8 ± 0.1 vs. 1.7 ± 0.1 mL/(kg⋅min)].
Effect of EX on Brain Glucose Metabolism
CMRglu during OGTT, quantitated by 18F-FDG–PET, was significantly increased in EX versus PLC in total gray matter, total cortex, and collectively in the brain areas involved in glucose homeostasis regulation (frontal, occipital, temporal, parietal lobes, limbic system, insula, and putamen) and in the food reward system (orbitofrontal lobe, thalamus, and anterior and posterior cingulate) (Fig. 2). In contrast, CMRglu decreased significantly in the hypothalamus after EX (Fig. 2).
Figure 2.
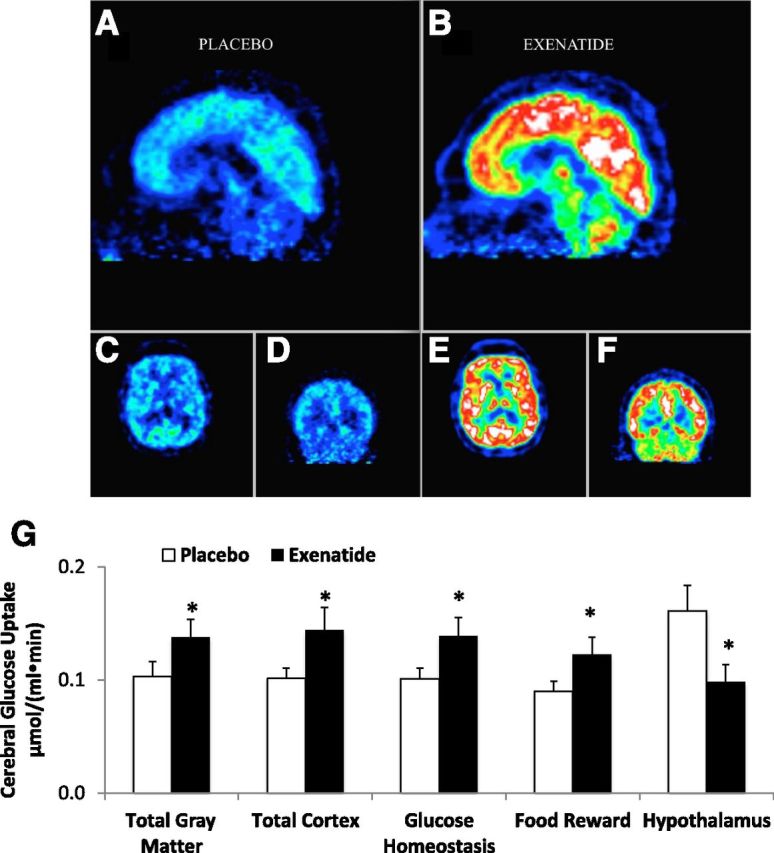
Image of 18F-FDG brain glucose uptake during PLC (A, C, and D) and EX (B, E, and F) in one study subject. G: Mean cerebral glucose uptake after oral glucose load (OGTT) was increased after EX compared with PLC in total gray matter, cortex, and areas involved in glucose homeostasis and food reward, but not in the hypothalamus, where glucose uptake was reduced. *P < 0.05.
Correlations Between Brain and Peripheral Glucose Metabolism
Glucose RaO and RaT correlated strongly and negatively with brain areas involved in glucose homeostasis regulation (r = −0.80 and r = −0.76, P < 0.0005, respectively) and food reward system (r = −0.75 and r = −0.75, P < 0.0008, respectively) after EX but not after PLC (Fig. 3 and Table 1). This negative correlation was most pronounced in the insula; thalamus; limbic system; orbitofrontal, occipital, parietal, and temporal lobe; anterior and posterior cingulate; and nucleus of the solitary tract (all r > 0.60, P < 0.01) (Table 1); no significant correlations were observed with other areas or after PLC and no correlation was observed between CMRglu and EGP, Rd, or Cglu.
Figure 3.
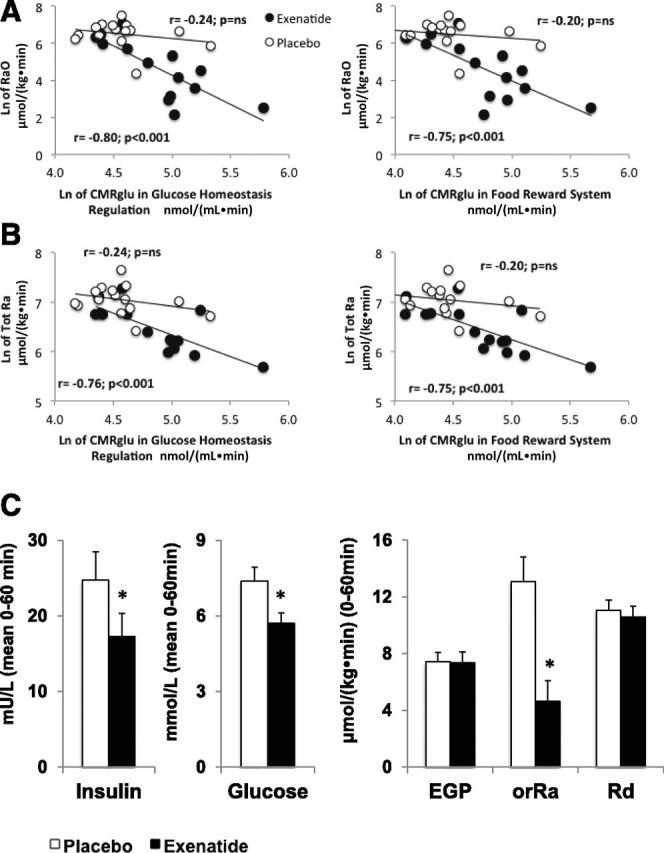
Correlation between RaO (A) or systemic glucose Ra (B) and CMRglu in brain regions associated with glucose homeostasis (left panels) or food reward (right panels). Data were log-transformed before analysis. C: Mean insulin and glucose concentrations (left panels) and mean glucose fluxes (i.e., RaO, EGP, and Rd) (right panels) during the first hour of the OGTT. *P < 0.05.
Table 1.
Correlations between CMRglu and RaO or RaT in different brain areas
| Brain area | CMRglu [μmol/(mL⋅min)] |
|||||||
|---|---|---|---|---|---|---|---|---|
| PLC and RaO |
EX and RaO |
PLC and RaT |
EX and RaT |
|||||
| r | P | r | P | r | P | r | P | |
| Total gray matter | –0.22 | 0.46 | –0.77 | 0.0005 | –0.33 | 0.25 | –0.78 | 0.0003 |
| Cortex | –0.19 | 0.53 | –0.44 | 0.10 | –0.37 | 0.19 | –0.54 | 0.035 |
| Glucose homeostasis | –0.23 | 0.46 | –0.80 | 0.0001 | –0.28 | 0.36 | –0.76 | 0.0005 |
| Reward system | –0.18 | 0.56 | –0.75 | 0.0008 | –0.22 | 0.48 | –0.75 | 0.0007 |
| Solitary nucleus | –0.17 | 0.59 | –0.67 | 0.0075 | –0.19 | 0.54 | –0.65 | 0.010 |
| Brainstem | –0.09 | 0.76 | –0.31 | 0.27 | –0.25 | 0.40 | –0.44 | 0.10 |
| Insula | –0.40 | 0.18 | –0.66 | 0.006 | –0.31 | 0.32 | –0.65 | 0.008 |
| Putamen | –0.15 | 0.62 | –0.43 | 0.11 | –0.12 | 0.69 | –0.50 | 0.055 |
| Caudate | –0.33 | 0.26 | –0.30 | 0.28 | –0.51 | 0.06 | –0.37 | 0.18 |
| Amygdala | –0.10 | 0.75 | –0.32 | 0.25 | –0.07 | 0.81 | –0.23 | 0.41 |
| Limbic system | –0.12 | 0.71 | –0.78 | 0.0003 | –0.08 | 0.80 | –0.70 | 0.002 |
| Hypothalamus | –0.38 | 0.19 | –0.19 | 0.50 | –0.48 | 0.08 | –0.36 | 0.19 |
| Thalamus | –0.19 | 0.52 | –0.70 | 0.002 | –0.07 | 0.80 | –0.65 | 0.007 |
| Anterior cingulate | –0.21 | 0.51 | –0.69 | 0.003 | –0.36 | 0.24 | –0.65 | 0.007 |
| Posterior cingulate | –0.03 | 0.93 | –0.77 | 0.0004 | –0.04 | 0.91 | –0.75 | 0.0007 |
| Orbitofrontal lobe | –0.21 | 0.49 | –0.75 | 0.0008 | –0.25 | 0.40 | –0.78 | 0.0003 |
| Occipital lobe | –0.30 | 0.31 | –0.66 | 0.006 | –0.47 | 0.09 | –0.70 | 0.0026 |
| Parietal lobe | –0.28 | 0.35 | –0.61 | 0.015 | –0.27 | 0.36 | –0.65 | 0.008 |
| Temporal lobe | –0.21 | 0.47 | –0.80 | 0.0002 | –0.22 | 0.45 | –0.76 | 0.0005 |
Data were log-transformed before analysis. Bold type indicates statistical significance.
Discussion
The present results demonstrate for the first time that, after glucose ingestion, EX has profound effects on brain glucose metabolism in male subjects with mild postprandial hyperglycemia. Compared with PLC, EX stimulated CMRglu in brain areas involved in regulation of glucose homeostasis and associated with reward system/satiety/food intake, including the orbitofrontal lobe, thalamus, insula, posterior cingulate, putamen, and limbic system, after a glucose load.
In contrast to previous studies that infused GLP-1 during pancreatic euglycemic (12) and hyperglycemic clamps (13), our study evaluated the effect of GLP-1 under physiologic conditions by combining 18F-FDG with stable isotope tracer infusion during OGTT and quantitated CMRglu, RaO, and RaT. We found that RaO and RaT were inversely correlated with CMRglu but only after EX and not after PLC. These findings could explain the appetite-suppressant effect of GLP-1RAs.
A recent report in mice generated with neuronal/visceral nerve-specific deletion of GLP-1R showed that the CNS but not peripheral nervous system GLP1-Rs are necessary for weight loss and anorexigenic effect of liraglutide, whereas the glucose-lowering effects were independent of CNS activation (14). The results are in agreement with ours, because we found a correlation between CMRglu and delayed oral glucose appearance but no correlation with suppression of EGP or peripheral glucose clearance.
Our study is the first in humans to show that EX injection, before an oral glucose load, increases glucose uptake in cerebral tissues involved in regulating peripheral glucose metabolism and food intake, despite reduced insulin concentrations compared with PLC. The protocol reflects the effect of normal route of subcutaneous EX administration on the normal route of glucose administration (oral). Previous studies used intravenous infusion of glucose, GLP-1, and somatostatin, and found a trend to decrease in CMRglu during normoglycemia (12) and an increase in CMRglu during hyperglycemia (13). However, in the Gejl et al. (13) study, insulin concentrations were three times those observed during PLC, and thus a separate effect of insulin could not be excluded. It is likely that increased brain glucose uptake might result after a long-acting GLP-1RA, given the higher insulin response after a meal.
Of note, we observed a significant decrease in CMRglu in the hypothalamus. Similarly, a previous study demonstrated that GLP-1 infusion under euglycemic conditions reduced CMRglu in the hypothalamus and brainstem (3). We previously demonstrated, using functional MRI, that glucose ingestion was associated with a rapid inhibition of MRI signal in several hypothalamic nuclei before any changes in plasma glucose concentration occurred (15). Therefore, we hypothesize that EX, in the absence of a change in the plasma glucose concentration, suppresses CMRglu in hypothalamic neurons through GLP-1R activation and glucokinase inhibition, as previously suggested (3,16). Hypothalamic neurons have been shown to act as glucose sensors of extracellular glucose concentration and to modulate their firing activity accordingly (16,17). Further, reduced glucokinase activity in the arcuate nucleus of mouse hypothalamus is associated with reduced food intake (18). This could represent an important mechanism via which GLP-1RAs modulate appetite.
Our study has several potential limitations. First, during glucose ingestion, it is difficult to selectively clamp insulin and/or glucose concentrations and thus evaluate the separate contributions. Insulin crosses the blood-brain barrier via the saturable transport system (19). Some studies in subjects with normal glucose tolerance have failed to show any effect of insulin on brain glucose metabolism (20), whereas other studies have demonstrated that insulin increases CMRglu (21). However, in our study, the rise in plasma insulin and glucose concentrations after EX was reduced compared with PLC, making this an unlikely explanation for the increase in CMRglu. Instead, the observed EX effect may have even been underestimated and group differences may have been further amplified if insulin and glucose levels had been as elevated in EX as they were in PLC studies. Second, 3 of the 15 subjects were found to have diabetes (mean ± SD 2h-PG = 230 ± 4 mg/dL) during the OGTT. However, the effect of EX on brain glucose metabolism was similar whether or not these 3 subjects were included. Third, our study included only men. Fourth, brain imaging was initiated at t = 60 min, so we could examine only mean brain glucose uptake and not the time course of the effect of EX.
In conclusion, our results demonstrate that, after glucose ingestion, EX exerts a profound effect on glucose metabolism in multiple brain areas involved in the regulation of glucose homeostasis and the reward system. Further studies are warranted to investigate whether similar results will be observed in subjects with T2DM and obese subjects without diabetes after acute and chronic GLP-1RA administration.
Supplementary Material
Article Information
Acknowledgments. The authors thank all of the volunteers and staff that participated and helped in this study and, in particular, Sandra Martinez, John Kincade, Betty Heyl, Paul Jerabeck, John Adams, Lorrie Albarado, Monica Palomo, and Teresa Grable (all at the University of Texas Health Science Center, San Antonio, TX).
Funding. This study was supported by an investigator-initiated and unrestricted research grant from Amylin Pharmaceuticals, Bristol-Myers Squibb, and AstraZeneca. The salary for R.D. was partly provided by the South Texas Veterans Administration-Audie Murphy Division. A.G., the primary investigator, received funds from Consiglio Nazionale delle Ricerche (CNR Ageing Project). Amylin, Bristol-Myers Squibb, and AstraZeneca played no role in the study design, data collection/analysis, or manuscript preparation/review.
Duality of Interest. E.C. has received compensation for a speaking engagement for Takeda and Janssen. C.T. has served on the speaker's bureau for AstraZeneca. R.D. has served on the advisory board for Amylin, Takeda, Bristol-Myers Squibb, AstraZeneca, Novo Nordisk, Janssen, Lexicon, and Boehringer Ingelheim; has received research support from Amylin, Bristol-Myers Squibb, Boehringer Ingelheim, and Takeda; and has served on the speaker's bureau for Novo Nordisk, Bristol-Myers Squibb, AstraZeneca, and Janssen. A.G. has received research support from Amylin, Bristol-Myers Squibb, and AstraZeneca and has served as a consultant for Hoffmann-La Roche Ltd. and Eli Lilly and Company. No other potential conflicts of interest relevant to this article were reported.
Author Contributions. G.D., M.M.-C., and C.T. performed the studies. G.D., P.I., J.L., D.C., P.F., and A.G. analyzed data. G.D., P.I., E.C., D.T., C.T., P.F., N.M., R.D., and A.G. contributed to discussion. G.D., P.I., R.D., and A.G. wrote the manuscript. A.G. designed the study. All authors reviewed the manuscript before submission. A.G. is the guarantor of this work and, as such, had full access to all the data in the study and takes responsibility for the integrity of the data and the accuracy of the data analysis.
Prior Presentation. Parts of this study were presented in abstract form at the 74th Scientific Sessions of the American Diabetes Association, San Francisco, CA, 13–17 June 2014.
Footnotes
Clinical trial reg. no. NCT01588418, clinicaltrials.gov.
This article contains Supplementary Data online at http://diabetes.diabetesjournals.org/lookup/suppl/doi:10.2337/db14-1718/-/DC1.
References
- 1.van Bloemendaal L, Ten Kulve JS, la Fleur SE, Ijzerman RG, Diamant M. Effects of glucagon-like peptide 1 on appetite and body weight: focus on the CNS. J Endocrinol 2014;221:T1–T16 [DOI] [PubMed] [Google Scholar]
- 2.Cabou C, Burcelin R. GLP-1, the gut-brain, and brain-periphery axes. Rev Diabet Stud 2011;8:418–431 [DOI] [PMC free article] [PubMed] [Google Scholar]
- 3.Alvarez E, Martínez MD, Roncero I, et al. The expression of GLP-1 receptor mRNA and protein allows the effect of GLP-1 on glucose metabolism in the human hypothalamus and brainstem. J Neurochem 2005;92:798–806 [DOI] [PubMed] [Google Scholar]
- 4.Nauck MA, Vardarli I, Deacon CF, Holst JJ, Meier JJ. Secretion of glucagon-like peptide-1 (GLP-1) in type 2 diabetes: what is up, what is down? Diabetologia 2011;54:10–18 [DOI] [PubMed] [Google Scholar]
- 5.Campbell JE, Drucker DJ. Pharmacology, physiology, and mechanisms of incretin hormone action. Cell Metab 2013;17:819–837 [DOI] [PubMed] [Google Scholar]
- 6.Kastin AJ, Akerstrom V, Pan W. Interactions of glucagon-like peptide-1 (GLP-1) with the blood-brain barrier. J Mol Neurosci 2002;18:7–14 [DOI] [PubMed] [Google Scholar]
- 7.Muscelli E, Mari A, Casolaro A, et al. Separate impact of obesity and glucose tolerance on the incretin effect in normal subjects and type 2 diabetic patients. Diabetes 2008;57:1340–1348 [DOI] [PubMed] [Google Scholar]
- 8.Seghieri M, Rebelos E, Gastaldelli A, et al. Direct effect of GLP-1 infusion on endogenous glucose production in humans. Diabetologia 2013;56:156–161 [DOI] [PubMed] [Google Scholar]
- 9.Hunter K, Hölscher C. Drugs developed to treat diabetes, liraglutide and lixisenatide, cross the blood brain barrier and enhance neurogenesis. BMC Neurosci 2012;13:33. [DOI] [PMC free article] [PubMed] [Google Scholar]
- 10.Kastin AJ, Akerstrom V. Entry of exendin-4 into brain is rapid but may be limited at high doses. Int J Obes Relat Metab Disord 2003;27:313–318 [DOI] [PubMed]
- 11.Schlögl H, Kabisch S, Horstmann A, et al. Exenatide-induced reduction in energy intake is associated with increase in hypothalamic connectivity. Diabetes Care 2013;36:1933–1940 [DOI] [PMC free article] [PubMed] [Google Scholar]
- 12.Lerche S, Brock B, Rungby J, et al. Glucagon-like peptide-1 inhibits blood-brain glucose transfer in humans. Diabetes 2008;57:325–331 [DOI] [PubMed] [Google Scholar]
- 13.Gejl M, Egefjord L, Lerche S, et al. Glucagon-like peptide-1 decreases intracerebral glucose content by activating hexokinase and changing glucose clearance during hyperglycemia. J Cereb Blood Flow Metab 2012;32:2146–2152 [DOI] [PMC free article] [PubMed] [Google Scholar]
- 14.Sisley S, Gutierrez-Aguilar R, Scott M, D’Alessio DA, Sandoval DA, Seeley RJ. Neuronal GLP1R mediates liraglutide’s anorectic but not glucose-lowering effect. J Clin Invest 2014;124:2456–2463 [DOI] [PMC free article] [PubMed] [Google Scholar]
- 15.Matsuda M, Liu Y, Mahankali S, et al. Altered hypothalamic function in response to glucose ingestion in obese humans. Diabetes 1999;48:1801–1806 [DOI] [PubMed] [Google Scholar]
- 16.Navarro M, Rodriquez de Fonseca F, Alvarez E, et al. Colocalization of glucagon-like peptide-1 (GLP-1) receptors, glucose transporter GLUT-2, and glucokinase mRNAs in rat hypothalamic cells: evidence for a role of GLP-1 receptor agonists as an inhibitory signal for food and water intake. J Neurochem 1996;67:1982–1991 [DOI] [PubMed] [Google Scholar]
- 17.Yang XJ, Kow LM, Pfaff DW, Mobbs CV. Metabolic pathways that mediate inhibition of hypothalamic neurons by glucose. Diabetes 2004;53:67–73 [DOI] [PubMed] [Google Scholar]
- 18.Hussain S, Richardson E, Ma Y, et al. Glucokinase activity in the arcuate nucleus regulates glucose intake. J Clin Invest 2015;125:337–349 [DOI] [PMC free article] [PubMed] [Google Scholar]
- 19.Banks WA, Owen JB, Erickson MA. Insulin in the brain: there and back again. Pharmacol Ther 2012;136:82–93 [DOI] [PMC free article] [PubMed] [Google Scholar]
- 20.Hasselbalch SG, Knudsen GM, Videbaek C, et al. No effect of insulin on glucose blood-brain barrier transport and cerebral metabolism in humans. Diabetes 1999;48:1915–1921 [DOI] [PubMed] [Google Scholar]
- 21.Bingham EM, Hopkins D, Smith D, et al. The role of insulin in human brain glucose metabolism: an 18fluoro-deoxyglucose positron emission tomography study. Diabetes 2002;51:3384–3390 [DOI] [PubMed] [Google Scholar]
Associated Data
This section collects any data citations, data availability statements, or supplementary materials included in this article.