Abstract
This work presents a study of the thermal evaporation and stability of pyrene (C16H10)n clusters. Thermal evaporation rates of positively charged mass-selected clusters are measured for sizes in the range n=3-40 pyrene units. The experimental setup consists of a gas aggregation source, a thermalization chamber and a time of flight mass spectrometer. A microcanonical Phase Space Theory (PST) simulation is used to determine the dissociation energies of pyrene clusters by fitting the experimental breakdown curves. Calculations using the Density Functional based Tight Binding combined with Configuration Interaction (CI-DFTB) model and a hierarchical optimization scheme are also performed in the range n=2-7 to determine the harmonic frequencies and a theoretical estimation of the dissociation energies. The frequencies are used in the calculations of the density of states needed in the PST simulations, assuming an extrapolation scheme for clusters larger than 7 units. Using the PST model with a minimal set of adjustable parameters, we obtain good fits of the experimental breakdown curves over the full studied size range. The approximations inherent to the PST simulation and the influence of the used parameters are carefully estimated. The derived dissociation energies show significant variations over the studied size range. Compared to neutral clusters, significantly higher values of the dissociation energies are obtained for the smaller sizes and attributed to charge resonance in line with CI-DFTB calculations.
I. Introduction
Polycyclic Aromatic Hydrocarbon (PAH) clusters have been proposed as key species in combustion [1] and astrochemistry [2,3]. In flame chemistry, clustering of PAHs is considered as a pathway to grow soot particles. More specifically, the dimerization of pyrene, C16H10, has been proposed as a key step in soot nucleation [4]. However this result has been challenged both by further modeling studies [5–7] and experimental results [8]. This has motivated many modeling studies in which the clusterization of PAH-like species has been evaluated as a function of different parameters such as PAH size or the presence of aliphatic chains but also by considering chemical dimerization as a way to increase the stability of these species at high temperature [9–17]. Soot nucleation might therefore be induced by three-dimensional crosslinked structures rather than by stack clusters [5,18]. Still PAH clusters are considered as part of the structure of soot particles [19–21] but the lack of detailed diagnosis for incipient particles in flames makes it difficult to conclude [22].
In astrophysics, PAHs have been proposed to be at the origin of a series of Aromatic IR emission Bands (AIBs), which are ubiquitous in the Universe [2,3]. The presence of PAH clusters has been invoked to account for broader features that are observed in denser and less UV-irradiated regions [23–25]. The photo-destruction of these clusters would produce the carriers of the AIBs [23–25]. Charged PAH clusters were also proposed as the carriers of another observational feature, the Extended Red Emission [26]. These observational insights have motivated experimental and theoretical studies on the spectral properties of PAH clusters in the IR or UV-Vis domain [27–31]. The evolution of the ionization potential of PAH clusters with size was also studied [32].
The competition between growth and destruction by evaporation of neutral PAH clusters under interstellar conditions has been modeled [33,34]. Similarly to soot models, these models rely on calculations of the structures and binding energies of PAH clusters combined with a statistical model. It was concluded that these clusters have short lifetimes in UV-irradiated astrophysical environments unless they are made of molecules of typically 50 carbon atoms. The analysis of IR observations led to suggest that free PAHs are produced by evaporation under UV irradiation of very small grains (VSGs) [23–25]. If PAH clusters are a possible model for these evaporating VSGs, then this calls for more experimental data on their dissociation properties. This includes the case of ionized clusters, which are expected to be more stable than their neutral counterpart [35,36].
Experimentally, the most stable structures of clusters of large PAH were often reported to present stack patterns, sometime suggesting parallel displaced features, the presence of a molecule on a stack side [21,37–39]. This is in line with theoretical calculations which investigated dimers at the ab inito level [30,39–48] and larger clusters using force field or coarse grained models [9,19,30,47–51] often combined with global exploration schemes. In order to characterize the stability of PAH clusters, their evolution after absorption of UV photons, collision with a low or high energetic particles or within a high pressure environment [52–60], were studied. Under such extreme conditions PAH clusters may evaporate, sometime breaking the PAH units themselves or leading to chemical reactivity between the different units, evidencing the role of PAH clusters in the growth of PAH themselves [59–63]. The thermodynamic properties of PAH clusters have also been characterized including the simulation of PAH clusters melting [49,64,65]. Let us also mention, that the thermal evaporation of neutral coronene clusters has been investigated by Schmidt et al. [52] who derived dissociation energies of about 1.09 eV, in line with several theoretical estimations.
The purpose of the experiments reported here is to measure the evaporation rates of mass selected pyrene clusters cations as a function of their initial temperature. The dissociation energy of the clusters are extracted from the experimental data using a statistical decay model, namely the Phase Space Theory (PST) here, and these results are finally compared to theoretical dissociation energies calculated within the Density Functionnal based Tight Binding (DFTB) framework. In the forthcoming section, details will be given about how experiments were performed and we will present the experimental results in section III. Section IV is devoted to the calculation of the clusters structures whereas computer simulation of the experiment, which is necessary to extract dissociation energies is presented in section V. In the last section the dissociation energies will be discussed and compared to DFTB theoretical values.
II. Experimental Setup
A detailed description of the experimental setup can be found in references [66] and [67]. In the following, we briefly describe the main stages of the experiment. A schematic of the experiment is given in FIG. 1.
Fig. 1.
Overview of the experimental setup: (a) gas aggregation source, (b) thermalization chamber, (c) First Wiley-McLaren acceleration stage, (d) energy focusing region, (e) deceleration region, (f) second Wiley-McLaren acceleration stage, (g) reflectron and (h) Micro Channel Plate detector. The propagation times t1 to t4 are discussed in section III.
Pyrene clusters are produced in a gas aggregation source (a). This source consists in a double walled chamber cooled down with liquid nitrogen. In this chamber sits an oven containing pyrene powder (Sigma Aldrich 96% purity). The oven temperature is controlled between 40°C and 70°C for the present experiments, depending on the cluster sizes under study. Helium is introduced in the source through the oven as a carrier gas.
A miniature electron gun located at the exit of the oven produces charged species via electron impactionization. The filament producing the electrons is heated up by passing approximately 2 A through it and is biased at typically 150 V.
The helium gas stream brings the produced charged clusters to the thermalization stage (b). It consists of a 10cm long copper piece, with an 2 cm inner diameter. The temperature of the thermalization stage is controlled between 25 K and room temperature using a helium closed cycle cryostat and heater cartridges. The temperature is measured at three different locations, namely at the top, bottom and exit of the thermalization chamber using Silicon diodes sensors. The three measured temperatures are within 2 K. The helium pressure inside the thermalization chamber (of the order of 1 mbar) is high enough to allow for thousands of collisions between the clusters and the helium atoms, which ensures the thermalization of the clusters at the temperature of the chamber itself.
At the exit of the thermalization chamber, the cluster beam is focused by an electrostatic lens in order to optimize the transmission through a 1 mm diameter skimmer. The distance from the exit of the thermalization chamber to the skimmer is 8 cm and the typical pressure is 2.10-3 mbar.
Beyond the skimmer, the charged clusters enter the high vacuum part of the experiment where mass selection, kinetic energy focusing and slowing down occurs. Pulsed high voltages applied to the first Wiley-McLaren electrodes (c) accelerates all the clusters, giving them an average kinetic energy of 622 eV. The applied voltages and the spacing between the electrodes of the Wiley-McLaren is chosen such that, 26 cm downstream, there is a linear relation (to first order) between the cluster position and their kinetic energy. Using a pulsed high voltage a field is created in this region (d) that compensates the kinetic energy dispersion. The time at which this pulsed high voltage is applied determines which cluster size is correctly energy focused. After this kinetic energy focusing, ions are decelerated by creating a potential barrier (e). At the end of the potential barrier, the potential is shut down and the mass selected clusters then fly freely up to the second Wiley-McLaren acceleration stage (f). In the present experiment, the mass selected clusters have a kinetic energy of 22 eV. When the clusters of mass of interest arrive in between the two first electrodes of the second Wiley-McLaren, high voltages are applied and the clusters are directed towards the reflectron (g) and finally detected using micro-channel plates (h).
III. Experimental Results
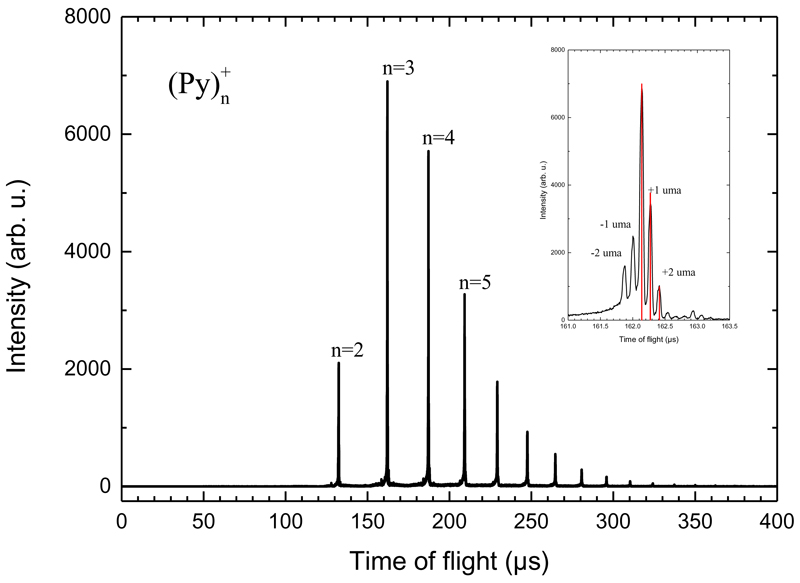
FIG. 2 gives an example of time-of-flight mass spectrum (TOF-MS) of the clusters produced in the gas aggregation source. This spectrum was recorded for clusters at very low temperature (25 K) so that no evaporation occurs in the mass spectrometer. In the depicted example, pyrene clusters (Py)+n of sizes n=2 up to 12 can be seen. This size distribution can be shifted towards larger or smaller sizes by adjusting the gas aggregation source parameters (helium flux and oven temperature mainly). The inset in FIG. 2 shows the detailed structure of the n=3 peak. The most intense sub-peak is due to the n=3 cluster containing only 12C and 1H atoms. The sub-peaks at +1 amu and +2 amu are due to the isotope 13C. Using the natural abundances of 13C, the relative intensities of these peaks are nicely reproduced. We attribute the peaks at -1 amu and -2 amu to the loss of H and 2H/H2 respectively from Pyrene molecules which is due to fragmentation by electron impact in the gas aggregation source.
Fig. 2.
Example of a time of flight mass spectrum of pyrene clusters obtained with the gas aggregation cluster source. The inset in the figure show the detailed structure of the peak for n=3. Peaks at +1 and +2 amu are due to 13C isotopes. Peaks at -1 and -2 amu are attributed to singly and doubly dehydrogenated species. The red vertical bars in the inset are the intensities given by the theoretical isotopic abundances.
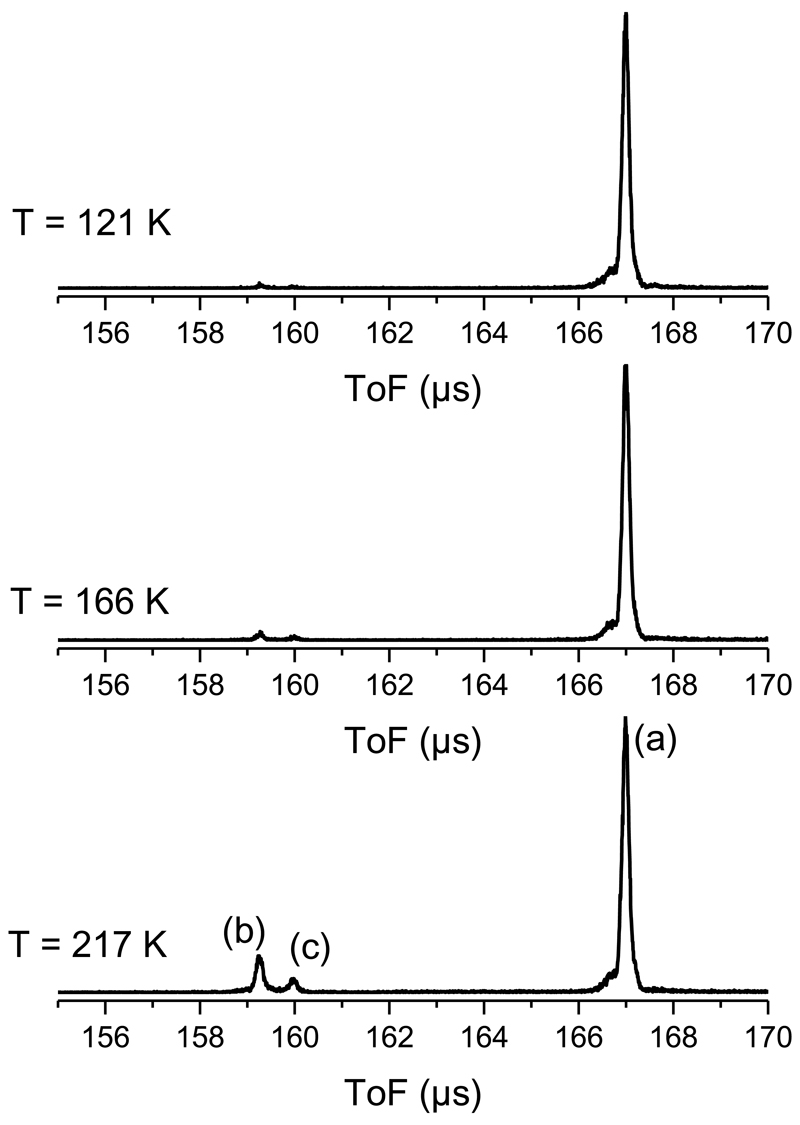
Once the source parameters are optimized for the desired size range, our setup is operated in mass selection mode. The experimental signal then consists in TOF-MS recorded as a function of the thermalization chamber temperature. FIG. 3 shows the spectra which have been obtained at different temperatures for (Py)11+. These TOF-MS have been obtained by selecting clusters of 11 pyrene molecules slowed down to a translational kinetic energy of 22 eV. At the highest temperature (217 K) three peaks labeled (a), (b) and (c) appear in the TOF-MS. Peak (a) corresponds to the parent cluster (Py)11+. Peaks (b) and (c) come from the evaporation of a single pyrene molecule from the parent cluster. The appearance of two peaks is related to the time at which evaporation takes place. In FIG. 1 we attribute typical times for clusters traveling across the different parts of the experimental setup:
-
i)
The first time t1 is the time needed to reach the first acceleration stage from the exit of the thermalization chamber. If evaporation of a cluster of size n occurs during this time, clearly it cannot be observed : the resulting cluster of size n-1 will not be mass selected. On the other hand, a cluster of size n resulting from the evaporation of larger sizes will be mass selected. Time t1 is evaluated by considering that the cluster travel at the thermal velocity of helium between the exit of the thermalizer and the first acceleration stage, that is
-
ii)
If evaporation occurs during time t2, the cluster of size n-1 will not have the correct kinetic energy and therefore will not reach the second acceleration stage in time and will not be detected.
-
iii)
clusters evaporating during time t3 will be detected. Indeed the clusters of size n-1 will keep the speed of the parent cluster and reach in time the second acceleration stage and thus be detected at the time of flight corresponding to size n-1.
-
iv)
If evaporation occurs during time t4, clusters of size n-1 enter the reflectron at the same time and with the same speed as a cluster of size n, but after being deflected by the reflectron they reach the detector at a slightly larger time of flight (corresponding to peak (c) in FIG. 3) than the cluster of size n (peak (b)).
Fig. 3.
Time of flight mass spectra of (Py)+n, n=11 as a function of the initial temperature. Peak (a) corresponds to the parent cluster. Peaks (b) and (c) correspond to clusters of sizes n-1, which were produced during time t3 and t4, respectively (see FIG. 1).
The values of the times t2 to t4 are t2 = 48 μs, t3 = 52 μs and t4 = 45μs for a cluster of size n=4. To obtain them for other sizes n they simply have to be multiplied by √(n/4).
Breakdown curves can be obtained by plotting the ratio I/I0 vs temperature, where I is the intensity of the parent peak and I0 is the sum of the intensities of all detected peaks. The peaks intensities are extracted from the TOF-MS by integrating the peaks.
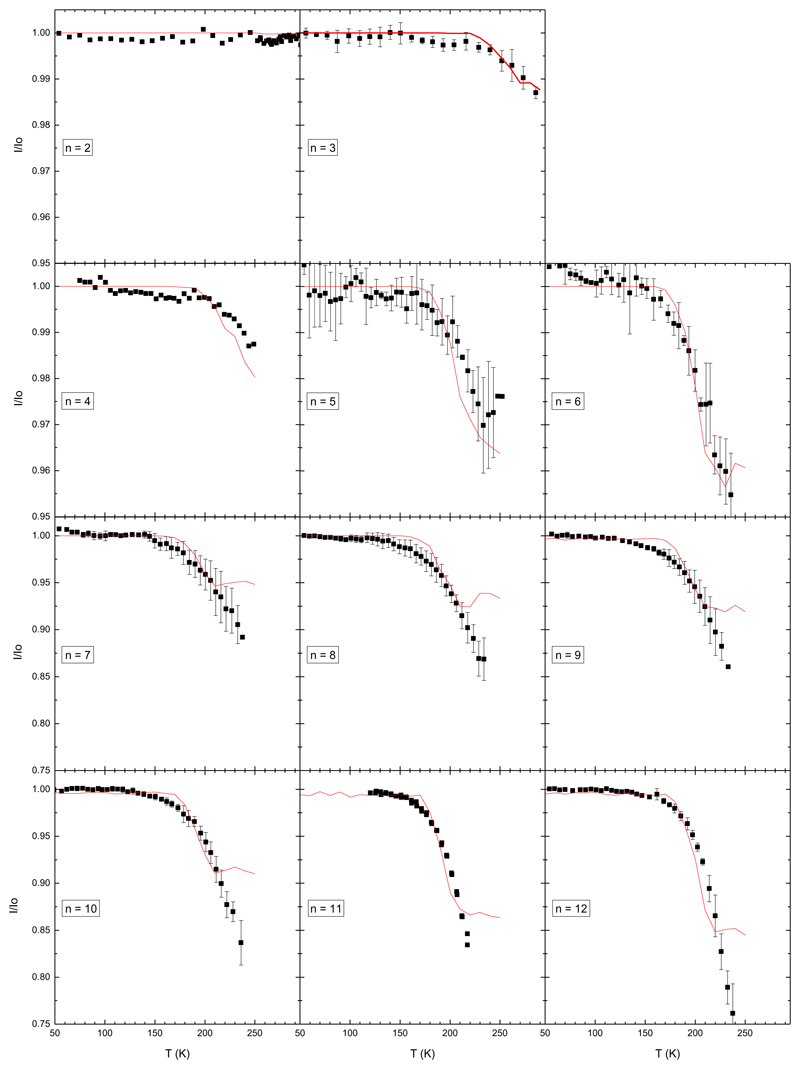
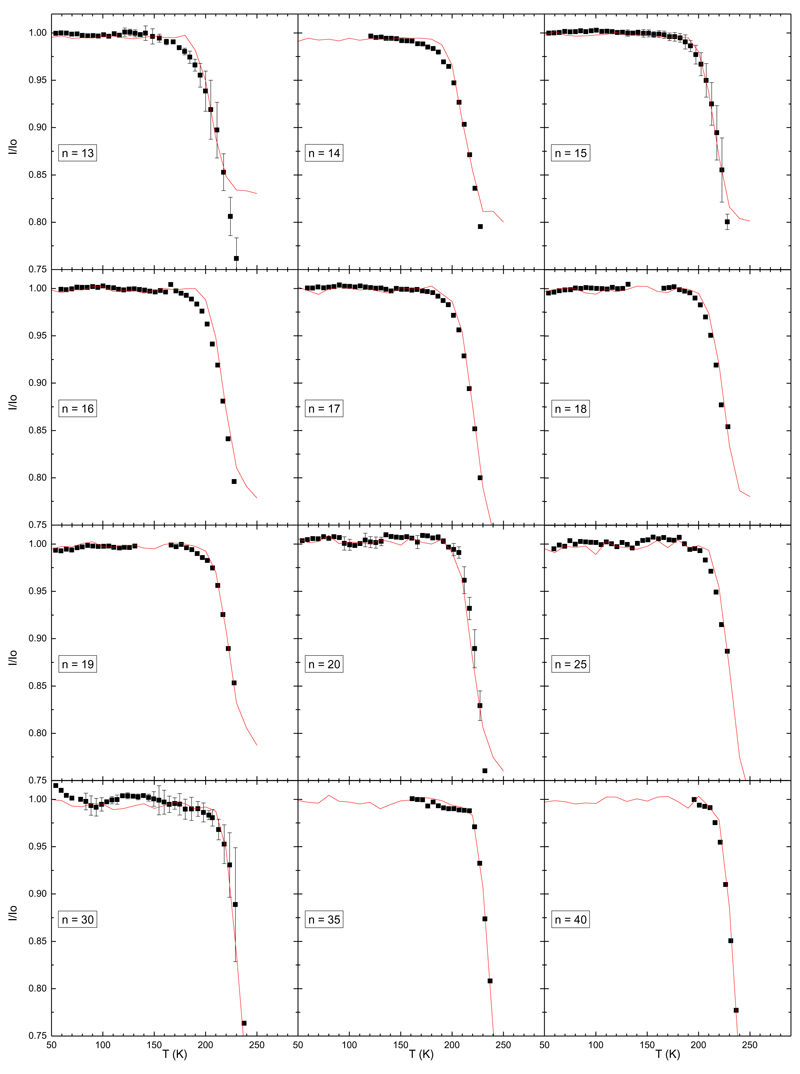
We report in FIG. 4 and FIG. 5 the ratios I/I0 plotted as a function of the initial cluster temperature. Experiments have been performed for sizes from n=2 up to n=40. The global trend of the curves I/I0(T) is similar for all sizes above n=3: at low temperature the ratio I/I0 equals 1, meaning that no evaporation is observed. Around 200±20 K this ratio starts to decrease. On some curves the ratio eventually reaches a minimum at the highest temperature and saturates. Note that the vertical scale is not the same for all graphs in these figures. For the larger clusters, the ratio can be as low as 0.8 whereas for the smaller size n=3 it never goes below 0.99 at 285 K, meaning that very few evaporation events are observed for this size. For size n=2, we were not able to observe evaporation up to 290 K.
Fig. 4.
Ratios I/I0 for sizes n=2 to n=12. The black squares are experimental data points whereas the red line is the result of the model. Error bars represent one standard deviation.
Fig. 5.
Ratios I/I0 for sizes n=13 to n=40. The black squares are experimental data points whereas the red line is the result of the model. Error bars represent one standard deviation.
The shape of the curves is explained as follow. The initial ratio decrease with temperature is due to evaporation taking place during time t3 (see FIG.1). At some high enough temperature evaporation is no longer negligible during time t1 and t2, thus clusters of size n resulting from the evaporation of clusters of size n+1 become a significant part of the mass selected clusters of size n. For instance, from the simulations used to reproduce our experimental data (see below), we deduce that at 250 K up to 100% of the size n comes from evaporation of larger sizes (up to n+3) for the clusters of size n=10. In other words, mass selected clusters of size n starts going from the canonical ensemble to the evaporative ensemble [52,68]. Now, these clusters of size n coming from the evaporation of clusters of size n+1 are colder (due to evaporative cooling) than clusters that did not undergo evaporation, thus their evaporation rate is lower.
In order to reproduce the experimental curves it is necessary to simulate the whole trajectories of the ions in the experimental setup. We use a statistical model of cluster evaporation based on the PST to calculate microcanonical evaporation rates of the clusters during their propagation inside the setup. Since PST needs some input parameters, we present in the next section the DFTB calculations used to extract those ingredients and the PST simulations in the following section.
IV. Clusters Structure Calculation
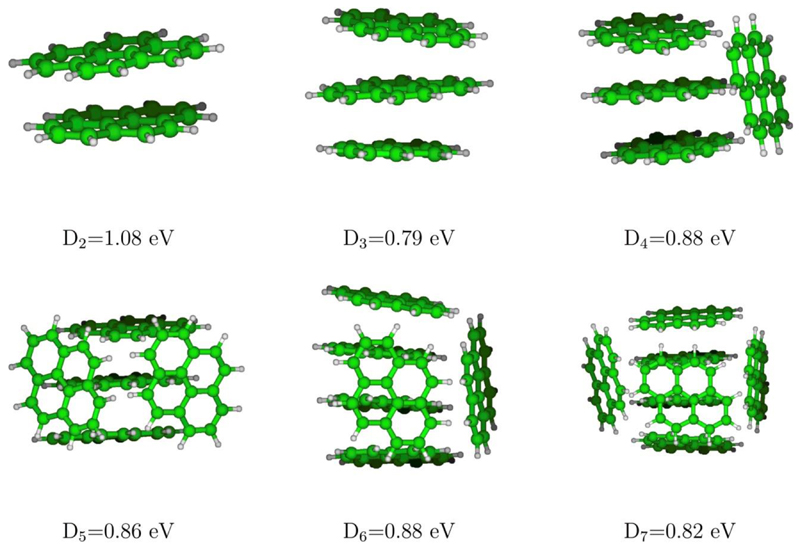
From the theoretical side, the level of theory to model the quantum electronic system should allow for a reasonable description of the different contribution to the potential energy while maintaining an acceptable computational cost, especially as global optimization is intended here. A key point with charged molecular clusters is to deal with the charge resonance over several units. This prevents from using standard Density Functional Theory (DFT) methods as, in addition to quite high computational cost, the traditionally used functionals suffer from the well known self-interaction errors associated to charge delocalization over long distances. In this work, we have used a scheme based on the Density Functional based Tight Binding (DFTB) [69–71], an approximated DFT method whose computational efficiency relies on the use of parameterized integrals and a limited basis. Over the past years, we have coupled this approach with a Configuration Interaction (DFTB-CI) scheme to get rid of self interaction problems in cationic molecular clusters. The mio-set [70] parameterization was chosen in consistency with our previous work on ionization potential [32]. The structure optimization was conducted as follows. In a first step, initial guesses of the most stable structures of cationic pyrene clusters have been obtained from a global exploration scheme (Parallel Tempering Monte Carlo [72,73]) considering as rigid the molecular subunits. Subsequently, this step was completed by local optimizations for randomly selected visited structures relaxing all degrees of freedom, namely including the intra-molecular ones. Let us mention that this approach has already been used to obtain the most stable pyrene clusters structures up to the heptamer for cations and neutrals and will be detailed in a forthcoming paper [35]. The most stable structures are represented on FIG. 6 as well as the corresponding adiabatic dissociation energies for the loss of a neutral monomer. The frequencies, needed and used here in the PST model, were computed in the harmonic approximation by diagonalization of the Hessian matrix.
Fig. 6.
Most stable structures of cationic pyrene clusters and dissociation energies corresponding to the loss of one pyrene unit.
V. Trajectories calculation and Phase Space Theory evaporation model
a). Trajectories calculation
The experimental ratios I/I0 vs cluster temperature are reproduced by simulating the trajectories of the clusters in the experimental setup. The electric field generated at various places in the experimental setup are calculated by solving the Laplace equation. The ion trajectories are calculated by integrating the Newton’s equation of motion with the 4th order Runge-Kutta method with adaptative time steps. At each time step the evaporation probability is tested.
The cluster population of size n is constructed by propagating clusters of sizes [n,n+4] between the exit of the thermalization chamber and the first acceleration stage. The initial internal energy is randomly picked up so that the ensemble of cluster’s internal energies follow a Boltzmann distribution at the thermalization chamber temperature. The evaporation probability corresponding to this internal energy is then evaluated using PST. In their course to the first acceleration stage, clusters may undergo several evaporations. Ultimately, only clusters ending with size n are kept and serve as initial clusters for the propagation through the experimental setup. Finally, we generate time-of-flight mass spectra that we analyze with the exact same tools used to analyze experimental time-of-flight mass spectra.
The results of these simulations correspond to the red lines in FIG. 4 and FIG. 5. In the following we will describe how the internal energies and angular momentum distributions as well as PST evaporation rates are evaluated.
b). Phase Space Theory evaporation model
The evaporation probability is evaluated using PST [74] to calculate the microcanonical evaporation rates Wn(E,J). Phase Space Theory (PST) has also proven to accurately predict product energy partitioning upon unimolecular dissociation for atomic [75–77] and molecular [78–80] clusters. The evaporation consists here in the loss of a neutral pyrene molecule from a positively charged pyrene cluster:
The version of the PST used here takes into account conservation of both energy and total angular momentum. It assumes that the transition state is defined at the maximum of the centrifugal barrier (loose transition state). Only harmonic vibrations are considered and parent and products are considered to be of spherical symmetry.
The general formula for the J conserved evaporation rate is [74]:
where E is the initial internal vibrational energy of the parent cluster, Erot its initial rotational energy, J its initial total angular momentum and B0 its rotational constant. Ef is the total (internal + external) energy of the fragments. D is the dissociation energy αf and αb are the forward and backward reaction path degeneracies respectively. Their ratio is taken equal to 1.
The density of states N(E) and the total number of states G(Ef) are obtained by inversion of the partition function using the steepest descent method under the constraint of total angular momentum conservation and the hypothesis of loose transition state (see appendix for details).
The long range potential between the charged cluster and the evaporated molecule is assumed to have a 1/r4 dependence (ion polar interaction). The isotropic pyrene dipole polarisability is taken from Gussoni et al [81]. Point like particle effective interaction potential between the neutral fragment and the charged cluster is assumed (see appendix).
Since multiple evaporations may be involved in the experiment, we also need to know the internal energy of the charged fragment, as well as the distribution of relative velocity between charged and neutral fragments. The probability P(Ev,Erel,Er) to have an internal energy Ev left in the charged fragment, a relative kinetic energy Erel and a total rotational energy Er of the fragments is given by:
where N1(Ev) is the density of states of the charged fragment, N2(Ef-Ev-Erel-Er) the density of states of the neutral evaporated molecule and Nx(Er, Erel, J) the density of external states (translational + rotational). Several ingredients are therefore necessary to calculate evaporation rates and energy distributions, namely, the harmonic frequencies, the moments of inertia and the dissociation energies.
In the following we describe how these ingredients are obtained.
Harmonic frequencies
The harmonic vibrational frequencies are obtained from a normal mode analysis of the structures calculated using DFTB and CI-DFTB model for neutrals and cations, respectively. The harmonic vibrational frequencies have been calculated from the monomer up to the tetramer for cations. For the neutrals, harmonic frequencies have been obtained for the monomer as well.
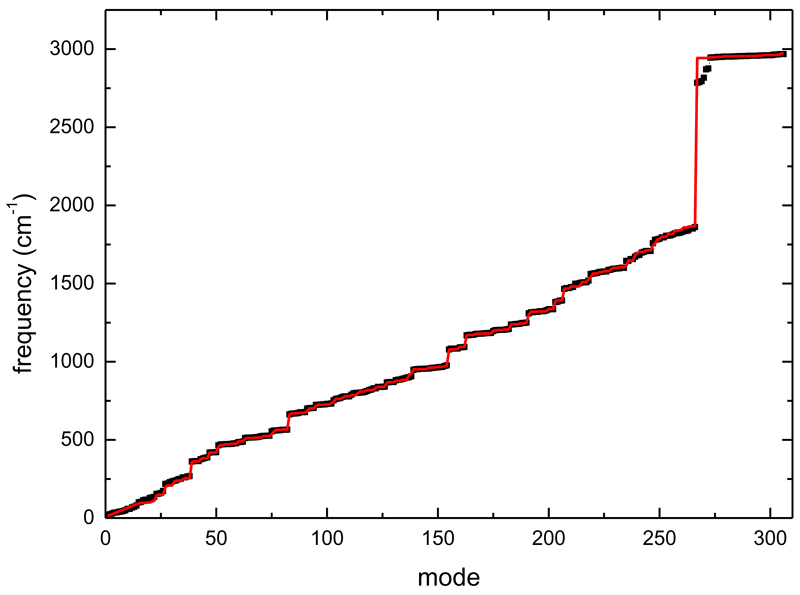
In order to obtain the vibrational density of states for cluster sizes up to n=40, we need their vibrational harmonic frequencies. For such large size they cannot even be obtained from the present CI-DFTB scheme. Therefore we constructed a crude interpolation scheme, consisting in approximating the intramolecular harmonic vibrational frequencies of a cluster of size n as n-1 times the neutral monomer frequencies plus the monomer cation frequencies. The intermolecular modes frequencies are linearly interpolated between 13 cm-1 and the lowest monomer mode energy. FIG. 7 presents the result of the frequencies obtained with the above-described method for the tetramer cation. Note that despite the fact that the CI-DFTB analysis shows that the charge of small clusters is not fully localized on the stack central molecule (which carries only 49 % of the total charge), the CI-DFTB calculated intramolecular and intermolecular frequencies of the tetramer cation are quite well reproduced via this crude extrapolation. It is only for some of the high frequencies C-H vibrations that our reconstruction departs from the calculated CI-DFTB tetramer frequencies. Indeed, some of the C-H vibrations are lowered due to the proximity of the pyrene plane close to the H atoms of the pile of pyrene molecules (see FIG. 6 for the structure of the pyrene tetramer cation). However, the agreement is overall excellent, and anyway we do not expect these modes to play an important role due to their high energy compared to the thermal energies accessible in this study.
Fig. 7.
Frequencies of the 306 modes of the pyrene tetramer cation. The black dots are the CI-DFTB theoretical harmonic modes. The red line is obtained by constructing the intramolecular modes as one pyrene cation plus 3 neutral pyrene monomers. The intermolecular modes energies are obtained by interpolation between 13 cm-1 and the lowest monomer mode. See text for more details.
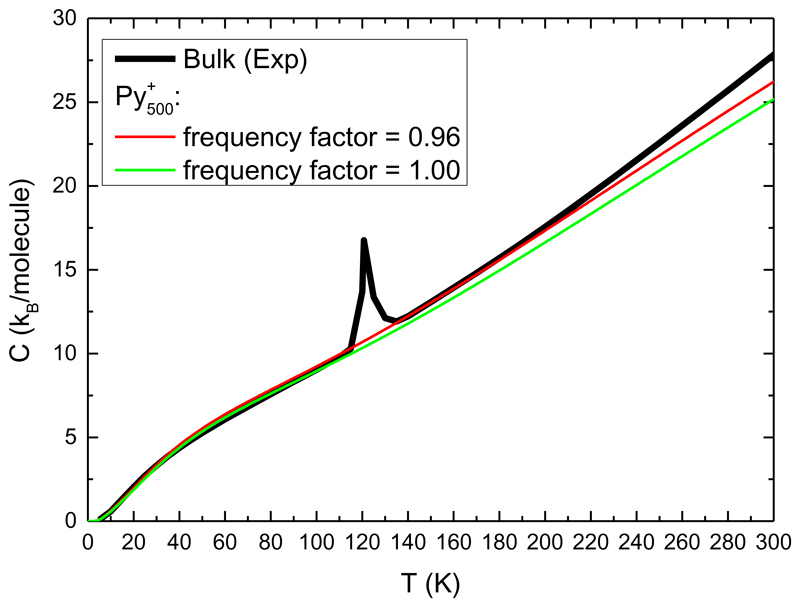
FIG. 8 presents the calculated heat capacity of a pyrene cluster of size 500 together with the experimental heat capacity of the bulk [82]. The value of 13 cm-1 used as the lower intermolecular mode is adjusted so that the low temperature heat capacity of bulk pyrene is well described. The heat capacity appears to be quite well reproduced although it is underestimated at high temperature. Scaling the frequencies by 0.96 improve the agreement with the bulk heat capacity. This scaling provides some global empirical correction to the precision of the calculated harmonic frequencies and the effect of anharmonicity. Such a scaling is usually performed while comparing DFT results, and therefore DFTB ones, to experimentally measured vibration frequencies [83,84].
Fig. 8.
The black line is the experimental heat capacity of bulk pyrene taken from ref. [82]. The red line is the heat capacity obtained for a cluster of 500 molecules by constructing the inter- and intra-molecular modes as indicated in the text. The green line is obtained by scaling the frequencies by 0.96.
Moments of inertia
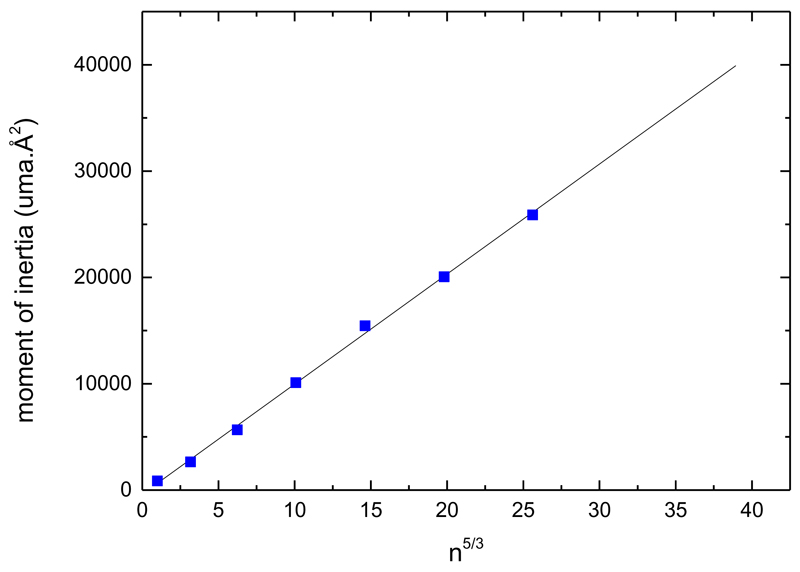
The calculation of the J-conserved PST evaporation rates requires the knowledge of the clusters moments of inertia. The three components of the moment of inertia of neutral pyrene clusters and molecule are obtained from the calculated CI-DFTB structures for sizes n=1-7. We use the geometrical average of the three components to calculate the equivalent moment of inertia for a sphere The moments of inertia for larger clusters are obtained by a linear fit of I vs n5/3. FIG. 9 presents the calculated moments of inertia together with the linear fit I = 1035 ×n5/3-387 amu.Å2.
Fig. 9.
Blue points: geometric average of the three components of the moments of inertia of pyrene clusters (n=1-7). The black line is a linear fit used to extrapolate the moments of inertia a large sizes.
Dissociation energies
The evaporation probability requires values for the dissociation energies. We have first attempted to use the CI-DFTB dissociation energies. However we could not find any global agreement with experiment (see the discussion section below). Thus, the dissociation energies used in the PST modeling are taken as the only adjustable parameters determined from a best fit of experimental curves I/I0(T).
c). Model results
The calculated microcanonical rates are used in the trajectories simulations to calculate the ratios I/I0. Monte Carlo integration is performed to average the intensities over the thermal distributions of initial internal energies and rotational number J.
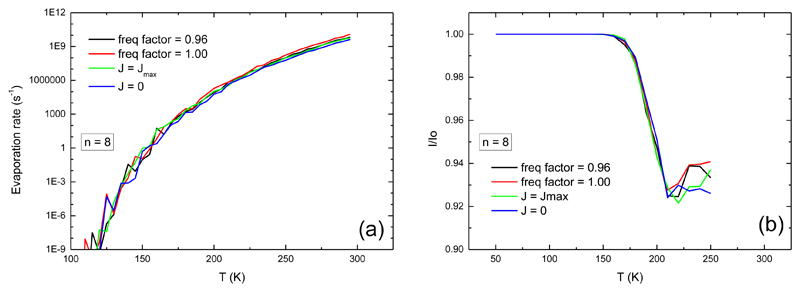
As an example, we present in FIG. 10 the canonical evaporation rate and the ratio I/I0 obtained with an adjusted dissociation energy of 0.64 eV for a cluster of size n=8. We illustrate the effect of variations in the model input including the frequency scaling, whose value at 0.96 is obtained to better reproduce the bulk heat capacity, and the J value. For the latter, we also report two cases with J=0 and J=Jmax the most probable value from a thermal distribution at the clusters temperature. One can see in FIG. 10 that these parameters only slightly impact the values of the evaporation rate, which supports the fact that our fit is quite robust. Similar figures are provided as supplementary material for sizes n=3 and n=20.
Fig. 10.
Influence of J and of the frequency factor on (a) the canonical evaporation rate and (b) the ratio I/I0 for n=8 pyrene clusters. Black curve: frequency factor is 0.96, thermal distribution of J; red curve: frequency factor is 1.0 and thermal distribution of J; green curve: frequency factor is 0.96 and J is taken as its most probable value; blue curve: frequency factor is 0.96 and J is 0.
VI. Discussion
Using the above described PST-based model, the breakdown curves provided by I/I0 are overall well-fitted (see FIG. 4 and FIG. 5). In order to adjust the data, we start with the larger sizes. There the agreement is easily found by eyes. As we proceed towards smaller sizes, where the agreement is less evident, we have privileged the reproduction of the onset of evaporation rather than the absolute value at the highest temperatures. For the largest sizes, n=14-40, a fair agreement between the experiment and the model is obtained. For the smaller sizes, n=4-13, it the agreement remains good. For n=3, we observe, over the studied temperature range, a slight decrease of I/I0 but no main decrease, which makes the derived value for the dissociation energy a bit more arbitrary. For n=2, only a lower limit of the dissociation energy of 0.9 eV can be obtained since no evaporation is observed up to the highest temperature studied in our experiment.
The agreement between the experiment and the model is obtained with only one adjustable parameter, the dissociation energy.
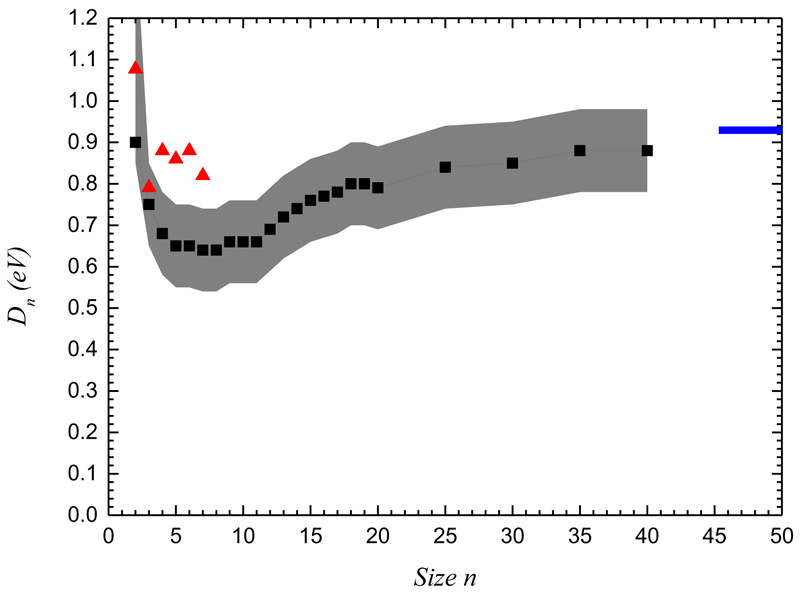
The PST evaporation rates are known to be potentially off by several units if not orders of magnitude. Therefore, PST evaporation rates are usually calibrated from molecular dynamic simulations by calculating evaporation rates at high internal energies [34,86,87]. Statistical rates are then scaled by a so called pre-exponential prefactor so that they match the molecular dynamic rates at high energy. In our case, we don’t have such a calibration. Our calculated values of the evaporation rates allow reproducing the experimental data without calibration. We note that dissociation energies deduced for the largest sizes compare well with the vaporization enthalpy of the bulk (see FIG. 11). By fixing the dissociation energy of the size n=40 at the value of the bulk enthalpy, the dissociation rates have to be multiplied by a factor ~10 in order to reproduce again the experimental data.
Fig. 11.
Dissociation energies of Pyrene clusters. The filled black triangles are the dissociation energies obtained from the PST rate reproducing the experimental data. The grey shaded area represent the uncertainty in the determination of the dissociation energies. The red triangles are the monomer evaporation energies of the lowest energy structures as calculated by CI-DFTB. The horizontal blue line is the vaporization enthalpy of bulk Pyrene at 298 K [85].
In the calculations, we therefore keep the pre-exponential factor as calculated and only vary the value of the dissociation energy. Any uncertainty on the pre-exponential factor is therefore incorporated as an error bar on the dissociation energy, since both values are linked in the dissociation rates.
There are several approximations in our PST calculations in particular the fact that we have not considered explicitly anharmonicity (only somehow via the frequency scaling factor). In addition, we consider all involved species to be of spherical symmetries. Still, we have shown that the initial choice of the rotational number J has little influence on the calculated evaporation rates. This can be explained by the fact that the considered species are quite heavy and strong rotational effects are not expected.
Another important point in our simulation is the correct description of the evaporation events taking place before mass selection. As already stated, the clusters that are mass selected go from the canonical ensemble towards the evaporation ensemble as evaporation steps in. Therefore, the time spent between the exit of the thermalizer and the mass selection is rather important. Indeed, the more time is spent there, the closer the clusters are to the evaporation ensemble. The curves we present are obtained by considering that the clusters travel at the thermal velocity of the helium carrier gas, which is not necessarily the case. We have checked the influence of the travel time t1 by multiplying or dividing this time by a factor of 2.
The dissociation energies deduced from the fit of the experimental data are presented in FIG. 11. The grey shaded area reflects the uncertainty in the determination of the dissociation energies due to the above considerations.
At large sizes, the dissociation energies converge towards a constant value that is close to the reported value of the macroscopic vaporization enthalpy. The overall evolution of the dissociation energy with the cluster size can be rationalized by considerations on charge localization in the clusters. The initial decrease of the dissociation energies with size is due to the dilution of the attractive interaction due to resonance charge. Indeed, as shown by the CI-DFTB calculations, there is a strong charge resonance effect in small clusters up to sizes n=4-5, namely as already mentioned the charge may extend over up to three units [32,35,88]. Actually, the cohesive energies of small clusters between 2 and 7 units vary in the range [0.25-0.62 eV] for neutrals and in the range [0.54-0.76 eV] for cations, illustrating the reinforced stability of the small cation clusters [35,51]. From n~7, the dissociation energies slowly rise towards a plateau indicating the convergence towards the macroscopic vaporization enthalpy. This is the behavior expected for neutrals as the dissociation energies result from the sum of the attractive interactions between an increasing number of molecules. As the size increases, the number of molecules interacting strongly with each other will saturate due to the finite interaction ranges. The minimum reached in between these two regimes is for sizes between 5 and 10.
Finally, we also present as red triangles in FIG. 11 the dissociation energies obtained from the CI-DFTB calculations. These values correspond to the adiabatic loss of a neutral monomer. They compare reasonably well with the experimental values considering the level of approximation of the CI-DFTB method. While the decrease of the dissociation energy between 2 and the next sizes is well accounted for, the CI-DFTB dissociation energies in the range n=3-7 seem to be overestimated by 0.2 eV with respect to the values derived from the PST simulations. This could be attributed to the fact that DFTB relies on the choice of a parameter set and that a different choice could affect the final results. The other reason could be the delicate description of long range forces such as polarization or dispersion in DFTB. However, increasing those contributions in the present case would lead to an increase of the stability of the clusters versus evaporation and would therefore not lead to a better agreement with the experiment.
Finally and independently of the expected accuracy of the CI-DFTB process, a further potential source of explanation for the observed differences could be the presence of isomers in the experiment at higher energies relative to the most stable structures, which would therefore have lower values of dissociation energies. If such isomers exist in our experiment, they could only be formed in the source. In the case of anionic clusters of anthracene several isomers have been identified experimentally using photoelectron spectroscopy [89]. Furthermore, we note that we produce dehydrogenated species in the source. The presence of these species could be a signature of partly covalently bonded clusters. For the smallest cluster sizes (up to n=4-5) our mass selection scheme allows us to eliminate these species, which is not true anymore for the largest sizes. However these species have been shown to dissociate by losing hydrogen atoms [63], a process, that involves much higher dissociation energies than the energies involved in our study. Still, the presence of covalently bonded species within the clusters might influence their stability.
VII. Conclusion
We have quantified the evaporation of cationic pyrene clusters over an extended temperature range [25-290 K] and size range, from n=2 to 40 pyrene units. Using a PST-based model, we have derived dissociation energies from the experimental curves. The size dependence of the finite cluster dissociation energies is found to decrease between n=2 and the next sizes to reach a minimum in the range n=4-10 and then slowly increasing again up towards the macroscopic enthalpy. This can be attributed to the strong stabilization through charge resonance in the case n=2, while for the larger sizes, delocalization over the neighboring units of the central charged molecule is smaller, reducing their evaporation energies vs that of the dimer case. Finally for larger sizes n>10, the sum of the polarization contributions of the numerous neutral molecules surrounding the charge core contribute to increase the stability vs evaporation. In this process of deriving the dissociation energies within the PST scheme, the effect of the input parameters, namely the rotation, the scaling of the vibrational frequencies, or the sphericity approximation, have been carefully estimated or discussed. One further step to be taken could be to perform molecular dynamics simulations at high temperature in order to determine evaporation rates that could be compared with the ones reported here [80,87].
The fair reproduction of the experimental breakdown curves with our PST-based model provides confidence in the calculated dissociation rates and the derived dissociation energies. A CI-DFTB scheme together with a hierarchical global optimization scheme was used to provide theoretical data about structures, harmonic frequencies and dissociation energies in the size range n=2-7. The calculated frequencies were used as input ingredients in the PST and extrapolated in the range n=8-40. The theoretical CI-DFTB dissociation energies were found to account for the global evolution with cluster size as derived from the experiment. However, they appear to be systematically overestimated with respect to the experimental values by about 0.2 eV. This difference might be due to the presence of isomers at higher energy or to approximations inherent to the CI-DFTB formalism.
Finally, this work brings further inputs for astrophysical models. Our combined experimental and modeling study shows that pyrene clusters investigated in this work (up to 40 units) would be easily dissociated in the UV-irradiated environments where their presence has been proposed [23,25]. The dissociation is expected to occur when its rate is comparable to the IR cooling rate, which is expected to be in the 1-100 s-1 range depending on the cluster size and total energy [34]. For pyrene clusters, this will be achieved at 7-8 eV for the largest n = 40 species and only ~1 eV for the smallest clusters despite the fact that they benefit from an extra- stability due to charge resonance (cf. our tabulated microcanonical evaporation rates in the Supp. material). Such clusters would therefore very easily evaporate in astrophysical environments. Their stability would however increase with increasing number of units in the clusters or increasing size of the units as discussed previously [34]. The enhanced stability of ions with respect to neutrals is a general trend in clusters and will have to be evaluated for clusters containing other PAH types.
Supplementary Material
Acknowledgements
The research leading to these results was supported by the funding received from European Research Council under the European Union’s seventh framework program (FP/2007-2013) ERC-2013-SyG, Grant agreement n. 610256 NANOCOSMOS.
We acknowledge the use of the supercomputing facility CALMIP (Toulouse, France).
References
- [1].Frenklach M, Wang H. Twenty-Third Symp Int Combust. 1991;23:1559. [Google Scholar]
- [2].Allamandola LJ, Tielens AGGM, Barker JR. Astrophys J Lett. 1985;290:L25. [Google Scholar]
- [3].Léger A, Puget JL. Astron Astrophys. 1984;137:L5. [Google Scholar]
- [4].Schuetz CA, Frenklach M. Proc Combust Inst. 2002;29:2307. [Google Scholar]
- [5].Wang H. Proc Combust Inst. 2011;33:41. [Google Scholar]
- [6].Totton TS, Misquitta AJ, Kraft M. Phys Chem Chem Phys. 2012;14:4081. doi: 10.1039/c2cp23008a. [DOI] [PubMed] [Google Scholar]
- [7].Mao Q, van Duin ACT, Luo KH. Carbon. 2017;121:380. [Google Scholar]
- [8].Sabbah H, Biennier L, Klippenstein SJ, Sims IR, Rowe BR. J Phys Chem Lett. 2010;1:2962. [Google Scholar]
- [9].Herdman JD, Miller JH. J Phys Chem A. 2008;112:6249. doi: 10.1021/jp800483h. [DOI] [PubMed] [Google Scholar]
- [10].Raj A, Sander M, Janardhanan V, Kraft M. Combust Flame. 2010;157:523. [Google Scholar]
- [11].Giordana A, Maranzana A, Tonachini G. J Phys Chem C. 2011;115:1732. doi: 10.1021/jp1067044. [DOI] [PubMed] [Google Scholar]
- [12].Chung S-H, Violi A. Proc Combust Inst. 2011;33:693. [Google Scholar]
- [13].Elvati P, Violi A. Proc Combust Inst. 2013;34:1837. [Google Scholar]
- [14].Veshkini A, Eaves NA, Dworkin SB, Thomson MJ. Combust Flame. 2016;167:335. [Google Scholar]
- [15].Adkins EM, Giaccai JA, Miller JH. Proc Combust Inst. 2017;36:957. [Google Scholar]
- [16].Kholghy MR, Kelesidis GA, Pratsinis SE. Phys Chem Chem Phys. 2018;20:10926. doi: 10.1039/c7cp07803j. [DOI] [PubMed] [Google Scholar]
- [17].Mao Q, Hou D, Luo KH, You X. J Phys Chem A. 2018;122:8701. doi: 10.1021/acs.jpca.8b07102. [DOI] [PubMed] [Google Scholar]
- [18].Liu P, Li Z, Roberts WL. Proc Combust Inst. 2019;37:977. [Google Scholar]
- [19].Totton TS, Chakrabarti D, Misquitta AJ, Sander M, Wales DJ, Kraft M. Combust Flame. 2010;157:909. [Google Scholar]
- [20].Apicella B, Pré P, Alfè M, Ciajolo A, Gargiulo V, Russo C, Tregrossi A, Deldique D, Rouzaud JN. Proc Combust Inst. 2015;35:1895. [Google Scholar]
- [21].Wang CS, Bartelt NC, Ragan R, Thürmer K. Carbon. 2018;129:537. [Google Scholar]
- [22].Michelsen HA. Proc Combust Inst. 2017;36:717. [Google Scholar]
- [23].Rapacioli M, Joblin C, Boissel P. Astron Astrophys. 2005;429:193. [Google Scholar]
- [24].Berné O, Joblin C, Deville Y, Smith JD, Rapacioli M, Bernard JP, Thomas J, Reach W, Abergel A. Astron Astrophys. 2007;469:575. [Google Scholar]
- [25].Pilleri P, Montillaud J, Berné O, Joblin C. Astron Astrophys. 2012;542:A69. doi: 10.1051/0004-6361/201425338. [DOI] [PMC free article] [PubMed] [Google Scholar]
- [26].Rhee YM, Lee TJ, Gudipati MS, Allamandola LJ, Head-Gordon M. Proc Natl Acad Sci. 2007;104:5274. doi: 10.1073/pnas.0609396104. [DOI] [PMC free article] [PubMed] [Google Scholar]
- [27].Lemmens AK, Gruet S, Steber AL, Antony J, Grimme S, Schnell M, Rijs AM. Phys Chem Chem Phys. 2019 doi: 10.1039/c8cp04480e. [DOI] [PubMed] [Google Scholar]
- [28].Roser JE, Ricca A, Allamandola LJ. Astrophys J. 2014;783:97. [Google Scholar]
- [29].Rapacioli M, Calvo F, Joblin C, Parneix P, Spiegelman F. J Phys Chem A. 2007;111:2999. doi: 10.1021/jp068821z. [DOI] [PubMed] [Google Scholar]
- [30].Ricca A, Charles Jr, Bauschlicher W, Allamandola LJ. Astrophys J. 2013;776:31. [Google Scholar]
- [31].Friha H, Féraud G, Pino T, Parneix P, Dhaouadi Z, Bréchignac Ph. EAS Publ Ser. 2012;58:373. [Google Scholar]
- [32].Joblin C, Dontot L, Garcia GA, Spiegelman F, Rapacioli M, Nahon L, Parneix P, Pino T, Bréchignac P. J Phys Chem Lett. 2017;8:3697. doi: 10.1021/acs.jpclett.7b01546. [DOI] [PMC free article] [PubMed] [Google Scholar]
- [33].Rapacioli M, Calvo F, Joblin C, Parneix P, Toublanc D, Spiegelman F. Astron Astrophys. 2006;460:519. [Google Scholar]
- [34].Montillaud J, Joblin C. Astron Astrophys. 2014;567:A45. doi: 10.1051/0004-6361/201425338. [DOI] [PMC free article] [PubMed] [Google Scholar]
- [35].Dontot L, Spiegelman F, Rapacioli M. J Phys Chem A. 2019 doi: 10.1021/acs.jpca.9b07007. [DOI] [PMC free article] [PubMed] [Google Scholar]
- [36].Rapacioli M, Spiegelman FF. Eur Phys J D. 2009;52:55. [Google Scholar]
- [37].Goulart M, Kuhn M, Rasul B, Postler J, Gatchell M, Zettergren H, Scheier P, Echt O. Phys Chem Chem Phys. 2017;19:27968. doi: 10.1039/c7cp04999d. [DOI] [PubMed] [Google Scholar]
- [38].Beitz T, Laudien R, Löhmannsröben H-G, Kallies B. J Phys Chem A. 2006;110:3514. doi: 10.1021/jp055335n. [DOI] [PubMed] [Google Scholar]
- [39].Birer Ö, Yurtsever E. J Mol Struct. 2015;1097:29. [Google Scholar]
- [40].Podeszwa R. J Chem Phys. 2010;132 doi: 10.1063/1.3300064. 044704. [DOI] [PubMed] [Google Scholar]
- [41].Sancho-García JC, Pérez-Jiménez AJ. Phys Chem Chem Phys. 2009;11:2741. doi: 10.1039/b821748c. [DOI] [PubMed] [Google Scholar]
- [42].Fioressi SE, Binning RC, Bacelo DE. Chem Phys Lett. 2008;454:269. doi: 10.1016/j.cplett.2008.02.007. [DOI] [PMC free article] [PubMed] [Google Scholar]
- [43].Obolensky OI, Semenikhina VV, Solov’yov AV, Greiner W. Int J Quantum Chem. 2007;107:1335. [Google Scholar]
- [44].Piacenza M, Grimme S. J Am Chem Soc. 2005;127:14841. doi: 10.1021/ja053613q. [DOI] [PubMed] [Google Scholar]
- [45].Rapacioli M, Spiegelman F, Talbi D, Mineva T, Goursot A, Heine T, Seifert G. J Chem Phys. 2009;130 doi: 10.1063/1.3152882. 244304. [DOI] [PubMed] [Google Scholar]
- [46].Zhao Y, Truhlar DG. J Phys Chem C. 2008;112:4061. [Google Scholar]
- [47].Bartolomei M, Pirani F, Marques JMC. J Phys Chem C. 2017;121:14330. [Google Scholar]
- [48].Hernández-Rojas J, Calvo F, Wales DJ. Phys Chem Chem Phys. 2016;18:13736. doi: 10.1039/c6cp00592f. [DOI] [PubMed] [Google Scholar]
- [49].Hernández-Rojas J, Calvo F, Niblett S, Wales DJ. Phys Chem Chem Phys. 2017;19:1884. doi: 10.1039/c6cp07671h. [DOI] [PubMed] [Google Scholar]
- [50].Pascazio L, Sirignano M, D’Anna A. Combust Flame. 2017;185:53. [Google Scholar]
- [51].Rapacioli M, Calvo F, Spiegelman F, Joblin C, Wales DJ. J Phys Chem A. 2005;109:2487. doi: 10.1021/jp046745z. [DOI] [PubMed] [Google Scholar]
- [52].Schmidt M, Masson A, Bréchignac C. Int J Mass Spectrom. 2006;252:173. [Google Scholar]
- [53].Holm AIS, Zettergren H, Gatchell M, Johansson HAB, Seitz F, Schmidt HT, Rousseau P, Ławicki A, Capron M, Domaracka A, Lattouf E, et al. J Phys Conf Ser. 2012;388 012051. [Google Scholar]
- [54].Johansson HAB, Zettergren H, Holm AIS, Seitz F, Schmidt HT, Rousseau P, Ławicki A, Capron M, Domaracka A, Lattouf E, Maclot S, et al. Phys Rev A. 2011;84 043201. [Google Scholar]
- [55].Holm AIS, Zettergren H, Johansson HAB, Seitz F, Rosén S, Schmidt HT, Ławicki A, Rangama J, Rousseau P, Capron M, Maisonny R, et al. Phys Rev Lett. 2010;105 doi: 10.1103/PhysRevLett.105.213401. 213401. [DOI] [PubMed] [Google Scholar]
- [56].Gatchell M, Rousseau P, Domaracka A, Stockett MH, Chen T, Schmidt HT, Chesnel JY, Méry A, Maclot S, Adoui L, Huber BA, et al. Phys Rev A. 2014;90 022713. [Google Scholar]
- [57].Seitz F, Holm AIS, Zettergren H, Johansson HaB, Rosén S, Schmidt HT, Ławicki A, Rangama J, Rousseau P, Capron M, Maisonny R, Domaracka A, et al. J Chem Phys. 2011;135 doi: 10.1063/1.3622589. 064302. [DOI] [PubMed] [Google Scholar]
- [58].Rousseau P, Ławicki A, Holm AIS, Capron M, Maisonny R, Maclot S, Lattouf E, Johansson HAB, Seitz F, Méry A, Rangama J, et al. Nucl Instrum Methods Phys Res Sect B Beam Interact Mater At. 2012;279:140. [Google Scholar]
- [59].Delaunay R, Gatchell M, Rousseau P, Domaracka A, Maclot S, Wang Y, Stockett MH, Chen T, Adoui L, Alcamí M, Martín F, et al. J Phys Chem Lett. 2015;6:1536. doi: 10.1021/acs.jpclett.5b00405. [DOI] [PubMed] [Google Scholar]
- [60].Gatchell M, Zettergren H. J Phys B At Mol Opt Phys. 2016;49 162001. [Google Scholar]
- [61].Domaracka A, Delaunay R, Mika A, Gatchell M, Zettergren H, Cederquist H, Rousseau P, Huber A. Phys Chem Chem Phys. 2018;20:15052. doi: 10.1039/c8cp01179f. [DOI] [PubMed] [Google Scholar]
- [62].Delaunay R, Mika A, Domaracka A, Huber BA, Rousseau P. Eur Phys J D. 2018;72:149. [Google Scholar]
- [63].Zhen J, Chen T, Tielens AGGM. Astrophys J. 2018;863:128. [Google Scholar]
- [64].Chen D, Totton TS, Akroyd JWJ, Mosbach S, Kraft M. Carbon. 2014;67:79. [Google Scholar]
- [65].Heinemann T, Palczynski K, Dzubiella J, Klapp SHL. J Chem Phys. 2015;143 doi: 10.1063/1.4935063. 174110. [DOI] [PubMed] [Google Scholar]
- [66].Chirot F, Zamith S, Labastie P, L’Hermite J-M. Rev Sci Instrum. 2006;77 063108. [Google Scholar]
- [67].Braud I, Zamith S, L’Hermite J-M. Rev Sci Instrum. 2017;88 doi: 10.1063/1.4979639. 043102. [DOI] [PubMed] [Google Scholar]
- [68].Klots CE, Für Z. Phys At Mol Clust. 1987;5:83. [Google Scholar]
- [69].Seifert G, Porezag D, Frauenheim T. Int J Quantum Chem. 1996;58:185. [Google Scholar]
- [70].Elstner M, Porezag D, Jungnickel G, Elsner J, Haugk M, Frauenheim Th, Suhai S, Seifert G. Phys Rev B. 1998;58:7260. [Google Scholar]
- [71].Porezag D, Frauenheim Th, Köhler Th, Seifert G, Kaschner R. Phys Rev B. 1995;51 doi: 10.1103/physrevb.51.12947. 12947. [DOI] [PubMed] [Google Scholar]
- [72].Hansmann UHE. Chem Phys Lett. 1997;281:140. [Google Scholar]
- [73].Calvo F. J Chem Phys. 2005;123 doi: 10.1063/1.2036969. 124106. [DOI] [PubMed] [Google Scholar]
- [74].Forst W. Unimolecular Reactions. A Concise Introduction. Cambridge University Press; 2003. [Google Scholar]
- [75].Peslherbe GH, Hase WL. J Phys Chem A. 2000;104 10556. [Google Scholar]
- [76].Peslherbe GH, Hase WL. J Chem Phys. 1996;105:7432. [Google Scholar]
- [77].Peslherbe GH, Hase WL. J Chem Phys. 1994;101:8535. [Google Scholar]
- [78].Calvo F, Parneix P. J Chem Phys. 2003;119:256. [Google Scholar]
- [79].Parneix P, Calvo F. J Chem Phys. 2003;119:9469. [Google Scholar]
- [80].Calvo F, Parneix P. J Chem Phys. 2004;120:2780. doi: 10.1063/1.1633258. [DOI] [PubMed] [Google Scholar]
- [81].Gussoni M, Rui M, Zerbi G. J Mol Struct. 1998;447:163. [Google Scholar]
- [82].Wong W-K, Westrum EF. J Chem Thermodyn. 1971;3:105. [Google Scholar]
- [83].Mulas G, Falvo C, Cassam-Chenaï P, Joblin C. J Chem Phys. 2018;149 doi: 10.1063/1.5050087. 144102. [DOI] [PMC free article] [PubMed] [Google Scholar]
- [84].Joalland B, Rapacioli M, Simon A, Joblin C, Marsden CJ, Spiegelman F. J Phys Chem A. 2010;114:5846. doi: 10.1021/jp911526n. [DOI] [PubMed] [Google Scholar]
- [85].Roux MV, Temprado M, Chickos JS, Nagano Y. J Phys Chem Ref Data. 2008;37:1855. [Google Scholar]
- [86].Weerasinghe S, Amar FG. J Chem Phys. 1993;98:4967. [Google Scholar]
- [87].Calvo F, Douady J, Spiegelman F. J Chem Phys. 2010;132 doi: 10.1063/1.3280168. 024305. [DOI] [PubMed] [Google Scholar]
- [88].Rapacioli M, Simon A, Dontot L, Spiegelman F. Phys Status Solidi B. 2012;249:245. [Google Scholar]
- [89].Ando N, Mitsui M, Nakajima A. J Chem Phys. 2007;127 doi: 10.1063/1.2805185. 234305. [DOI] [PubMed] [Google Scholar]
Associated Data
This section collects any data citations, data availability statements, or supplementary materials included in this article.


