

SUMMARY
Germinal centers (GC) are crucial for the formation of long-lived humoral immunity. Many pathogens suppress GC, including Salmonella enterica serovar Typhimurium (STm), but the mechanisms driving suppression remain unknown. We report that neither plasmablasts nor STm-specific B cells are required for GC suppression in mice. Rather, we identify that interleukin-12 (IL-12), but not interferon-γ (IFN-γ), directly suppresses T follicular helper (Tfh) cell differentiation of T cells intrinsically. Administering recombinant IL-12 during nitrophenyl-Chicken Gamma Globulin (NP-CGG) immunization also suppresses Tfh cell differentiation and GC B cells, indicating that IL-12 is sufficient to suppress Tfh cell differentiation independent of STm infection. Recombinant IL-12 induces high levels of T-bet, and T-bet is necessary for Tfh cell suppression. Therefore, IL-12 induced during STm infection in mice contributes to GC suppression via suppression of Tfh cell differentiation. More broadly, these data suggest that IL-12 can tailor the proportions of humoral (Tfh cell) and cellular (T helper type 1 [Th1] cell) immunity to the infection, with implications for IL-12 targeting therapies in autoimmunity and vaccination.
In Brief
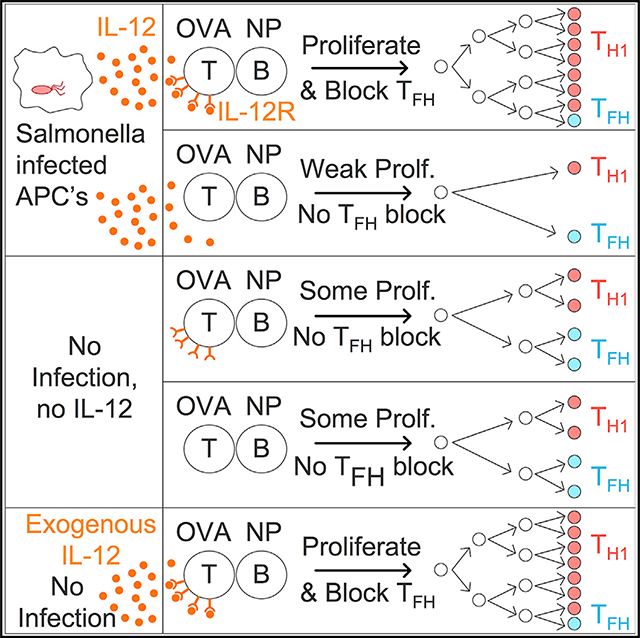
Salmonella infection inhibits germinal centers. Elsner et al. show that infection-driven IL-12 induced high T-bet expression in T cells, thereby suppressing Tfh cell differentiation. Administering recombinant IL-12 in the absence of infection recapitulated these effects. IL-12 thus regulates Tfh cell versus Th1 cell balance, contributing to germinal center suppression during Salmonella infection.
Graphical Abstract
INTRODUCTION
Germinal centers (GC) are tightly regulated niches that support affinity maturation of antibodies and the generation of memory B cells and long-lived plasma cells, hallmarks of humoral immunity. Multiple pathogens of diverse classes induce poor or delayed GC responses, which could represent either a pathogen-evasion or host-adaptation strategy (Nothelfer et al., 2015). In either case, the consequences are significant with respect to the establishment of long-lived memory B cell and plasma cell compartments, both of which are thought to derive chiefly from the GC (Weisel and Shlomchik, 2017). In mouse models of Salmonella enterica serovar Typhimurium (STm) infection, the B cell response is composed of unusually low-affinity short-lived plasmablasts (PBs) (Di Niro et al., 2015), and GC formation is delayed until host immunity controls the infection (Cunningham et al., 2007; Nanton et al., 2015), typically many weeks. For this and some other infection models, if an unrelated immunization is given during infection, the GC response induced by immunization is also reduced, thus demonstrating that GC are dominantly suppressed during these infections (Elsner et al., 2015; Fallet et al., 2016; Nanton et al., 2015; Nothelfer et al., 2015; Racine et al., 2010; Ryg-Cornejo et al., 2016; Sammicheli et al., 2016).
The mechanisms by which STm suppresses GC responses have not been elucidated, yet they have high relevance to public health and vaccine design. Non-typhoidal and typhoid STm globally account for over 100 million cases of disease and nearly 1 million deaths annually (Crump et al., 2004; Keestra-Gounder et al., 2015; Majowicz et al., 2010). Molecular typing of bacterial isolates provided evidence of reinfection and implies poor development of immune memory in these cases (Okoro et al., 2012).
There are multiple ways by which GC responses could be suppressed in the context of STm infection. STm has been shown to infect B cells in a B cell receptor (BCR)-specific manner (Rosales-Reyes et al., 2005; Souwer et al., 2012), and STm encodes multiple secretion systems that inject bacterial effector proteins to modulate host cell functions (Galán et al., 2014; LaRock et al., 2015); hence, it could directly reprogram responsive B cells. Alternatively, the large number of PBs induced by the infection could secrete suppressive antibodies or cytokines (Hess et al., 2013) or simply reflect the differentiation of all STm-specific B cells to PBs at the expense of GCs. Potentially consistent with this hypothesis, mouse infection with lymphocytic choriomeningitis virus (LCMV) clone 13 inhibits early B cell responses through type I interferon (IFN)-mediated deletion of activated B cells and possibly through terminal differentiation into short-lived PBs (Fallet et al., 2016; Moseman et al., 2016; Sammicheli et al., 2016). GCs could also be suppressed indirectly, since GC formation relies on many migration molecules and cell-cell contacts. Lymph node architecture is disrupted after injection of STm (St John and Abraham, 2009), but this does not explain GC suppression, because disruption requires STm lipopolysaccharide (LPS) and host TLR4 expression, but knocking out TLR4 or MyD88 does not restore GCs (Di Niro et al., 2015).
Another target for GC disruption by STm could be T follicular helper (Tfh) cells (Butler and Kulu, 2015; Vinuesa et al., 2016). STm is known to target T cell function via several pathways (Kullas et al., 2012; Ertelt et al., 2011; Srinivasan et al., 2009). During STm infection, high-affinity T cells responding to even a bystander antigen (Ag) contract at a much faster rate and magnitude in infected mice, an effect termed “T cell culling” (Ertelt et al., 2011; Srinivasan et al., 2009). Other groups have reported that conventional CXCR5+ PD-1hi CD4+ Tfh cells are not observed during STm infection (Lee et al., 2011; Trüb et al., 2017). PD-1low CXCR5low T cells isolated from STm infection express transcripts associated with T helper type 1 (Th1) cell more than Tfh cell differentiation (Trüb et al., 2017). Th1 and Tfh cells appear to bifurcate from common precursors, and Tfh cell differentiation can be repressed by multiple Th1 cell signals (Lönnberg et al., 2017; Nakayamada et al., 2011; Shaw et al., 2016; Weinmann, 2014). Hence, skewing toward a Th1 cell response by as-yet-undefined mechanisms could be another way by which STm suppresses the overall GC response.
Given these multiple potential and nonexclusive pathways by which STm could suppress the GC response, we undertook a systematic and comprehensive study to address these via a combination of cell transfer, genetic, chimera, and in vivo infusion studies. We found that STm elicits a host response environment that is required for GC suppression and that this acts on Tfh cell differentiation by a previously unreported mechanism. We report here that in a strongly Th1-cell-dominant immune response, interleukin-12 (IL-12) suppresses Tfh cell differentiation in a T-cell-intrinsic manner. Recombinant IL-12 treatment of NP-CGG-immunized mice was sufficient to suppress Tfh cell and GC development in the absence of STm infection. IL-12 drove high T-bet expression in T cells, and T-bet was also necessary for Tfh cell suppression during STm infection. However, blocking IL-12 signaling did not restore the GC. Therefore, IL-12 contributes to GC suppression during STm infection, but additional mechanisms remain to be discovered. Our findings provide basic insights into the control of Tfh cell differentiation and have implications for understanding STm pathogenesis and for vaccine design.
RESULTS
STm Suppresses GCs but Enhances PBs Induced by an Unrelated Antigen
STm that expresses ovalbumin (OVA) can suppress the GC response to a concurrently administered OVA immunization, yet whether STm must express the antigen itself is not known (Nanton et al., 2015). To determine if GC suppression is extrinsic to the responding B cells and rule out the possibility that infected mice lack precursor B cells of sufficient affinity to produce GCs, we investigated the response to NP-CGG immunization administered during STm infection. Both the frequency (Figures 1A, S1A, and S1B) and number (Figure 1B) of nitrophenyl (NP)-specific GC B cells (CD95+ CD38lo) were strongly reduced in the STm + NP group compared to NP-only controls, despite the total number of NP-specific B cells being equal or greater in the STm + NP group (Figure S1C). Similar results were obtained using B18+/− C57BL/6 mice, which express a recombined heavy chain (B18i) that, when paired with the lambda-1 light chain, confers specificity to NP, thereby raising the precursor frequency of NP-specific B cells (Figures 1C and S1D–S1F).
Figure 1. STm Infection Suppresses the GC Response to an Unrelated Exogenous Antigen without Affecting T-Dependent or T-Independent Plasma Cell Responses.

(A–C) C57BL/6 or B18+/− C57BL/6 mice were infected with STm on day −3 and immunized with NP-CGG on day 0, and spleens were examined 16 days after immunization. Controls received either NP-CGG or STm only.
(A) Representative flow cytometry dot plots of NIP-binding B cells pre-gated on live singlet 4-hydroxy-3-iodo-5-nitrophenylitic acid (NIP)-binding B cells. Gates indicate GC B cells from C57BL/6 mice.
(B and C) Number of NIP-binding GC B cells quantified per spleen from C57BL/6 (B) or B1–8 Igh knockin [KI] C57BL/6 (C). One representative experiment of two is shown from C57BL/6 mice and one experiment in B1–8+/−C57BL/6 mice.
(D and E) C57BL/6 mice were given heat-killed STm control (Ctl) or STm infection (Inf) on day −3 and then on day 0 immunized with either NP-Ficoll (D) or NP-CGG in alum (E), and splenic ELISPOTs were quantified on day 4. For each condition, data were pooled from two independent experiments.
For all panels, data points indicate individual mice (n = 3–6 per group) and bars the mean ± SD. In (B)–(E), statistical significance was calculated by one-tailed Student’s t test (NS, not significant; *p < 0.05, **p < 0.01, ***p < 0.001).
To determine whether B cell suppression is specific to GCs or broadly applies to all aspects of the B cell response, we quantified the early antibody-forming cell (AFC) responses to the T-dependent antigen NP-CGG and the T-independent antigen NP-Ficoll during STm infection by ELISPOT. For this and subsequent experiments, control mice were given heat-killed STm immunization, which does not suppress GCs (Nanton et al., 2015), to more closely replicate the antigen environment of infection. For simplicity these will be referred to as “control” in both text and figures. STm-infected NP-Ficoll-immunized groups had higher numbers of both immunoglobulin M (IgM) and IgG NP-specific AFCs per spleen than controls (Figure 1D). Similar results were obtained with NP-CGG immunization; in contrast to the GC response, STm infection induced more IgM AFCs and equivalent numbers of IgG, NP-specific AFCs per spleen (Figure 1E) compared to controls. Thus, STm infection specifically inhibits GC responses while promoting the immediate effector arm of humoral immunity.
Plasma Cells Are Not Required for GC Suppression
We next wondered if the massive PB response observed during STm infection might produce GC-suppressive signals by stimulating inhibitory cytokine secretion or inhibitory FcgR2 (Fillatreau, 2016; Neves et al., 2010; Rosser and Mauri, 2015; Shen et al., 2014; Tiller et al., 2010). To test this, we infected CD19-Cre BLIMP-1 flox/flox (B BLIMP knockout [KO]) mice, which are not able to make plasma cells (Corcoran and Tarlinton, 2016), followed with NP-CGG immunization, as in Figure 1 (Figure S2A). There was a trend toward more strongly suppressed GC among NP-specific B cells and higher bacterial burdens in infected B cell BLIMP KO mice compared to WT controls (Figures S2B and S2C), but this did not reach statistical significance. We next examined STm-induced GC, which normally begin to accumulate by day 28 of infection (Cunningham et al., 2007; Di Niro et al., 2015), hypothesizing that if PBs suppress GCs, there would be faster GC induction in BLIMP-1 KO mice (Figure S2D) (Di Niro et al., 2015). Again, no significant increase in GCs was found in B cell BLIMP-1 KO mice compared to either control group (Figure S2E) despite the strong reduction in the number of IgM and IgG AFCs per spleen in the experimental group (Figure S2F). B cell BLIMP-1 KO mice had a slightly but significantly higher bacterial burden (Figure S2G), which correlated with higher spleen weights (Figure S2H), both as expected based on previous reports (Nanton et al., 2012). Thus, blocking PB differentiation did not restore GCs during STm infection.
STm-Specific B Cells Are Not Required for GC Suppression
To determine whether activated STm-specific B cells could suppress GC, we used two different BCR-restricted BALB/c strains (B18 Vk8R BCR KI and AM14 BCR KI), which express heavy- and light-chain site-directed transgenes in every B cell. These mice mount markedly reduced B cell responses to STm and hence have few if any STm-specific B cells (Di Niro et al., 2015). We transferred NP-specific B cells and OVA-specific DO11.10 T cells to these BCR-restricted recipients prior to STm infection and NP-OVA immunization and examined GC and Tfh cell differentiation among them (Figure 2A). At day 4, NP-specific B cells had expanded equally in both BCR-restricted and control wild-type (WT) hosts (Figure 2B), and equal frequencies of early-GC phenotype B cells were observed (Figure S3A). On day 13, NP-specific GC B cells were suppressed in the BCR-restricted and WT hosts in number (Figure 2C, right) and among BCR-restricted hosts also in frequency (Figures 2D and S3B), with infected BCR-restricted recipients showing even more, not less, suppression of GC formation. The frequency of GCs in WT hosts was not reduced in this experiment, likely because NP-OVA was administered the same day as STm infection rather than 3 days afterward as in previous experiments. In BCR-restricted recipients, there was also a slight but significant decrease in the total number of NP-specific B cells at day 13 (Figure 2C, left), possibly related to the strongly reduced number of GC B cells. Equal numbers of DO11+ T cells were present at both day 4 and day 13 for all BCR-restricted recipients (Figures S3C and S3D). There were slightly reduced numbers of DO11+ T cells in the spleens of infected WT recipients (Figures S3D and S3E), the mechanism of which will be addressed below. No differences were observed between recipient groups in bacterial burden or spleen size at day 13 (Figures S3F–S3H, black and gray bars). Collectively, these data show that GC suppression is independent of the presence of STm-specific B cells.
Figure 2. STm-Specific B Cells Are Not Required for NP-Specific GC Suppression.

(A) Experimental outline; BALB/c, BCR-restricted AM14 BCR knockin (AM14 KI) BALB/c, or B18+/+ heavy VK8R+/− light-chain knockin (B18 Vk8R KI) mice received purified NP-specific B and OVA-specific DO11.10+ CD4+ T cells on day −1, Ctl or STm infection (Inf) on day 0, and NP-OVA in alum 3 h later. Splenic NP-specific B cells and DO11+ T cells were analyzed by flow cytometry on days 4 and 13 post-immunization.
(B and C) NP-specific B cells at day 4 (B) and NP-specific B cells and GC B cells per spleen at 13 days post-NP-OVA (C).
(D) Representative flow cytometry plots, 5% contour with outliers, of live, singlet, NP-specific B cells with gate drawn around GC B cells on day 13 post-NP-OVA. Numbers indicate frequencies of cells in the gate.
In (B) and (C), data points indicate individual mice (n = 3–7 per group) and bars the mean ± SD of three experiments pooled. Statistical significance was calculated by one-tailed Student’s t test (NS, not significant; *p < 0.05, **p < 0.01, ***p < 0.001).
STm-Specific B Cells Are Required for T Cell Culling, but Culling Is Not Required for GC Suppression
T cell culling is a phenomenon associated with STm infection in which T cells responding with high affinity to any antigen are rapidly lost compared to controls (Ertelt et al., 2011; Srinivasan et al., 2009). Since there was a modest but significant loss of T cells observed in BALB/c hosts comparing control and infected groups, whereas no loss was observed in the BCR-restricted hosts (Figure S3E), we considered whether T cell culling, which in turn would curtail the GC, requires STm-specific B cells. To test this, we modified our system to resemble published studies (Srinivasan et al., 2009) using OTII T cells (Figure 3A). At day 4, OTII cells had expanded equally in both BCR-restricted and WT hosts (Figure 3B, left). At day 17, there were significantly fewer OTII T cells remaining in the infected group compared to controls in C57BL/6 recipients (Figure 3B, right). However, infection did not affect the number of OTII T cells in BCR-restricted recipients (Figures 3B and 3C). To control for the slight differences in expansion of the OTII T cells at day 4 among the groups and the normal contraction of T cells, we compared the numbers of OTII cells remaining at day 17 relative to day 4. The infected WT recipients lost OTII T cells to a much greater extent than the BCR-restricted recipients, with a 10-fold loss in WT compared to a 1.4-fold loss in BCR restricted mice between days 4 and 17, respectively. Thus, STm-specific B cells are required for culling of OTII T cells during STm infection. Nonetheless, despite the equal numbers of OTII cells remaining at day 17 in the control and infected BCR-restricted recipients (Figure 3B, right) and the equal expansion of NP-specific B cells at day 4 in all groups (Figure 3D, left), GC suppression was still observed in the BCR-restricted animals (Figure 3D, right, and Figure 3E). Thus, STm-specific B cells are required for T cell culling, but T cell culling does not account for GC suppression.
Figure 3. STm-Specific B Cells Are Required for T Cell Culling, but Culling Is Not Required for GC Suppression.

(A) Experimental outline. CD45.1 C57BL/6 controls or B18+/− Vk8R+/− CD45.1/2 mice, which contain few STm-specific B cells (“Irrelevant BCR KI”) but do have some endogenous NP-specific B cells, received CD45.2 NP-specific B cells and CD45.2 OTII OVA-specific T cells on day −1, control (Ctl) or STm infection (Inf) on day 0, and NP-OVA immunization 3 h later. Splenic T and B cells were analyzed on days 4 and 17.
(B) Numbers of CD45.2 OTII CD4+ T cells were quantified on days 4 (left) and 17 (right).
(C) Example FACS plots delineating the percent CD45.2+ CD45.1− OTII cells among live, singlet, CD4+ cells at day 17.
(D) The number of NP-specific B cells at day 4 (left) and NP-specific GC B cells at day 17 (right) per spleen.
(E) Example flow cytometry plots delineating the percentage of GCs among either total NP-specific B cells or CD45.2+ donor-derived NP-specific B cells at day 17; all were pre-gated on live, singlet, NIP+ CD19+ cells.
In (B) and (D), data were pooled from two individual experiments, each with n = 4–8 mice per group. Data points indicate individual mice and bars the mean ± SD. Statistical significance was calculated by two-tailed Student’s t test, except day 17 GC B cell number, which was calculated by Mann-Whitney test (for all, NS, not significant, *p < 0.05, **p < 0.01, ***p < 0.001).
Early STm Infection Induces GC-Phenotype B Cells but Few Tfh Cells
Equal numbers of NP-specific B cells were observed at day 4 post-immunization, regardless of infection status (Figures 2B and 3D), suggesting that during STm infection, GC either never develop, or are not maintained over time. To address this, we analyzed GC formation at additional times after infection/immunization using the same system as Figure 2A, which eliminates T cell culling as a confounding factor. Equal numbers of GC-phenotype NP-binding B cells formed up to day 10 in spleens of both control and infected mice (Figures 4A and S4A), yet by day 13, GCs were significantly decreased in infected mice. Analysis of other phenotypic characteristics of the putative GC B cells at day 7 revealed that Bcl-6 protein and peanut agglutinin (PNA) staining were reduced in cells from infected mice (Figure S4A), commensurate with the reported lack of histologic GCs at this time (Cunningham et al., 2007). This suggests that during STm infection, B cells may initiate a GC program, but not achieve complete differentiation and not form histologic GCs. GC failure has been observed when there is insufficient T cell help for the GC (de Vinuesa et al., 2000). We examined Tfh cell differentiation among OVA-specific DO11.10 T cells (Figure S4B) and found there were drastically (8- to 10-fold) fewer DO11+ Tfh cells (CXCR5high PD-1high) in infected spleens compared to controls (Figures 4B and 4C), despite finding only slightly reduced total numbers of DO11+ T cells (Figures S4C–S4E). This suggests that during STm infection, B cells may be intrinsically capable of forming GCs, but that they lack sufficient Tfh cell help to be maintained long-term.
Figure 4. Tfh Cell Differentiation Appears to Be Suppressed by STm Infection prior to GC Suppression.

(A–C) BALB/c B18 Vk8R KI host mice were treated as described in Figure 3A, and NP-specific GC B cells (A) and DO11+ Tfh cells (B and C) were quantified at the time points indicated. Data are pooled from three independent experiments with three to five mice per group per time point. Data points indicate the mean and error bars ± SD. Statistical significance was calculated by two-way ANOVA. (C) Representative FACS plots of Tfh cell on day 7 post-infection/immunization pre-gated on live, singlet, DO11+ CD4+ cells.
(D–G) BALB/c B18 Vk8R KI host mice were treated as in Figure 3A, except they received 100 μg NP-OVA at immunization and additional injections of either PBS control or 200 μg soluble NP-OVA in PBS boost at day 3 post-immunization.
(D) Representative flow cytometry plots of DO11+ CD4+ T cells from each group at day 7 post-initial immunization.
(E–G) Percentage of Tfh cells among DO11+ T cells (E), numbers of DO11+ Tfh cells (F), and total DO11+ CD4+ T cells (G) quantified at day 7 post-initial immunization.
Data are pooled from two individual experiments, with n = 5 mice per group for each experiment. Data points indicate individual mice, bars indicate the mean, and error bars indicate ± SD. Statistical significance was calculated by two-tailed Student’s t test (NS, not significant; *p < 0.05, **p < 0.01, ***p < 0.001, ****p < 0.0001).
Antigen-specific T cells have been observed within the B cell follicle of STm-infected mice (Trüb et al., 2017); therefore, to explain the failure of Tfh cell differentiation, we hypothesized that the quality of T cell–B cell (T–B) contacts may not be sufficient for Tfh cell differentiation. To test our hypothesis, we provided an antigen boost as described by Deenick et al. (2010), who showed that the role of B cells in Tfh cell development can be bypassed by injection of additional soluble antigen, which promotes persistent T cell–dendritic cell (T–DC) interactions. In noninfected controls, boosting compared to normal immunization did not significantly affect frequencies of Tfh cells among DO11+ cells (Figure 4D). However, boosting strongly increased numbers of DO11+ Tfh cells (Figure 4F) due to an increase in total DO11+ T cells (Figure 4E). In contrast, during STm infection, boosted mice had yet a lower frequency of Tfh cell (Figure 4E) and no net increase of Tfh cells (Figure 4F), even though they had an increase in total DO11+ T cells (Figure 4G) and equal bacterial burdens (Figure S4F). These observations suggest that during infection, Tfh cell differentiation, not the T cell response in general, is specifically suppressed.
GC and Tfh Cells Primed during STm Infection Can Be Rescued by Transfer to Uninfected Hosts
We next investigated whether early GCB cells and/or Tfh cells from STm-infected mice were irreversibly committed to a non-GC fate or rather could be rescued if transferred into an uninfected host. B cells were primed in control or STm-infected primary recipients and then transferred into control secondary recipients containing immunization-timing-matched DO11+ T cells (Figure 5A). Demonstrating that there was not irreversible commitment, the frequency of GCs among NP-specific cells was the same for both groups (Figures 5B, S5A, and S5B). Indeed, the number of GC B cells in secondary recipients was greater when they received B cells from infected donors compared to control donors (Figure 5B).
Figure 5. T and B Cells from STm-Infected Mice Can Differentiate to Tfh Cells and GCs When Transferred to Control Hosts.

(A) Experimental design for (B). NP-specific CD45.2 B cells were transferred into BCR-restricted B18 Vk8R KI 1st recipients, and OVA-specific DO11+ T cells were transferred into TS1+ Rag2 KO 2nd recipients. The next day, all mice were given either control (Ctl) or STm infection (Inf) and NP-OVA. 3 days after infection/immunization, all 1st recipient spleens were pooled into either control or infected groups, the frequency of NIP+ B cells was determined by FACS, and equal numbers of NIP+ B cells were transferred into individual 2nd recipients with a single injection of penicillin and streptomycin (Pen/Strep) to prevent transfer of infection. GC formation in 2nd recipients was assessed 7 days later.
(B) Number of NP-specific GC B cells per spleen (left) or percentage of GCs among NP-specific B cells (right) of 2nd recipient’s spleens.
(C) Experimental design for (D). Similar design as (A), except that BCR-restricted mice received DO11 T cells, TS1 mice received NP-specific B cells, and at day 3 the T cells were transferred from the 1st to 2nd recipients.
(D) Shown are the number of DO11+ PD1-high cells (left) and NP-specific GC (right) in 2nd recipient spleens.
(E) Experimental design for (F). Similar to (A), except that a common pool of B cells from control 1st recipients was transferred into either control or infected 2nd recipients without Pen/Strep treatment.
(F) Primary donor B cells were tracked as CD45.2/2 in CD45.1/2 recipients, and shown are the number of NP-specific donor (CD45.2/2) GC B cells per spleen (left),and the %GC among donor NP-specific B cells (right) of 2nd recipients. “X” indicates animals in which no donor cells could be detected.
For each set of experiments, data were pooled from two independent experiments and symbols indicate individual mice (n = 3–6 per experimental group and n = 1 for negative controls lacking either T or B cells per each replicate experiment) and bars the mean ± SD. Statistical significance was calculated by two-tailed Mann-Whitney test (NS, not significant; *p < 0.05, **p < 0.01, ***p < 0.001, ****p < 0.0001).
We next modified the transfer system to test whether DO11 T cells primed in infected mice could differentiate into Tfh cells and support GCs after transfer into control mice (Figure 5C). Regardless of whether they originated in infected or control mice, DO11+ T cells produced equal numbers of Tfh cells and supported equal numbers of NP-specific GC B cells after transfer to control hosts (Figure 5D). Thus, both B and T cells primed during STm infection can support GCs when transferred into control hosts. Therefore, initial activation and differentiation in the presence of STm is not sufficient to imprint an irreversible “non-GC” fate to either GC B cell or Tfh cell precursors. We conclude that the STm-infection-derived signals must be present persistently in order to suppress GC development.
To further investigate this, we tested the hypothesis that GC suppression is a product of the STm infection environment. Because the TS1+ Rag2KO hosts used above would succumb to STm infection, we instead used T-cell-intact BCR-restricted mice as both primary and secondary hosts, tracking GC development among CD45.2 donor B cells (Figures 5E and S5C). Even though all secondary recipients received the same transferred cells, there were significantly fewer NP-specific GC B cells and strongly reduced frequencies of GCs among donor B cells in the spleens of infected recipients (Figures 5F and S5C). Therefore, GC suppression is a product of the infected spleen microenvironment that can be imposed on B cells even if they are primed in the absence of infection.
IL-12, but Not IFN-γ, Induced during STm Infection Represses Tfh Cell Differentiation
The dominant effect of the infected environment led us to hypothesize that cytokines elicited by STm may be necessary and sufficient for suppression. Given that STm elicits a Th1 response, we tested whether IFN-γ or IL-12, key drivers of Th1 differentiation, are capable of suppressing Tfh cell differentiation during STm infection (Dougan et al., 2011; McSorley, 2014; Weinmann, 2014). We used 50–50 mixed bone marrow chimeras to assess Tfh cell differentiation of cells lacking IFNgR1 or IL-12Rb2 compared to WT cells within the same host. This approach was necessary because the Th1 response is critical for control of the infection, and this protection is afforded by the WT component of the bone marrow (BM) (Hess et al., 1996). We again immunized with NP-CGG to examine endogenous GC development.
The frequency of Tfh cells between WT and IFNgR1 KO cells was equal in both control and STm-infected hosts (Figures 6A and S6A). Hence, IFN-γ was not responsible for suppressing Tfh cell differentiation during STm infection. In contrast, the frequency of Tfh cells was greatly increased (over 10-fold) among IL12Rb2 KO cells compared to WT cells in STm-infected hosts, though still somewhat lower than KO cells in control hosts (Figure 6B). No effect of IL12Rb2 expression was seen on Tfh cell differentiation in control hosts (Figure 6B), likely due to lower levels of IL-12 production in the absence of infection. To control for the extent of engraftment of each bone marrow type, we used the ratio of WT/KO cells among CD44low naive CD4 T cells to normalize the ratio of WT/KO cells among Tfh cell cells on a per-mouse basis to quantitatively assess the competitive advantage of IL12Rb2 KO T cells to differentiate into Tfh cells (Figures S6B and S6C). Values above 1 indicate an advantage for WT cells. By this analysis, there was a competitive advantage of IL12Rb2 KO cells among CXCR5+ PD-1high Tfh cell in infected hosts only (Figure 6C). While still statistically and biologically significant, this effect was not as strong as that seen in the fraction of WT versus IL12Rb2 KO-derived T cells that differentiated to Tfh cells (Figure 6B). This was accounted for by the fact that expansion of the total IL12Rb2 KO CD44hi CD4 population was markedly less than that seen for WT cells in infected hosts (Figure 6D). This reduction in total cell expansion of KO T cells approximately compensated for the strong tendency of KO cells versus WT cells to differentiate into Tfh cells, resulting in no net difference in the total number of Tfh cells of either WT or KO cells in infected mice (Figure 6E), even though the fractional differentiation into Tfh cell was very different. Although approximately half of the T cells lacked IL12Rb2, we did not observe an increase in GC frequency in 50–50 chimeras compared to mice that received 100% CD45.1 WT bone marrow (Figure 6F), possibly reflecting the lack of net increase in Tfh cell numbers or a dominant effect of Th1 differentiation stemming from the WT BM. To examine the possibility that increased T follicular regulatory (Tfr) cells account for lack of GC restoration, we determined the frequency of FoxP3-expressing cells and found no difference between IL12R2b WT and KO cells in infected mice (Figure 6G). There were actually reduced Tfr cells in infected mice compared to controls, making this an unlikely explanation for GC suppression.
Figure 6. IL-12 Induced by STm Infection Suppresses Tfh Cell Differentiation.

(A) C57BL/6 BCR-restricted CD45.1/2 mice were irradiated and reconstituted with a mixture of 50% CD45.1 and 50% CD45.2 IFNgR1 KO bone marrow. Mice were rested for at least 8 weeks and then given either control (Ctl) or STm infection (Inf) followed by NP-CGG immunization 2 days later. Spleens were analyzed 12 days after NP-CGG immunization. Shown are example flow cytometry plots gated on live singlet CD4+ CD45R− CD44high cells and either CD45.1 WT cells or CD45.2 IFNgR1KO cells with gates and numbers indicating the percentage of Tfh cell among either cell type. Chart depicts data pooled from two individual experiments.
(B–G) Same as (A), except that mice were reconstituted with 50% CD45.1 and 50% CD45.2 IL-12Rb2 KO bone marrow. (B) Representative flow cytometry plots gated on live singlet CD4+ CD45R− CD44high cells and either CD45.1 WT cells or CD45.2 IL12Rb2 KO cells. Gates delineate Tfh and numbers are the percentages of Tfh among cells from the indicated parental gate. Chart depicts data pooled from two individual experiments.
(C) The competitive advantage of WT or IL-12Rb2 KO in Ctl or Inf hosts; values greater than 1 indicate WT advantage and below 1 indicate KO advantage.
(D and E) Number of CD44high CD4+ T cells of (D) and CD44high CXCR5+ PD1high Tfh cells (E) per spleen.
(F) Percentage of GC B cells among only CD45.1 WT NP-specific B cells per spleen.
(G) Percentage of Tfh cells that express FoxP3 (Tfr cells) among WT or IL12Rb2 KO Tfh cells.
(H) B18+/− BALB/c mice immunized with NP-CGG were given injections of recombinant murine IL-12p70 or PBS at days 2, 4, 6, and 8 after immunization, and splenic T and B cells were analyzed at day 9. One group was infected with STm 3 days prior to NP-CGG immunization as an additional comparison. Data were pooled from two individual experiments, where each experiment contained all groups except that the IL-12 group received 200 ng doses in one experiment and 400 ng doses in the other. Symbols represent individual mice (n = 3–7 per group) and bars the mean ± SD. Statistical significance was calculated by two-tailed Student’s t test (NS, not significant; *p < 0.05, **p < 0.01, ***p < 0.001, ****p < 0.0001). Additionally, for (C) each group was compared to the hypothetical mean of no competitive advantage, 1, by one-sample t test, shown above each individual bar (NS, not significant; **p < 0.0021).
To determine whether IL-12 is sufficient to suppress Tfh cell differentiation, we administered recombinant murine IL-12 (rIL-12) during an NP-CGG immune response. Two doses of rIL-12 (200 or 400 ng per injection) were evaluated. Both doses suppressed the frequency of Tfh cells among ICOS+ CD4 T cells (Figures 6H and S6D), though the total number of Tfh cells was only suppressed at the 200 ng dose (Figure S6E), which was due to the net increase of lymphocytes when 400 ng was administered (Figure S6F). Both the frequency and number of NP-specific GC B cells was reduced by both treatment doses (Figures 6H and S6G). As expected based on the known role of IL-12 in promoting Th1 differentiation, the frequency of T-bet+ cells among ICOS+ T cells was greatly increased by both treatment doses. The number of T-bet+ cells increased in a dose-dependent manner, with the 400-ng group having T-bet+ T cell numbers comparable to those observed in STm-infected mice (Figures 6H and S6H). Treatment with 400 ng rIL-12 was also sufficient to induce the very high T-bet expression level observed in STm-infected mice (Figure S6I). Thus, IL-12 is sufficient to suppress the Tfh cell and GC response to an immunization even in the absence of STm infection.
T-bet Suppresses Tfh Cell Differentiation but Promotes CD4 T Cell Expansion during STm Infection
We next investigated how IL-12 suppresses Tfh cell differentiation. As IL-12 induces T-bet, a transcription factor associated with Th1 differentiation (Kallies and Good-Jacobson, 2017), we tested its role using mixed BM chimeras as in Figure 6, with 50–50 WT and CD4-Cre × T-betfl/fl bone marrow. Indeed, T-bet-deficient T cells also showed significantly increased frequencies of Tfh cells in infected mice (Figures 7A–7D and S7A); hence, a major mechanism by which IL-12 regulates Tfh cell differentiation is via T-bet induction. Tfh cells that did form during infection expressed lower levels of Bcl-6 compared to controls, but T-bet deficiency restored Bcl-6 expression (Figures 7A and S7B). CXCR5 expression was unchanged by STm infection, while PD-1 was suppressed by infection and partially restored among T-bet-deficient Tfh cells (Figures S7C and S7D). T-bet expression was significantly increased in WT Tfh cells from infected mice compared to controls but was markedly lower than that in CD44high non-Tfh cells (Figure S7E). STm induced high amounts of T-bet compared to controls, but only in WT- and not KO-derived T cells (Figures 7E and 7F). T-bet was required for the massive expansion of CD44high cells observed only in infected mice (Figures 7G, S7F, and S7G) and as expected was required for IFN-γ production (Figures S7H and S7I). Thus, during STm infection, IL-12 drives T-bet expression, which suppresses Tfh cell differentiation to redirect T cells toward Th1 immunity.
Figure 7. T-bet Is Necessary for Both Expansion of Activated T Cells and Suppression of Tfh Cell Differentiation.

Irradiated recipients were reconstituted with 50% CD45.1 and 50% CD45.2 CD4-Cre+ T-betfl/fl bone marrow, rested, and infected/immunized as in Figure 6A. As an additional control, a 3rd group was reconstituted with a mixture of 50% CD45.1 and 50% CD45.2 T-betfl/fl (CD4-Cre-negative) bone marrow, referred to as “Cre−”.
(A) Example flow cytometry plots of CD44high CD4 T cells showing either CXCR5+ PD-1high Tfh cell (left), or T-bet versus Bcl-6 (right).
(B–D) Percentage (B) and number (C) of Tfh cell among each cell type and the fold advantage of WT or KO cells to produce Tfh cell (D), where values greater than 1 indicate WT advantage and below 1 indicate KO advantage.
(E and F) Percentage (E) and number (F) of T-bet+ CD44high T cells of each cell type.
(G) Fold advantage of T-bet WT cells to produce CD44high CD4 T cells.
All symbols represent individual mice (n = 3–5 per group) and bars the mean ± SD. Statistical significance was calculated by two-tailed Student’s t test (NS, not significant; *p < 0.05, **p < 0.01, ***p < 0.001, ****p < 0.0001). For (D) and (G), each group was compared to the hypothetical mean of no competitive advantage, 1, by one-sample t test, shown above each individual bar (*p < 0.0332, **p < 0.0021, ***p < 0.0002, ****p < 0.0001).
DISCUSSION
In this work we sought to understand the mechanisms that suppress the GC response during STm infection. GC suppression is an important issue, as multiple pathogens display the ability to inhibit the GC response. The GC response in turn is responsible for generation of memory and long-lived antibody that would prevent reinfection and is required for effective vaccination. From a mechanistic standpoint, understanding how GC suppression occurs can reveal insights into how GC and extrafollicular responses are negatively regulated in a fundamental way.
Here, we have excluded several possibilities and positively identified and then further elucidated one important mechanism of GC suppression that operates by negatively regulating Tfh cell development. Our key insight is that IL-12, either elicited by STm or provided experimentally in a noninfectious setting, suppressed Tfh cell differentiation through upregulation of T-bet. This in turn blocked GC formation. Hence, our studies reveal that IL-12 is a pivotal cytokine in regulating the yin/yang between inflammatory Th1 responses and those directed at generating GC via Tfh cell differentiation. These results shape thinking about how Tfh cell generation is regulated, have implications for understanding the mechanisms of T-B interaction in autoimmune disease, and suggest strategies to optimize vaccination, as we will discuss.
Our initial observation of dominant suppression of NP-specific GC responses indicated that infection of STm-specific B cells was not a mechanism of GC suppression. Importantly, suppression was limited to the GC response, because neither T-dependent nor T-independent AFCs were suppressed. This system also indicated that the T cell “culling” effect (Nanton et al., 2012) was not responsible. That culling does not occur in a BCR-restricted host is an incidental but interesting finding from these studies. We found that the environment was important for GC suppression but did not irreversibly imprint either B or T cells. A caveat is that lack of imprinting could only be inferred up to the time point of secondary transfer of the cells in question away from (or into) the infected environment. Technical limitations constrained this to ~3 days; however, this time frame was considered relevant, since, in work of others, early Th1 and Tfh cell cells were fate committed by day 3 (Choi et al., 2013). Most notably, T cells transferred out of the STm-infected environment could resume Tfh cell differentiation. Similarly, B cells primed in infected hosts were also competent to enter GC if removed from the infection environment, whereas such differentiation was suppressed if B cells were transferred into a STm-infected environment. Though our results show lack of fate commitment up to day 3, it is possible or even likely that eventually cells would lose plasticity and not be able to be rescued from a more committed fate.
The observation that the environment plays a decisive role in mediating GC suppression suggested that a soluble factor (most likely a cytokine) might be critical. A pivotal and unexpected finding was that lack of the IFNgR1 had no effect on Tfh cell differentiation, given that IFN-γ is highly expressed during STm infection and that IFN-γ is a major driver of Th1 differentiation. IFN-γ derived from B cells was previously implicated in Th1 development during STm infection (Barr et al., 2010). Rather, we found that IL-12 was limiting Tfh cell development, as lack of IL-12Rb2 on T cells led to a higher frequency of Tfh cells. Simultaneously, lack of IL-12Rb2 on T cells greatly reduced the numbers of responding T cells. In a critical additional experiment that isolated IL-12 as a factor apart from the STm infection environment, we found that adding IL-12 systemically in vivo during an anti-hapten T-dependent response suppressed both Tfh cell and GC responses. This also revealed that IL-12 was sufficient to drive very high levels of T-bet expression, suggesting a potential mechanism of Tfh cell suppression. However, despite similarities in the IL-12rb2 and T-bet KO T cells, the lack of these molecules did not have identical effects. T cells lacking IL-12rb2 had a competitive advantage in producing Tfh cells, while T-bet-deficient cells did not. Therefore, further T-bet independent but IL-12-dependent regulatory mechanisms in Tfh cell suppression remain to be explored.
That IL-12 suppressed Tfh cell and downstream GC responses was unexpected, because it has been suggested that IL-12 promotes the differentiation of human Tfh cells and has little effect on mouse Tfh cell differentiation. However, in our analysis of the primary data from multiple relevant reports, we reach a different conclusion that the effects of IL-12 on human and mouse T cells are largely the same. Furthermore, from these studies, it is clear that a suppressive role for IL-12 in Tfh cell differentiation had not been thoroughly addressed in either organism. In prior studies, production of IL-21 was taken as a primary indicator of Tfh cell differentiation, and both human and mouse T cells generate IL-21-producing T cells after in vitro activation in the presence of IL-12 (Eto et al., 2011; Ma et al., 2009; Nakayamada et al., 2011; Schmitt et al., 2009). However, IL-21 production is not unique to Tfh cells nor does it define Tfh cells (Tian and Zajac, 2016). In a particularly relevant example of this, IL-21-producing T cells are generated during STm infection, despite the lack of Tfh cells (Trüb et al., 2017). In fact, four populations of cells are induced in vitro by IL-12, based on IL-21 and IFN-γ expression, with IL-21+ IFN-γ+ co-producing cells being by far the dominant population (Eto et al., 2011; Ma et al., 2009; Nakayamada et al., 2011; Schmitt et al., 2009). Such double producers are unlikely to represent authentic Tfh cells as they accounted for over 25% of the cells in the culture whereas less than 10% were CXCR5+ PD-1high, a phenotype more correlated with Tfh cell identity. Indeed, human tonsil CXCR5hi Tfh cells (Ma et al., 2009; Schmitt et al., 2009) contain only a small population of cells producing both IL-21 and IFN-γ (less than 2%). Furthermore, mouse Bcl-6 KO T cells lacked Tfh cells yet maintained an IL-21 and IFN-γ co-producing population in response to Plasmodium chabaudi infection (Carpio et al., 2015). The products of such cultures, which contained at least four types of responding T cells, did promote B cell antibody production in vitro (Schmitt et al., 2009), but whether the dominant IL-21 IFN-γ co-producing population, or one of the other populations, particularly the CXCR5+ PD-1+ cells, specifically had Tfh-cell-like function was not determined.
The in vivo role of IL-12 in Tfh cell development in humans is understandably more difficult to assess and has thus far relied on studies of human subjects with IL12Rb1 loss-of-function mutations. These studies are further limited by the examination of peripheral blood for so-called circulating Tfh-cell-like (cTfh) cells, which may well not mirror authentic GC-localized follicular T cells. Nonetheless, the frequency of cTfh cell was not different in IL12Rb1-deficient adults (Ma et al., 2012, 2016; Schmitt et al., 2013) and reduced cTfh cells have only been reported in children under the age of 10 years (Schmitt et al., 2013). It is important to note that the IL12Rb1 subunit is part of both the IL-12 and IL-23 receptors. IL-23 signals through STAT3, and STAT3-deficient patients did have reduced cTfh cell frequencies, thus complicating the interpretation of IL12Rb1 deficiency. One study examined cTfh cells in IL12Rb2- and IL23R-deficient (not shared by IL-12R) patients and found only a trend toward lower cTfh cells in IL23R deficiency compared to controls (Martínez-Barricarte et al., 2018). However, only two patients were examined, limiting the generality of the conclusions. Furthermore, IL12Rb1-deficient subjects had equal or higher antibody titers specific to multiple vaccination antigens (Schmitt et al., 2013), not lower titers, as would be predicted if IL-12 signals were necessary for human Tfh cell differentiation to support GC, and thereby long-lived antibody responses. Similar to our finding that IL12Rb2 and T-bet did not suppress Tfh cells in control mice, the general lack of striking effects on vaccine antibody titers (both up and down) may be because they do not induce strong enough Th1 immunity to suppress Tfh cells. In summary, we would argue that in vivo effects are not yet fully defined and that mouse and human T cells respond to IL-12 similarly during in vitro culture.
IL-12 directly promotes T-bet expression, and mechanistically, we found a role for T-bet not only in Tfh cell suppression but also in promoting T cell expansion. The role of T-bet in regulating Tfh cells is complex and variable between infection systems. T-bet can suppress development of Tfh-cell-like cells in vitro in mouse and human T cells (Nakayamada et al., 2011; Schmitt et al., 2016). In mouse models of infection with the parasites Toxoplasma gondii immunization and Plasmodium berghei ANKA, T-bet-deficient polyclonal T cells produce more Tfh cells (Nakayamada et al., 2011; Ryg-Cornejo et al., 2016). Seemingly in contrast, following LCMV Armstrong viral infection, heterozygous or homozygous T-bet loss in TCR transgenic T cells reduces Tfh cell frequencies (Weinstein et al., 2018). A recent report shows that T-bet also represses Tfh cells during murine influenza virus infection (Sheikh et al., 2019). The role of T-bet thus appears to be dependent on the host cytokine milieu specific to each infection. Given this, it is tempting to speculate that some IL-12 and T-bet expression is necessary for optimal Tfh cell expansion, but higher amounts of IL-12 and T-bet suppress Tfh cell differentiation. Our data implicate IL-12 as an important component of the STm infection environment, a strongly Th1-dominant bacterial infection.
The role of IL-12 in suppressing Tfh cells and GC in vivo, as we have shown here, was likely not previously recognized because IL-12 effects are facultative; that is, its effects are not apparent unless (at the least) the biological setting generates sufficient IL-12. Such contexts are prevalent in nature and would include certain infections, immunization with strong adjuvants, or autoimmune diseases. However, typical experimental models used to study murine GC responses (such as hapten-carrier immunization in alum) likely generate little if any IL-12. This is likely also the case for human vaccinations in alum. The facultative role of IL-12 is illustrated by the fact that we saw no role for IL-12R in NP-CGG responses in the absence of infection and that recombinant IL-12 induced higher Th1 cell numbers and T-bet mean fluorescent intensity (MFI) in a dose-dependent manner. Given that many infections do elicit substantial IL-12 (Tait Wojno et al., 2019), it is possible that the mechanism of IL-12 effect on Tfh cell development does explain GC inhibition observed in other infectious models, though it also possible that other mechanisms are at play, depending on the infection. Indeed, as we did not see restored GC during STm infection, we hypothesize that there are further suppressive mechanisms that remain to be discovered in this system.
One situation in which IL-12 suppression of GC (and reciprocal promotion of Th1 and extrafollicular PB responses) may be operating is in lupus-like autoimmunity. Some strains of autoimmuneprone mice have a prominent extrafollicular PB response, with few or no GCs (Jacobson et al., 1995; Jenks et al., 2019; William et al., 2002). A similar phenotype has recently been recognized in major subsets of SLE patients (Jenks et al., 2019; Tipton et al., 2015). It is interesting to speculate that in these instances, excessive IL-12 is driving the immune responses, explaining the paucity of GC and large extrafollicular response.
If this is the case, then it may explain why the drug ustekinumab, which blocks both IL-12 and IL-23, appears effective in preliminary studies of systemic lupus erythematosus (SLE) patients (van Vollenhoven et al., 2018). To which cytokine (or both) this effect is attributable is not currently known, but we would propose that IL-12 blocking is important and that such therapy would be more effective in patients that display either a high PB phenotype or elevated “ABC-type” B cells (Jenks et al., 2019). It is thus intriguing that there are IL-12R polymorphisms associated with SLE (Bentham et al., 2015). Further, Th1 skewing and high IL-12 and IFN-γ serum levels are found in SLE, associated with more severe nephritis (Calvani et al., 2003; Koenig et al., 2012; Postal et al., 2013; Schwarting et al., 1999; Tucci et al., 2008).
The findings from this STm infection model suggest a general principle that IL-12 functions as a pivotal cytokine in determining alternative directions of the immune response in vivo during infections and autoimmune conditions that elicit IL-12. When present, IL-12 appears to dominantly inhibit Tfh cell differentiation via a direct effect on the responding T cells. It is notable that this IL-12 effect is distinct from the effects of IFN-γ, which alone has no T cell-intrinsic effect on Tfh cell differentiation. This IL-12-directed response could be more appropriate for providing protection during acute infection, in contrast to a GC-dominated response that spawns memory rather than immediate effector function. The manipulation of this cytokine axis thus would have therapeutic and mechanistic implications for pathogen protection, vaccination, and adjuvant choice, as well as autoimmune states in which IL-12 plays a key role.
STAR★METHODS
LEAD CONTACT AND MATERIALS AVAILABILITY
Further information and requests for resources and reagents should be directed to and will be fulfilled by the Lead Contact, Mark J. Shlomchik (mshlomch@pitt.edu). This study did not generate new unique reagents.
EXPERIMENTAL MODEL AND SUBJECT DETAILS
Mice
C57BL/6J, CD45.1 C57BL/6J, IFN-gamma receptor 1 knock out mice (stock #003288; B6.129S7-Ifngr1tm1Agt/J), and T-bet-floxed mice (Jax #022741 B6.129-Tbx21tm2Srnr/J) were purchased from Jackson Laboratories. B1–8+/− BALB/cJ, B1–8+/− Jk−/− BALB/cJ, B1–8+/− C57BL/6J (each containing transgenic NP-specific B cells), B1–8+/− Vk8R+/− CD45.1/2 C57BL/6J, B1–8+/+ Vk8R+/− CD45.1/2 BALB/cJ (each containing low frequencies of NP-specific B cells and little to no STm specific B cells), AM14 heavy+light chain knock-in (rheumatoid factor specific transgenic B cell knock-in), were previously described (Prak and Weigert, 1995; Shlomchik et al., 1993; Sonoda et al., 1997). DO11.10 mice (BALB/c MHCII restricted OVA-specific TCR knock-in) were previously described (Sweet et al., 2011). TS1+ Rag2KO BALB/c (BALB/c MHCII restricted influenza hemagglutinin-specific TCR knock-in) were previously described (Juchem et al., 2011). CD19-Cre (Jax #006785 B6.129P2(C)-Cd19tm1(cre)Cgn/J) and IL12Rb2 KO (Jax #003248 B6.129S1-Il12rb2tm1Jm/J) mice were a gift of Dr. Dario Vignali, CD4-Cre (Jax #017336 STOCK Tg(Cd4-cre)1Cwi/FfluJ) were a gift of Dr. Amanda Poholek, BLIMP-1-flox mice were a gift of Dr. David Rothstein (Jax #008100 B6.129-Prdm1tm1Clme/J), OTII+ Rag1KO CD45.2 C57BL/6 (Taconic) mice were a gift of Dr. Geetha Chalasani. All mice were bred and housed in specific pathogen free conditions and all experiments were conducted under protocols approved by the University of Pittsburgh Institutional Animal Care and Use Committee (IACUC). All mice were between the age of 8–16 weeks at the start of the experiment, except bone marrow donors which were between 5–10 weeks. Ages were mixed between groups to minimize any differences. For adoptive cell transfers and bone marrow chimera experiments, donor cells were always from female mice to prevent rejection due to Y chromosome genes. Recipient mice were a mixture of males and females and no differences were observed between them. For CD19-Cre BLIMP-1-flox experiments, Cre-negative littermate controls were co-housed with Cre+ experimental mice of the same sex prior to and throughout the experiment.
Bacterial strains
Salmonella enterica serovar Typhimurium aroA attenuated strain SL3261 was previously described (Hoiseth and Stocker, 1981) and was provided by Roy Curtiss III, Arizona State University. Bacteria were grown overnight in Luria broth, then mixed 1:1 with sterile 50% glycerol, and stored as glycerol stocks at −80°C prior to use for infection.
METHOD DETAILS
Cell transfers
B cells were isolated from B1–8+/− Jk−/− BALB/c or B1–8+/− C57BL/6 mice as described (Weisel et al., 2016). Specifically, spleens were made into single cell suspension by crushing with frosted glass slides in sterile stem cell buffer (PBS containing 2% fetal bovine serum (Gemini Bio-Products) and 2 mM EDTA). Red blood cells were lysed by resuspending in ACK lysis buffer (GIBCO or Lonza) for 60 seconds. Cells were washed and labeled with biotinylated antibodies to CD4, CD8, CD49b, and F4/80, washed and then labeled with Streptavidin Particles Plus – DM (BD Biosciences), the tube placed in an EasySep Magnet (STEMCELL Technologies) and the unlabeled fraction poured off and collected for further wash steps. DO11 CD4 T cells were isolated as described for B cells above, except by staining unwanted cells with biotinylated antibodies specific to CD8, CD45R, CD19, CD11c, CD11b, and CD49b followed with Streptavidin Particles Plus - DM (BD Biosciences). OTII+ Rag1KO cells were isolated by creating a single cell suspension and lysing red blood cells for 60 seconds in ACK lysis buffer (GIBCO or Lonza), and washing with stem cell buffer. The frequency of NIP-binding B cells or DO11.10 TCR+ T cells was quantified by staining with antibodies to CD19 (clone 1D3), CD4 (clone GK1.5), DO11.10 TCR (clone KJ1–26), NIP-PE, and 7-AAD (2 ng/mL) or propidium iodide (1.5 ng/mL) and analyzing by flow cytometry. Five million NP-binding B cells and 2.5 million DO11.10+ CD4+ T cells or OTII+ CD4+ T cells were washed 3 times in PBS, resuspended in 200 μL PBS and injected by tail vein injection into recipients.
Immunization and Infection
Mice were immunized with 50 μg NP-CGG or 50 or 100 μg NP-OVA precipitated in alum at a range of ratios of NP to CGG or OVA of 31–33 and 8–10 respectively. NP-Ficoll (Biosearch Technologies) was diluted in PBS and 250 μg was injected i.p. One day prior to infection, frozen Salmonella glycerol stock was inoculated into Luria broth containing 100 μg/mL streptomycin and grown at 37C overnight with shaking. Heat killed bacteria were prepared by washing bacteria twice in PBS, resuspending in PBS, and incubating at 56C for 1 hour. For infectious inoculum, bacterial cultures were split 1:25 into fresh media and grown for an additional 2 hours at 37C to allow bacteria to reach mid-log phase, then washed 3 times in room temperature sterile PBS. Bacterial concentration was estimated by absorbance at OD600, and 1–5×10⁵ colony forming units were injected i.p. Colony forming units were confirmed by overnight growth at 37C of serial dilutions of inoculum on Luria broth agar plates with streptomycin.
Bacterial burden
Whole spleens were weighed and a central portion weighing between 10 – 100 mg was sonicated in PBS to lyse splenic cells. Serial dilutions were grown on Luria broth agar plates with streptomycin overnight at 37C to quantify the concentration of colony forming units, which was used to calculate the total number of bacteria per mg of splenic tissue and of the whole spleen.
Flow cytometry
Remaining spleen pieces were weighed and made into single cell suspensions by mechanical disruption in STm media (PBS + 5% bovine serum + 2 mM EDTA). RBC were lysed with ACK lysis buffer, and live cells enumerated with trypan blue and a hemacytometer. Five million cells per sample were stained at 100 million cells/mL with the dead cell discriminator ghost 510 (per manufacturers protocol) in PBS, and washed with staining media (PBS with 3% bovine serum, 1 mM EDTA, and 0.02% sodium azide). To evaluate B cells, suspensions were stained with fluorochrome-conjugated surface antibodies CD19 (clone 1D3), CD38 (clone 90), CD44 (clone IM7), CD45.1 (clone A20, CD45.2 (clone 104), CD95 (clone Jo2), CD138 (clone 281–2), and TCRbeta (clone H57–597). T cells were evaluated with antibodies to CD4 (clone GK1.5), CD45R (clone RA3–6B2), CD44 (clone IM7), CD45.1 (clone A20), CD45.2 (clone 104), DO11 TCR (clone KJ1–26), ICOS (clone C398.4A), and PD-1 (clone G4) for 20 min on ice (excluding CXCR5-PE). Cells were washed twice with staining media, and B cell stains were fixed with 1% PFA in PBS for 20 min on ice, while T cell stains were fixed/permeabilized with FoxP3 Transcription Factor staining Kit for 30 min on ice. B cell stains were washed and resuspended in staining media; T cell stains were washed twice with Kit permeabilization buffer, blocked again with 25 uL staining media containing 10% mouse and 10% rat serum, and 25 uL staining media containing 2× intracellular stain antibodies (CXCR5 clone 2G8, T-bet clone 4B10, Bcl-6 clone K112–91), added directly to stain and incubated overnight at 4C. Cells were washed twice with Kit permeabilization buffer, resuspended in staining media, and data collected using either a BD Biosciences LSRII or Fortessa.
ELISPOTs
ACK-lysed single cell suspensions were resuspended in B cell media (RPMI with 10% fetal plex serum (Gemini), penicillin/streptomycin (GIBCO), 25 ug/mL gentamycin (Thermo Fisher), and L-glutamate (Corning)). ELISPOTs were performed as described using anti-kappa to coat plates (Di Niro et al., 2015).
Secondary cell transfers
At day 3 post immunization, B and CD4 T cells were isolated from 1st recipients by magnetic depletion as above using biotinylated antibodies against (CD4, CD8, CD11b, CD11c, CD49b) for B cells, and (CD45R, CD19, CD11c, CD11b, F4/80) for T cells, and washed 3 times in PBS before intravenous injection. For cells coming from primary control or STm-infected recipients, the total number of NP-binding B cells or DO11.10 target cells per sample was determined by FACS (described above) and adjusted such that the same number of target cells was transferred into all secondary recipients per experiment. A total of 0.5 – 1.5×10⁶ NP-binding B or 2.5 – 5×10⁴ DO11+ T cells was transferred to secondary recipients. For Figures 6A–6D, cell suspensions also contained 0.5 units penicillin and 0.5 μg streptomycin to prevent transfer of infection. For transfer into heat-killed STm-immunized 2nd recipients, TS1+ RAG2KO mice were used as recipients BCR-restricted hosts (B18+/+ Vk8R+/− CD45.1/2 BALB/c) served as infected 2nd recipients for B cell transfers.
Mixed bone marrow chimeras
BCR-restricted B18+/− VK8R+/− CD45.1/2 C57BL/6 mice were exposed to 900 rads of irradiation and rested 3–8 hours prior to bone marrow cell transfer. Irradiated mice were reconstituted with a mixture of 50% CD45.1 cells and either 50% CD45.2 IFNgR KO or 50% IL12Rb2 KO bone marrow. For cell transfer, bone marrow was isolated from donor mice by flushing femurs and tibias with sterile stem cell buffer (PBS with 2.5% fetal plex and 1 mM EDTA), and made into single cell suspension by vigorous pipetting and straining through a 100 μm mesh filter. RBC were lysed for 60 seconds with ACK buffer, washed with stem cell buffer, then washed three times with sterile PBS and live cells enumerated by trypan blue count. For 50% WT / 50% receptor KO chimeras, each cell type was resuspended to 15–25 million cells/mL, mixed one-to-one, and 200 μL injected into irradiated hosts by tail vein injection for a total of 3–5 million bone marrow cells per mouse in PBS. Mice were fed TMS food for up to 4 weeks, then regular chow for an additional 4 weeks. Mice were then infected and immunized as described in Figure 7.
Recombinant IL-12 treatment
B1–8 ± BALB/c mice were immunized and/or infected as described in Figure 7. Recombinant murine IL-12 p70 (PeproTech) was resuspended in PBS to 1 or 2 μg/mL for 200 and 400 ng doses respectively, and stored at −20C. IL-12 or PBS vehicle was administered i.p. as indicated.
QUANTIFICATION AND STATISTICAL ANALYSIS
Statistical significance was quantified with GraphPad Prism software by two-tailed Student’s t test or one-way ANOVA as indicated in each figure. A p value ≤ 0.05 was considered significant, with the following symbols used to denote p value ranges: p < = 0.05(*), p < 0.01 (**), p < 0.001 (***), p < 0.0001 (****). For mixed bone marrow chimera “fold-advantage” calculations, the sample group was compared to the hypothetical mean of no advantage equaling using a one-sample t test. A p value p ≤ 0.0332 was considered significant, with the following symbols used to denote p value ranges: p < 0.0332(*), p < 0.0021 (**), p < 0.0002 (***), p < 0.0001 (****). Cell number was calculated per spleen using a combination of FACS analysis and trypan blue live cell counts as follows: the percent of cell of interest among live cells was determined by FACS, then the ratio of spleen processed for FACS analysis by weight as a portion of the total weight was used to calculate the total number of cells of interest per spleen.
DATA AND CODE AVAILABILITY
This study did not generate or analyze previously reported datasets or codes.
Supplementary Material
KEY RESOURCES TABLE.
| REAGENT or RESOURCE | SOURCE | IDENTIFIER |
|---|---|---|
| Antibodies | ||
| Anti-mouse Bcl-6, clone K112–91, Alexa647 | BD Biosciences | Cat# 561525; RRID: AB_10898007 |
| Anti-mouse CD4, clone GK1.5, Pacific Blue | Produced in house | N/A |
| Anti-mouse CD4, clone GK1.5, Biotin | Produced in house | N/A |
| Anti-mouse CD8a, clone TIB 105 Biotin | Produced in house | N/A |
| Anti-mouse CD11b, clone M1/70 Biotin | Produced in house | N/A |
| Anti-mouse CD11c, clone N418, Biotin | Produced in house | N/A |
| Anti-mouse CD19, clone 1D3, BUV395 | BD Biosciences | Cat# 563557; RRID: AB_2722495 |
| Anti-mouse CD19, clone 1D3.2, Biotin | Produced in house | N/A |
| Anti-mouse CD38, clone 90, Alexa 488 | Produced in house | N/A |
| Anti-mouse CD38, clone 90, Pacific Blue | Produced in house | N/A |
| Anti-mouse CD44, clone IM7, BV605 | BD Biosciences | Cat# 563058; RRID: AB_2737979 |
| Anti-mouse CD44, clone IM7, APC-Cy7 | Biolegend | Cat# 103028; RRID: AB_830785 |
| Anti-mouse CD45.1, clone A20, APC-efluor780 | eBioscience/Thermo Fisher | Cat# 47–0453–82 |
| Anti-mouse CD45.2, clone 104, FITC | BD Biosciences | Cat# 553772; RRID: AB_395041 |
| Anti-mouse CD45R, clone RA3–6B2, Biotin | Produced in house | N/A |
| Anti-mouse CD45R, clone RA3–6B2, BUV395 | BD Biosciences | Cat# 563793; RRID: AB_2738427 |
| Anti-mouse CD45R, clone RA3–6B2, PerCP-Cy5.5 | Biolegend | Cat# 103236; RRID: AB_893354 |
| Anti-mouse CD49b, clone DX5, Biotin | BD Biosciences | Cat# 553856; RRID: AB_395092 |
| Anti-mouse CD95, clone Jo2, PE-Cy7 | BD Biosciences | Cat# 557653; RRID: AB_396768 |
| Anti-mouse CD138, clone 281–2, PE | Biolegend | Cat# 142504; RRID: AB_10916119 |
| Anti-mouse CXCR5, clone 2G8, PE | BD Biosciences | Cat# 561988; RRID: AB_10893355 |
| Anti-DO11.10 TCR, clone KJ1–26, FITC | Biolegend | Cat# 118506; RRID: AB_1134180 |
| Anti-mouse F4/80, clone F4/80, Biotin | Produced in house | N/A |
| Anti-mouse ICOS, clone C398.4A, FITC | Biolegend | Cat# 313506; RRID: AB_416330 |
| Anti-mouse ICOS, clone C398.4A, Alexa 647 | Biolegend | Cat# 313516; RRID: AB_2122582 |
| Anti-mouse PD-1, clone G4, Biotin | Produced in house | N/A |
| Anti-mouse PD-1, clone RMPI-30, PECy7 | Biolegend | Cat# 109110; RRID: AB_572017 |
| Anti-human/mouse T-bet, clone 4B10, PECy7 | Biolegend | Cat# 644824; RRID: AB_2561761 |
| Anti-mouse TCRbeta, clone H57–597, PerCP-Cy5.5 | Biolegend | Cat# 109228; RRID: AB_1575173 |
| Goat-anti-mouse IgM, polyclonal, alkaline phosphatase | Southern Biotech | Cat# 1020–04 |
| Goat-anti-mouse IgG1, polyclonal, alkaline phosphatase | Southern Biotech | Cat# 1070–04 |
| Goat-anti-mouse IgG2b, polyclonal, alkaline phosphatase | Southern Biotech | Cat# 1090–04 |
| Goat-anti-mouse IgG2c, polyclonal, alkaline phosphatase | Southern Biotech | Cat# 1078–04 |
| Goat-anti-mouse IgG3, polyclonal, alkaline phosphatase | Southern Biotech | Cat# 1100–04 |
| Goat-anti-mouse kappa, polyclonal, (unlabeled) | Southern Biotech | Cat# 1050–01; RRID: AB_2737431 |
| Bacterial and Virus Strains | ||
| aroA attenuated Salmonella Typhimurium strain SL3261 | From Dr. Roy Curtiss III, contact lead investigator | No RRID |
| Biological Samples | ||
| BenchMark Fetal Bovine Serum | Gemini Bio-Products | Cat# 100–106 |
| Chemicals, Peptides, and Recombinant Proteins | ||
| Ghost Dye Violet 510 | Tonbo biosciences | Cat# 13–0870-T500 |
| Recombinant murine IL-12 p70 | Peprotech | Cat# 210–12 |
| NIP-PE conjugated in house from NIP-OSu | LGC Biosearch Technologies | Cat# N-1080 |
| NIP-APC conjugated in house from NIP-Osu | LGC Biosearch Technologies | Cat# N-1080 |
| NP-CGG conjugated in house from NP-Osu | LGC Biosearch Technologies | Cat# 1010 |
| NP-OVA conjugated in house from NP-Osu | LGC Biosearch Technologies | Cat# 1010 |
| NP(50)-Ficoll | LGC Biosearch Technologies | Cat# 1420 |
| TMS (Trimethroprim sulfadiazine) mouse chow | Envigo | Cat# TD.06596 |
| 7-AAD | Tonbo biosciences | Cat# 13–6993-T500 |
| Propidium iodide | Invitrogen/Thermo Fisher | Cat# P1304MP |
| Streptavidin BUV395 | BD Biosciences | Cat# 564176 |
| Streptavidin Particles Plus – DM Imag | BD Biosciences | Cat# 557812 |
| ACK lysis buffer | GIBCO/Thermo Fisher | Cat# A1049201 |
| ACK lysis buffer | Lonza | Cat# 10–548E |
| Critical Commercial Assays | ||
| FoxP3 Transcription factor staining kit | eBioscience/Thermo Fisher | Cat# 00–5523–00 |
| “The Big Easy” EasySep Magnet | StemCell Technologies | Cat# 18001 |
| Experimental Models: Organisms/Strains | ||
| Mouse: C57BL/6J | Jackson Laboratory | Cat# 000664; RRID: IMSR_JAX:000664 |
| Mouse: CD45.1 C57BL/6J | Jackson Laboratory | Cat# 002014; RRID: IMSR_JAX:002014 |
| Mouse: Interferon gamma receptor 1 knock out | Jackson Laboratory | Cat# 003288; RRID: IMSR_JAX:003288 |
| Mouse: B1–8+/− BALB/c | Contact lead investigator | N/A |
| Mouse: B1–8 ± Jk−/− BALB/c | Contact lead investigator | N/A |
| Mouse: B1–8+/− C57BL/6J | Contact lead investigator | N/A |
| Mouse: B1–8 ± Vk8R+/− CD45.1/2 C57BL/6J | Contact lead investigator | N/A |
| Mouse: B1–8+/+ Vk8R+/− CD45.1/2 BALB/c | Contact lead investigator | N/A |
| Mouse: AM14 ± Vk8R+/− BALB/c | Contact lead investigator | N/A |
| Mouse: DO11.10 BALB/c | Contact lead investigator | N/A |
| Mouse: TS1+ Rag2 KO | Contact lead investigator | N/A |
| Mouse: CD19-Cre C57BL/6 | Jackson Laboratory | RRID: IMSR_JAX:006785 |
| Mouse: BLIMP-1-flox C57BL/6 | Jackson Laboratory | RRID: IMSR_JAX:008100 |
| Mouse: IL12Rb2 KO | Jackson Laboratory | RRID: IMSR_JAX:003248 |
| Mouse: OTII Rag1 KO C57BL/6 | Taconic | No longer sold by Taconic, contact lead investigator |
| Mouse: CD4-Cre C57BL/6 | Jackson Laboratory | RRID: IMSR_JAX:017336 |
| Mouse: T-bet-flox | Jackson Laboratory | RRID: IMSR_JAX:022741 |
| Software and Algorithms | ||
| GraphPad Prism 7 | GraphPad | RRID: SCR_002798 https://www.graphpad.com/scientific-software/prism/ |
| FlowJo 9.7 | Tree Star | RRID: SCR_008520 https://www.flowjo.com/solutions/flowjo/downloads |
| Conceptdraw Pro 11.2 | Concept Draw | No RRID https://www.conceptdraw.com/products/office |
| Other | ||
Highlights.
Germinal centers, but not plasma cells, are suppressed by Salmonella infection
Germinal center suppression is preceded by Tfh cell suppression
IL-12R signaling and T-bet are required in T cells for Tfh cell suppression
IL-12 directs Th1 immunity at the expense of Tfh cell differentiation
ACKNOWLEDGMENTS
We thank Drs. Ann Marshak-Rothstein, Amanda Poholek, Daniel Wikenheiser, and Creg Workman for critical reading of the manuscript and helpful discussions. We thank Dr. Dario Vignali for sharing IL12Rb2 KO and CD19-Cre mice and Dr. David Rothstein for sharing Blimp1fl/fl mice. We thank Laura Conter, Stephen Joachim, Rachael Green, Meagan Osburn, and Kristen Faidley for technical support. This work benefitted from SPECIAL BD LSRFORTESSATM funded by NIH grant 1S10OD011925-01. This work was supported by NIH grants T32 AI060525, R01 AI105018, and R01 AI043603.
Footnotes
DECLARATION OF INTERESTS
The authors declare no competing interests.
SUPPLEMENTAL INFORMATION
Supplemental Information can be found online at https://doi.org/10.1016/j.celrep.2019.10.069.
REFERENCES
- Barr TA, Brown S, Mastroeni P, and Gray D (2010). TLR and B cell receptor signals to B cells differentially program primary and memory Th1 responses to Salmonella enterica. J. Immunol 185, 2783–2789. [DOI] [PMC free article] [PubMed] [Google Scholar]
- Bentham J, Morris DL, Graham DSC, Pinder CL, Tombleson P, Behrens TW, Martín J, Fairfax BP, Knight JC, Chen L, et al. (2015). Genetic association analyses implicate aberrant regulation of innate and adaptive immunity genes in the pathogenesis of systemic lupus erythematosus. Nat. Genet 47, 1457–1464. [DOI] [PMC free article] [PubMed] [Google Scholar]
- Butler NS, and Kulu DI (2015). The regulation of T follicular helper responses during infection. Curr. Opin. Immunol 34, 68–74. [DOI] [PMC free article] [PubMed] [Google Scholar]
- Calvani N, Satoh M, Croker BP, Reeves WH, and Richards HB (2003). Nephritogenic autoantibodies but absence of nephritis in Il-12p35-deficient mice with pristane-induced lupus. Kidney Int. 64, 897–905. [DOI] [PubMed] [Google Scholar]
- Carpio VH, Opata MM, Montañez ME, Banerjee PP, Dent AL, and Stephens R (2015). IFN-γ and IL-21 double producing T cells are Bcl6-independent and survive into the memory phase in Plasmodium chabaudi infection. PLoS ONE 10, e0144654. [DOI] [PMC free article] [PubMed] [Google Scholar]
- Choi YS, Yang JA, Yusuf I, Johnston RJ, Greenbaum J, Peters B, and Crotty S (2013). Bcl6 expressing follicular helper CD4 T cells are fate committed early and have the capacity to form memory. J. Immunol 190, 4014–4026. [DOI] [PMC free article] [PubMed] [Google Scholar]
- Corcoran LM, and Tarlinton DM (2016). Regulation of germinal center responses, memory B cells and plasma cell formation-an update. Curr. Opin. Immunol 39, 59–67. [DOI] [PubMed] [Google Scholar]
- Crump JA, Luby SP, and Mintz ED (2004). The global burden of typhoid fever. Bull. World Health Organ 82, 346–353. [PMC free article] [PubMed] [Google Scholar]
- Cunningham AF, Gaspal F, Serre K, Mohr E, Henderson IR, Scott-Tucker A, Kenny SM, Khan M, Toellner KM, Lane PJ, and MacLennan IC (2007). Salmonella induces a switched antibody response without germinal centers that impedes the extracellular spread of infection. J. Immunol 178, 6200–6207. [DOI] [PubMed] [Google Scholar]
- de Vinuesa CG, Cook MC, Ball J, Drew M, Sunners Y, Cascalho M, Wabl M, Klaus GG, and MacLennan IC (2000). Germinal centers without T cells. J. Exp. Med 191, 485–494. [DOI] [PMC free article] [PubMed] [Google Scholar]
- Deenick EK, Chan A, Ma CS, Gatto D, Schwartzberg PL, Brink R, and Tangye SG (2010). Follicular Helper T Cell Differentiation Requires Continuous Antigen Presentation that Is Independent of Unique B Cell Signaling. Immunity 33, 241–253. [DOI] [PMC free article] [PubMed] [Google Scholar]
- Di Niro R, Lee S-J, Vander Heiden JA, Elsner RA, Trivedi N, Bannock JM, Gupta NT, Kleinstein SH, Vigneault F, Gilbert TJ, et al. (2015). Salmonella infection drives promiscuous B cell activation followed by extrafollicular affinity maturation. Immunity 43, 120–131. [DOI] [PMC free article] [PubMed] [Google Scholar]
- Dougan G, John V, Palmer S, and Mastroeni P (2011). Immunity to salmonellosis. Immunol. Rev 240, 196–210. [DOI] [PubMed] [Google Scholar]
- Elsner RA, Hastey CJ, Olsen KJ, and Baumgarth N (2015). Suppression of Long-Lived Humoral Immunity Following Borrelia burgdorferi infection. PLoS Pathog. 11, e1004976. [DOI] [PMC free article] [PubMed] [Google Scholar]
- Ertelt JM, Johanns TM, Mysz MA, Nanton MR, Rowe JH, Aguilera MN, and Way SS (2011). Selective culling of high avidity antigen-specific CD4+ T cells after virulent Salmonella infection. Immunology 134, 487–497. [DOI] [PMC free article] [PubMed] [Google Scholar]
- Eto D, Lao C, DiToro D, Barnett B, Escobar TC, Kageyama R, Yusuf I, and Crotty S (2011). IL-21 and IL-6 are critical for different aspects of B cell immunity and redundantly induce optimal follicular helper CD4 T cell (Tfh) differentiation. PLoS ONE 6, e17739. [DOI] [PMC free article] [PubMed] [Google Scholar]
- Fallet B, Narr K, Ertuna YI, Remy M, Sommerstein R, Cornille K, Kreutzfeldt M, Page N, Zimmer G, Geier F, et al. (2016). Interferon-driven deletion of antiviral B cells at the onset of chronic infection. Sci. Immunol 1, eaah6817. [DOI] [PMC free article] [PubMed] [Google Scholar]
- Fillatreau S (2016). Regulatory roles of B cells in infectious diseases. Clin. Exp. Rheumatol 34 (4, Suppl 98), 1–5. [PubMed] [Google Scholar]
- Galán JE, Lara-Tejero M, Marlovits TC, and Wagner S (2014). Bacterial type III secretion systems: specialized nanomachines for protein delivery into target cells. Annu. Rev. Microbiol 68, 415–438. [DOI] [PMC free article] [PubMed] [Google Scholar]
- Hess J, Ladel C, Miko D, and Kaufmann SH (1996). Salmonella typhimurium aroA- infection in gene-targeted immunodeficient mice: major role of CD4+ TCR-alpha beta cells and IFN-gamma in bacterial clearance independent of intracellular location. J. Immunol 156, 3321–3326. [PubMed] [Google Scholar]
- Hess C, Winkler A, Lorenz AK, Holecska V, Blanchard V, Eiglmeier S, Schoen AL, Bitterling J, Stoehr AD, Petzold D, et al. (2013). T cell-independent B cell activation induces immunosuppressive sialylated IgG antibodies. J. Clin. Invest 123, 3788–3796. [DOI] [PMC free article] [PubMed] [Google Scholar]
- Hoiseth SK, and Stocker BAD (1981). Aromatic-dependent Salmonella typhimurium are non-virulent and effective as live vaccines. Nature 291, 238–239. [DOI] [PubMed] [Google Scholar]
- Jacobson BA, Panka DJ, Nguyen KA, Erikson J, Abbas AK, and Marshak-Rothstein A (1995). Anatomy of autoantibody production: dominant localization of antibody-producing cells to T cell zones in Fas-deficient mice. Immunity 3, 509–519. [DOI] [PubMed] [Google Scholar]
- Jenks SA, Cashman KS, Woodruff MC, Lee FE, and Sanz I (2019). Extrafollicular responses in humans and SLE. Immunol. Rev. 288, 136–148. [DOI] [PMC free article] [PubMed] [Google Scholar]
- Juchem KW, Anderson BE, Zhang C, McNiff JM, Demetris AJ, Farber DL, Caton AJ, Shlomchik WD, and Shlomchik MJ (2011). A repertoire-independent and cell-intrinsic defect in murine GVHD induction by effector memory T cells. Blood 118, 6209–6219. [DOI] [PMC free article] [PubMed] [Google Scholar]
- Kallies A, and Good-Jacobson KL (2017). Transcription factor T-bet orchestrates lineage development and function in the immune system. Trends Immunol. 38, 287–297. [DOI] [PubMed] [Google Scholar]
- Keestra-Gounder AM, Tsolis RM, and Bäumler AJ (2015). Now you see me, now you don’t: the interaction of Salmonella with innate immune receptors. Nat. Rev. Microbiol 13, 206–216. [DOI] [PubMed] [Google Scholar]
- Koenig KF, Groeschl I, Pesickova SS, Tesar V, Eisenberger U, and Trendelenburg M (2012). Serum cytokine profile in patients with active lupus nephritis. Cytokine 60, 410–416. [DOI] [PubMed] [Google Scholar]
- Kullas AL, McClelland M, Yang HJ, Tam JW, Torres A, Porwollik S, Mena P, McPhee JB, Bogomolnaya L, Andrews-Polymenis H, and van der Velden AW (2012). L-asparaginase II produced by Salmonella typhimurium inhibits T cell responses and mediates virulence. Cell Host Microbe 12, 791–798. [DOI] [PMC free article] [PubMed] [Google Scholar]
- LaRock DL, Chaudhary A, and Miller SI (2015). Salmonellae interactions with host processes. Nat. Rev. Microbiol 13, 191–205. [DOI] [PMC free article] [PubMed] [Google Scholar]
- Lee SK, Rigby RJ, Zotos D, Tsai LM, Kawamoto S, Marshall JL, Ramiscal RR, Chan TD, Gatto D, Brink R, et al. (2011). B cell priming for extrafollicular antibody responses requires Bcl-6 expression by T cells. J. Exp. Med 208, 1377–1388. [DOI] [PMC free article] [PubMed] [Google Scholar]
- Lönnberg T, Svensson V, James KR, Fernandez-Ruiz D, Sebina I, Montandon R, Soon MSF, Fogg LG, Nair AS, Liligeto U, et al. (2017). Single-cell RNA-seq and computational analysis using temporal mixture modelling resolves Th1/Tfh fate bifurcation in malaria. Sci. Immunol 2, eaal2192. [DOI] [PMC free article] [PubMed] [Google Scholar]
- Ma CS, Suryani S, Avery DT, Chan A, Nanan R, Santner-Nanan B, Deenick EK, and Tangye SG (2009). Early commitment of naïve human CD4(+) T cells to the T follicular helper (T(FH)) cell lineage is induced by IL-12. Immunol. Cell Biol 87, 590–600. [DOI] [PubMed] [Google Scholar]
- Ma CS, Avery DT, Chan A, Batten M, Bustamante J, Boisson-Dupuis S, Arkwright PD, Kreins AY, Averbuch D, Engelhard D, et al. (2012). Functional STAT3 deficiency compromises the generation of human T follicular helper cells. Blood 119, 3997–4008. [DOI] [PMC free article] [PubMed] [Google Scholar]
- Ma CS, Wong N, Rao G, Nguyen A, Avery DT, Payne K, Torpy J, O’Young P, Deenick E, Bustamante J, et al. (2016). Unique and shared signaling pathways cooperate to regulate the differentiation of human CD4+ T cells into distinct effector subsets. J. Exp. Med 213, 1589–1608. [DOI] [PMC free article] [PubMed] [Google Scholar]
- Majowicz SE, Musto J, Scallan E, Angulo FJ, Kirk M, O’Brien SJ, Jones TF, Fazil A, and Hoekstra RM; International Collaboration on Enteric Disease ‘Burden of Illness’ Studies (2010). The global burden of nontyphoidal Salmonella gastroenteritis. Clin. Infect. Dis 50, 882–889. [DOI] [PubMed] [Google Scholar]
- Martínez-Barricarte R, Markle JG, Ma CS, Deenick EK, Ramírez-Alejo N, Mele F, Latorre D, Mahdaviani SA, Aytekin C, Mansouri D, et al. (2018). Human IFN-γ immunity to mycobacteria is governed by both IL-12 and IL-23. Sci. Immunol 3, eaau6759. [DOI] [PMC free article] [PubMed] [Google Scholar]
- McSorley SJ (2014). Immunity to intestinal pathogens: lessons learned from Salmonella. Immunol. Rev 260, 168–182. [DOI] [PMC free article] [PubMed] [Google Scholar]
- Moseman EA, Wu T, de la Torre JC, Schwartzberg PL, and McGavern DB (2016). Type I interferon suppresses virus-specific B cell responses by modulating CD8+ T cell differentiation. Sci. Immunol 1, eaah3565. [DOI] [PMC free article] [PubMed] [Google Scholar]
- Nakayamada S, Kanno Y, Takahashi H, Jankovic D, Lu KT, Johnson TA, Sun HW, Vahedi G, Hakim O, Handon R, et al. (2011). Early Th1 cell differentiation is marked by a Tfh cell-like transition. Immunity 35, 919–931. [DOI] [PMC free article] [PubMed] [Google Scholar]
- Nanton MR, Way SS, Shlomchik MJ, and McSorley SJ (2012). Cutting edge: B cells are essential for protective immunity against Salmonella independent of antibody secretion. J. Immunol 189, 5503–5507. [DOI] [PMC free article] [PubMed] [Google Scholar]
- Nanton MR, Lee S-J, Atif SM, Nuccio S-P, Taylor JJ, Bäumler AJ, Way SS, and McSorley SJ (2015). Direct visualization of endogenous Salmonella-specific B cells reveals a marked delay in clonal expansion and germinal center development. Eur. J. Immunol 45, 428–441. [DOI] [PMC free article] [PubMed] [Google Scholar]
- Neves P, Lampropoulou V, Calderon-Gomez E, Roch T, Stervbo U, Shen P, Kühl AA, Loddenkemper C, Haury M, Nedospasov SA, et al. (2010). Signaling via the MyD88 adaptor protein in B cells suppresses protective immunity during Salmonella typhimurium infection. Immunity 33, 777–790. [DOI] [PubMed] [Google Scholar]
- Nothelfer K, Sansonetti PJ, and Phalipon A (2015). Pathogen manipulation of B cells: the best defence is a good offence. Nat. Rev. Microbiol 13, 173–184. [DOI] [PubMed] [Google Scholar]
- Okoro CK, Kingsley RA, Quail MA, Kankwatira AM, Feasey NA, Parkhill J, Dougan G, and Gordon MA (2012). High-resolution single nucleotide polymorphism analysis distinguishes recrudescence and reinfection in recurrent invasive nontyphoidal Salmonella typhimurium disease. Clin. Infect. Dis 54, 955–963. [DOI] [PMC free article] [PubMed] [Google Scholar]
- Postal M, Peliçari KO, Sinicato NA, Marini R, Costallat LTL, and Appenzeller S (2013). Th1/Th2 cytokine profile in childhood-onset systemic lupus erythematosus. Cytokine 61, 785–791. [DOI] [PubMed] [Google Scholar]
- Prak EL, and Weigert M (1995). Light chain replacement: a new model for antibody gene rearrangement. J. Exp. Med 182, 541–548. [DOI] [PMC free article] [PubMed] [Google Scholar]
- Racine R, Jones DD, Chatterjee M, McLaughlin M, Macnamara KC, and Winslow GM (2010). Impaired germinal center responses and suppression of local IgG production during intracellular bacterial infection. J. Immunol 184, 5085–5093. [DOI] [PMC free article] [PubMed] [Google Scholar]
- Rosales-Reyes R, Alpuche-Aranda C, Ramírez-Aguilar Mde.L., Castro-Eguiluz AD, and Ortiz-Navarrete V (2005). Survival of Salmonella enterica serovar Typhimurium within late endosomal-lysosomal compartments of B lymphocytes is associated with the inability to use the vacuolar alternative major histocompatibility complex class I antigen-processing pathway. Infect. Immun 73, 3937–3944. [DOI] [PMC free article] [PubMed] [Google Scholar]
- Rosser EC, and Mauri C (2015). Regulatory B cells: origin, phenotype, and function. Immunity 42, 607–612. [DOI] [PubMed] [Google Scholar]
- Ryg-Cornejo V, Ioannidis LJ, Ly A, Chiu CY, Tellier J, Hill DL, Preston SP, Pellegrini M, Yu D, Nutt SL, et al. (2016). Severe malaria infections impair germinal center responses by inhibiting T follicular helper cell differentiation. Cell Rep. 14, 68–81. [DOI] [PubMed] [Google Scholar]
- Sammicheli S, Kuka M, Di Lucia P, de Oya NJ, De Giovanni M, Fioravanti J, Cristofani C, Maganuco CG, Fallet B, Ganzer L, et al. (2016). Inflammatory monocytes hinder antiviral B cell responses. Sci. Immunol 1, eaah6789. [DOI] [PMC free article] [PubMed] [Google Scholar]
- Schmitt N, Morita R, Bourdery L, Bentebibel SE, Zurawski SM, Banchereau J, and Ueno H (2009). Human dendritic cells induce the differentiation of interleukin-21-producing T follicular helper-like cells through interleukin-12. Immunity 31, 158–169. [DOI] [PMC free article] [PubMed] [Google Scholar]
- Schmitt N, Bustamante J, Bourdery L, Bentebibel SE, Boisson-Dupuis S, Hamlin F, Tran MV, Blankenship D, Pascual V, Savino DA, et al. (2013). IL-12 receptor β1 deficiency alters in vivo T follicular helper cell response in humans. Blood 121, 3375–3385. [DOI] [PMC free article] [PubMed] [Google Scholar]
- Schmitt N, Liu Y, Bentebibel SE, and Ueno H (2016). Molecular mechanisms regulating T helper 1 versus T follicular helper cell differentiation in humans. Cell Rep. 16, 1082–1095. [DOI] [PubMed] [Google Scholar]
- Schwarting A, Tesch G, Kinoshita K, Maron R, Weiner HL, and Kelley VR (1999). IL-12 drives IFN-gamma-dependent autoimmune kidney disease in MRL-Fas(lpr) mice. J. Immunol 163, 6884–6891. [PubMed] [Google Scholar]
- Shaw LA, Bélanger S, Omilusik KD, Cho S, Scott-Browne JP, Nance JP, Goulding J, Lasorella A, Lu LF, Crotty S, and Goldrath AW (2016). Id2 reinforces Th1 differentiation and inhibits E2A to repress TFH differentiation. Nat. Immunol 17, 834–843. [DOI] [PMC free article] [PubMed] [Google Scholar]
- Sheikh AA, Cooper L, Feng M, Souza-Fonseca-Guimaraes F, Lafouresse F, Duckworth BC, Huntington ND, Moon JJ, Pellegrini M, Nutt SL, et al. (2019). Context-dependent role for T-bet in T follicular helper differentiation and germinal center function following viral infection. Cell Rep. 28, 1758–1772.e4. [DOI] [PMC free article] [PubMed] [Google Scholar]
- Shen P, Roch T, Lampropoulou V, O’Connor RA, Stervbo U, Hilgenberg E, Ries S, Dang VD, Jaimes Y, Daridon C, et al. (2014). IL-35-producing B cells are critical regulators of immunity during autoimmune and infectious diseases. Nature 507, 366–370. [DOI] [PMC free article] [PubMed] [Google Scholar]
- Shlomchik MJ, Zharhary D, Saunders T, Camper SA, and Weigert MG (1993). A rheumatoid factor transgenic mouse model of autoantibody regulation. Int. Immunol 5, 1329–1341. [DOI] [PubMed] [Google Scholar]
- Sonoda E, Pewzner-Jung Y, Schwers S, Taki S, Jung S, Eilat D, and Rajewsky K (1997). B cell development under the condition of allelic inclusion. Immunity 6, 225–233. [DOI] [PubMed] [Google Scholar]
- Souwer Y, Griekspoor A, de Wit J, Martinoli C, Zagato E, Janssen H, Jorritsma T, Bar-Ephraïm YE, Rescigno M, Neefjes J, and van Ham SM (2012). Selective infection of antigen-specific B lymphocytes by Salmonella mediates bacterial survival and systemic spreading of infection. PLoS ONE 7, e50667. [DOI] [PMC free article] [PubMed] [Google Scholar]
- Srinivasan A, Nanton M, Griffin A, and McSorley SJ (2009). Culling of activated CD4 T cells during typhoid is driven by Salmonella virulence genes. J. Immunol 182, 7838–7845. [DOI] [PMC free article] [PubMed] [Google Scholar]
- St John AL, and Abraham SN (2009). Salmonella disrupts lymph node architecture by TLR4-mediated suppression of homeostatic chemokines. Nat. Med 15, 1259–1265. [DOI] [PMC free article] [PubMed] [Google Scholar]
- Sweet RA, Ols ML, Cullen JL, Milam AV, Yagita H, and Shlomchik MJ (2011). Facultative role for T cells in extrafollicular Toll-like receptor-dependent autoreactive B-cell responses in vivo. Proc. Natl. Acad. Sci. USA 108, 7932–7937. [DOI] [PMC free article] [PubMed] [Google Scholar]
- Tait Wojno ED, Hunter CA, and Stumhofer JS (2019). The immunobiology of the interleukin-12 family: room for discovery. Immunity 50, 851–870. [DOI] [PMC free article] [PubMed] [Google Scholar]
- Tian Y, and Zajac AJ (2016). IL-21 and T cell differentiation: consider the context. Trends Immunol 37, 557–568. [DOI] [PMC free article] [PubMed] [Google Scholar]
- Tiller T, Kofer J, Kreschel C, Busse CE, Riebel S, Wickert S, Oden F, Mertes MMM, Ehlers M, and Wardemann H (2010). Development of self-reactive germinal center B cells and plasma cells in autoimmune Fc gammaRIIB-deficient mice. J. Exp. Med 207, 2767–2778. [DOI] [PMC free article] [PubMed] [Google Scholar]
- Tipton CM, Fucile CF, Darce J, Chida A, Ichikawa T, Gregoretti I, Schieferl S, Hom J, Jenks S, Feldman RJ, et al. (2015). Diversity, cellular origin and autoreactivity of antibody-secreting cell population expansions in acute systemic lupus erythematosus. Nat. Immunol 16, 755–765. [DOI] [PMC free article] [PubMed] [Google Scholar]
- Trüb M, Barr TA, Morrison VL, Brown S, Caserta S, Rixon J, Ivens A, and Gray D (2017). Heterogeneity of phenotype and function reflects the multistage development of T follicular helper cells. Front. Immunol 8, 489. [DOI] [PMC free article] [PubMed] [Google Scholar]
- Tucci M, Lombardi L, Richards HB, Dammacco F, and Silvestris F (2008). Overexpression of interleukin-12 and T helper 1 predominance in lupus nephritis. Clin. Exp. Immunol 154, 247–254. [DOI] [PMC free article] [PubMed] [Google Scholar]
- van Vollenhoven RF, Hahn BH, Tsokos GC, Wagner CL, Lipsky P, Touma Z, Werth VP, Gordon RM, Zhou B, Hsu B, et al. (2018). Efficacy and safety of ustekinumab, an IL-12 and IL-23 inhibitor, in patients with active systemic lupus erythematosus: results of a multicentre, double-blind, phase 2, randomised, controlled study. Lancet 392, 1330–1339. [DOI] [PubMed] [Google Scholar]
- Vinuesa CG, Linterman MA, Yu D, and MacLennan ICM (2016). Follicular helper T cells. Annu. Rev. Immunol 34, 335–368. [DOI] [PubMed] [Google Scholar]
- Weinmann AS (2014). Regulatory mechanisms that control T-follicular helper and T-helper 1 cell flexibility. Immunol. Cell Biol. 92, 34–39. [DOI] [PubMed] [Google Scholar]
- Weinstein JS, Laidlaw BJ, Lu Y, Wang JK, Schulz VP, Li N, Herman EI, Kaech SM, Gallagher PG, and Craft J (2018). STAT4 and T-bet control follicular helper T cell development in viral infections. J. Exp. Med 215, 337–355. [DOI] [PMC free article] [PubMed] [Google Scholar]
- Weisel F, and Shlomchik M (2017). Memory B cells of mice and humans. Annu. Rev. Immunol 35, 255–284. [DOI] [PubMed] [Google Scholar]
- Weisel FJ, Zuccarino-Catania GV, Chikina M, and Shlomchik MJ (2016). A temporal switch in the germinal center determines differential output of memory B and plasma cells. Immunity 44, 116–130. [DOI] [PMC free article] [PubMed] [Google Scholar]
- William J, Euler C, Christensen S, and Shlomchik MJ (2002). Evolution of autoantibody responses via somatic hypermutation outside of germinal centers. Science 297, 2066–2070. [DOI] [PubMed] [Google Scholar]
Associated Data
This section collects any data citations, data availability statements, or supplementary materials included in this article.
Supplementary Materials
Data Availability Statement
This study did not generate or analyze previously reported datasets or codes.