

Abstract
In this work, the slip behavior and structure of liquid water flowing between two charged solid planar walls were investigated using non-equilibrium molecular dynamics simulations. The upper and lower walls are positive and negative charged, respectively. It was shown that the slip length increases at smaller water-solid interaction energy and become smaller with increasing the surface charge density. At the largest surface charge density, the slip length nearly independent of the water-solid interaction energy. The relationship between the slip length and surface charge density and water-solid interaction energy was rationalized by considering the static structure factor of liquid water. Interestingly, the positive charged surface induces less ordering structure and larger slip at the small surface charge density than that by the negative charged surface. While, at large surface charge density, the opposite correlation is observed. Furthermore, we find that the relationship between the slip length and the normalized main peak of static structure factor collapses onto a single curve for different water-solid interaction energies and surface charge densities. The results of the present work open perspectives for modeling complex systems with combined effects of surface charge and wettability.
Subject terms: Chemical physics, Fluid dynamics
Introduction
Since the end of last century, micro- and nanofluidic devices have greatly enhanced our ability to manipulate small volumes of fluid1. This has led to many applications for chemical analysis, biological characterization, cell capture and et al.2. The distinguished characteristic of micro- and nanofluidic devices is the large surface-to-volume ratio leading the boundary slip effect imposing significant influences on the flow properties3. The boundary slip was first analyzed by Navier in 1823. He proposed the so-called Navier slip model to quantify the boundary slip phenomenon by introduce the concept of slip length which defined as a distance from the boundary where the linearly extrapolated fluid velocity profile vanishes.
Many experiments2,4–7 and simulations3,8–12 demonstrated that the typical magnitude of the slip length is in the order of tens nanometers. Such small value of the slip length can be safely ignored in the macroflows, which leads to the no-slip boundary condition was widely used in the past centuries in the numerical simulation and theoretical analysis. However, the magnitude of slip length has significant influence on the flow properties in micro and nano scale13,14. The experimental studies of slip length are difficult because it is very hard to resolve the fluid velocity profile in the region near the liquid/solid interface at these length scales15. Alternatively, molecular dynamics (MD) simulations have widely used to investigate the slip properties of liquid flowing past solid surface since it can resolve the velocity profile from the atomistic level13,14,16–27. Moreover, there are no assumptions about the slip velocity at the interface are required.
It has been found that the degree of slip at liquid-wall interface is mainly controlled by the liquid-wall interaction, the degree of commensurability of liquid and solid structures at the interface, and diffusion of fluid molecules near the wall. It is intuitive to understand that the slip length inversely depends on the liquid-wall interaction, which was demonstrated by many MD studies3,10,12,16,17,19,28,29. However, Hu et al.30 show that this is not a universal case, that is, the slip length is positively correlated to the liquid-wall interaction when the liquid-wall interaction is small enough. A significant advance understanding of the slip is that the slip length is well correlated with the main peak of static structure factor in the first fluid layer3,16,17,19. Furthermore, it was found that the slip length is proportional to the collective relaxation coefficient of the fluid molecules near the wall for weak liquid-wall interactions and smooth surfaces19.
Besides the general understanding slip of simple liquid over solid surface, the liquid water over solid substrate attracted abiding interesting because of the practical importance8,21,22,27,28,31,32. Sendner et al.22 examined the slip behavior and structure of water at hydrophobic and hydrophilic diamond surfaces via nonequilibrium MD simulations. They found that the slip length negatively depends on the water-solid interaction strength. Moreover, they proposed a heuristic scaling relations between slip length, contact angle, and depletion layer thickness. Falk et al.31 studied the slip behaviors of water at graphitic interfaces with various topologies to disentangle confinement and curvature effects on slip. A strong curvature dependence of slip length was identified. At the same water-solid interaction energy, the carbon nanotube produces larger slip compared with the graphene slab. They further analyzed this curvature dependence by considering the water ordering structure that shows a curvature-induced incommensurability between the water and carbon structures.
The distinguished characteristic of slip of liquid water over solid surface is that the water molecule is highly polar. Therefore, liquid water will exhibit unique properties when it is in contact with a charged surface. Also, the charged surface produces an addition approach to control the water flow properties at micro- and nanoscale. Yoshida et al.29 examined the electrokinetic flows of an aqueous NaCl solution in nanochannels with negatively charged surfaces using MD simulations. They found that the larger surface charge density decreases the transport coefficients because the charged surface can strongly bound the counter-ions onto the vicinity of solid surface. Celebi et al.33,34 investigated the influence of surface charge density on the deionized water flow through positively charged graphene nano-channels using MD simulations. They found that the slip length decreases with the increasing surface charge density. In addition, they notice that the water molecules reorient their dipoles with oxygen atoms facing the positively charged surfaces. The previous studies3,16,22 show that the water-solid interaction energy is also significantly influence the liquid density and slip length of liquid water over solid surface. However, the combination effects of surface charge density and water-solid interaction on the water structure and slip properties are not systematically investigated.
In this work, we investigate the slip behaviors and structure of liquid water flowing between two charged solid planar walls using non-equilibrium MD simulations. Both the positive and negative charged walls are considered. The slip behaviors and structures of liquid water near walls are detailed investigated under different water-solid interaction energies and surface charge densities. The slip length increases at smaller water-solid interaction energies and surface charge densities. At the largest surface charge density, the slip length nearly independent of the water-solid interaction energy. Interestingly, we find that the positive charged surface induces larger slip at the small surface charge density than that by the negative charged surface. While, at large surface charge density, the opposite correlation is observed. The structure of liquid water was studied by considering the static structure factor of within in the first liquid water layer, which is used to rationalize the slip behaviors. The surface charge increases the ordering structure of liquid water leading to the decrease of slip length. The increase of the surface charge density changes the dependence of the main peak of the static structure on the water-solid interaction energy from nonlinear relationship to linear relationship. This is the origin of the dependence of slip length on the water-solid interaction energy. Furthermore, we identified a universal relationship between the main peak of static structure factor at different water-solid interaction energies and surface charge densities. The results of the present work open perspectives for modeling complex systems with combined effects of surface charge and wettability.
Methods
We consider Poiseuille liquid water flows confined between two charged planar solid walls as shown in Fig. 1. Each wall is made of four layers constructed as face-centered-cubic structure with lattice constant of 4.05 Å. Solid walls were oriented on the xz plane. Dimensions of the simulation domain were set as 7.98 × 6.84 × 3.85 nm in the lateral (x) and vertical (y) and longitudinal (z) directions, respectively. The channel height is h = 4.0 nm, which is large enough to produce a bulk region in the center of channel27,33,34.
Figure 1.
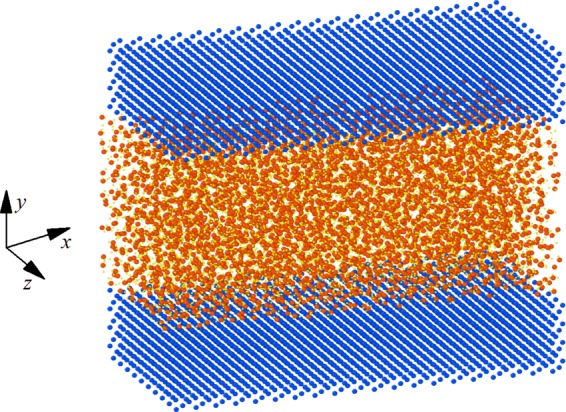
The simulation model of liquid water confined between two planar atomistic smooth wall. Each wall consists of 3200 atoms. There are 4394 molecules in liquid water.
The interaction between atoms were modeled using Lennard-Jones (LJ) and Coulomb potentials given by,
| 1 |
where ε and σ are the characteristic energy and length of the LJ potential. ε0 is the vacuum permittivity, qi is the particle charges, and rij is the distance between two atoms i and j. The interaction potential parameters between Oxygen atoms are εoo = 0.1553 Kcal/mol and σoo = 3.166 Å. The LJ interactions involve Hydrogen atoms are set as zero. The mass of Oxygen and Hydrogen atoms are 15.9994 g/mol and 1.008 g/mol. The charge of Oxygen and Hydrogen atoms are −0.820e and 0.410e, where e is the charge of a proton. The LJ characteristic length between Oxygen and solid atoms is σoo = 3.166 Å. The interaction energy between Oxygen and solid wall atoms (εwo) is changed to study the influence of wettability of solid surface on the flow properties.
Water molecules were modeled using a rigid SPC/E model. We used SHAKE algorithm35 to keep the bond length and angle of water molecules rigid. There is no interaction between solid atoms to model a rigid wall model, which can be used to improve the computational efficiency. The charge was equally distributed on the solid atoms at the innermost layers, and the rest solid atoms are neutral. The upper wall is positive charged and the lower wall is negative charged, which makes the system to satisfy the neutrality of the simulation box, thus, the system can be accurately solved by the Particle-Particle-Particle-Mesh (PPPM) algorithm36. Also, the influence of both the positive and negative charge on the slip behavior and structure of water can be considered in a single system. The surface charge density (CD) consider in the work is CD = 0 μC/cm2 to 26.24 μC/cm2, which is the similar to the previous study33,34,37,38. We used a cutoff distance of 1 nm for all LJ calculations and Coulomb potential. The Coulomb potentials is solved using the Particle-Particle-Particle-Mesh (PPPM) algorithm36.
The planar Poiseuille flow was induced by applying a constant acceleration force ax to each Oxygen and Hydrogen atom in the +x direction. At the beginning of the simulation, the Nosé-Hoover thermostat was applied to the water molecular at the temperature of 300 K and the bulk density of water at 1000 kg/m3. After additional 106 MD time steps, the constant acceleration force was applied to Oxygen and Hydrogen atoms. The thermostat was only applied in the direction perpendicular to the flow direction. The time interval of 106 MD time steps was used to reach the steady Poiseuille flow. The velocity and density profiles were averaged within slices of thickness Δy = 0.2 Å for additional 2 × 10⁶ MD time steps. All MD simulations were carried out using the open-source LAMMPS MD code39 with the time step Δt = 1 fs.
The slip length was computed using the Navier slip model, , where vS and are the slip velocity and shear rate at the water-solid interface. The locations of the interfaces were defined at the lattice positions of the bottom layer of the upper wall and the top layer of the lower wall. To obtain the parameters, vS and , we firstly fit the velocity profile in the central part of the channel using a parabolic function. Thus, we will get the mathematical expression of the velocity profiles, as well as expression of the shear rate profile. Finally, we take the position of the water-solid interface into the corresponding expression to obtain the value of vS and , respectively. This procedure used to calculate the slip length is the same as previous studies3,13–19,21,25,27.
Results and Discussions
Density and velocity profiles
Figure 2 presents the representative density profiles under different surface charge densities and water-solid interaction energies. It can be seen from the Fig. 2 that the density profiles exhibit profound decaying oscillation near two walls, and in the center part of channels, the density of water is equal to the expected values. The first peak of density profiles adjoining the walls is the so-called contact density, which is closely related to the magnitude of slip length16,23. For given surface charge density, increasing the water-solid interaction produces larger contact density. And, larger surface charge density also increases the magnitude of contact density for give water-solid interaction energy. In addition, the presence of surface charge changes the oscillation phase of density profiles. It is interesting to note that the negative and positive surface charge has different influence on the density profile. At small surface charge density (CD = 6.56 μC/cm2), the positive surface charge induces larger contact density than that in the case of negative charged surface, while, at large surface charge density (CD = 26.24 μC/cm2), the opposite trend is observed. A correlation between the liquid water structure near the wall and the slip length will be examined in the next section.
Figure 2.
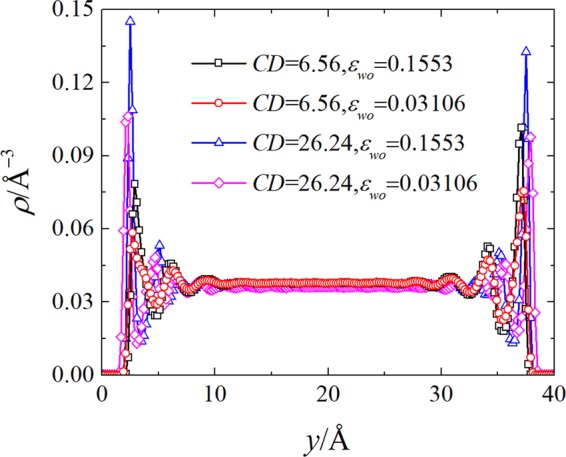
The density profiles for the indicated surface charge densities (CD) and water-solid interaction energies (εwo).
For nanoconfined fluids, the velocity profiles in the central part of the channel are well described by the continuum fluid dynamics3,16,30,40. To remind, the solution of the Navier-Stokes for incompressible steady Poiseuille flow without slip BC are given by
| 2 |
where H is the channel height. Here, μ are the fluid shear viscosity. However, it was shown that Eq. (2) are modified by the velocity slip at the water-solid interface when the surface charge density or water-solid interaction energy are varied3,16,30,40.
Figure 3 shows representative velocity profiles in steady-state flow for selected values of surface charge density and water-solid interaction. As is evident, the liquid water velocity profiles in the center part of channel are well fitted by a parabola, as predicted by the continuum hydrodynamics [see Eq. (2)]. It can be clearly seen that the slip velocity vS increases with the decreasing water-solid interaction energy for the surface charge density CD = 6.56 μC/cm2. By sharp contrast, the slip velocity only slightly increases with the decreasing water-solid interaction energy for the surface charge density CD = 24.64 μC/cm2. At given water-solid interaction, εwo = 0.1553 Kcal/mol and 0.03106 cal/mol, increasing the surface charge density decreases the slip velocity. It is also interesting to note that the positive charge produces larger slip velocity than that by the negative charge for the surface charge density CD = 6.56 μC/cm2. While, the negative charge produces larger slip velocity than that by the positive charge for the surface charge density CD = 24.64 μC/cm2. A more detailed analysis of the slip behavior for different surface charge density and water-solid interaction energies will be presented in the next section.
Figure 3.
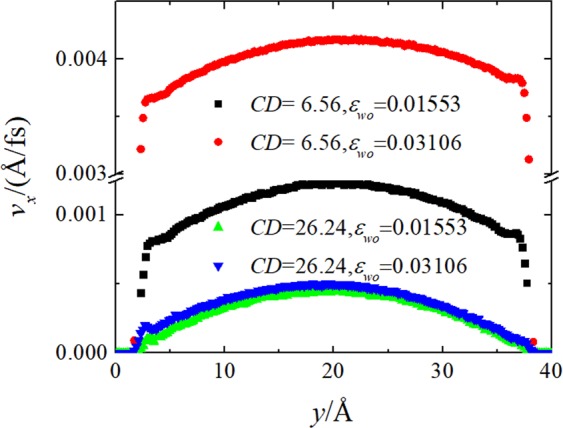
The velocity profiles for the indicated surface charge densities (CD) and water-solid interaction energies (εwo).
Slip behaviors for different surface charge densities and water-solid interaction energies
The variation of the slip length with increasing water-solid interaction for different values of the surface charge density is presented in Fig. 4. The data for neutral solid walls, are also shown in Fig. 4 for comparison. For neutral solid walls, the slip length increases with the decreasing water-solid interaction energy. The relationship between the slip length and water-solid interaction is nonlinear, and the dependence of slip length can be fitted using a quadratic function, see the black squares in Fig. 4. As the surface is charged, the slip length is decreased for given water-solid interaction energy, which is consistent with the velocity profiles shown in Fig. 3. Increasing surface charge density weakens the influence of water-solid interaction energy on the slip length. As the surface charge density increases to , the effect of water-solid interaction energy on the slip length becomes negligible. Moreover, the magnitude of the slip length is significantly reduced under large surface charge density. At the largest surface charge density, the boundary condition of water become no-slip. Notably, the presence of surface charge changes the nonlinear dependence of slip length on the water-solid interaction energy to linear manner. This linear function relationship between the slip length and water-solid interaction energy is well hold for the surface charge density, CD = 6.56 μC/cm2 to 24.64 μC/cm2. Being consistent with the influence of surface charge on the velocity, the positive charge produces larger slip length than that by the negative charge for the surface charge density CD = 6.56 μC/cm2. While, the negative charge produces larger slip length than that by the positive charge for the surface charge density CD > 6.56 μC/cm2.
Figure 4.
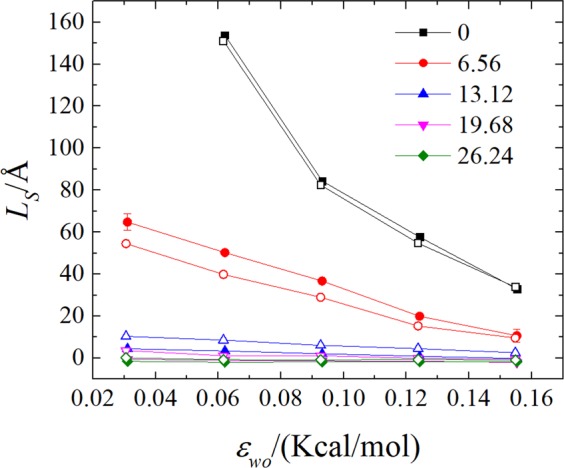
The slip length for the indicated surface charge densities (CD) and water-solid interaction energies (εwo). The closed and open data point indicate the slip length calculated at the positive and negative charge walls, respectively.
Analysis of slip behaviors from the static structure factor
The slip behaviors of liquid water can be understood by examining the ordering structure of liquid water at the water-solid interface. The induced structure of liquid water by the solid walls can be quantitatively measured using the concept of the in-plane static structure factor, S(k). It can be seen in the density profiles that the liquid water near the wall exhibit several layers and the in-plane static structure factor typically calculated using the atom positions within each layer. Thus S(k) is a quantitative measure of the in-plane ordering for each layer of water near walls16,17,19. It has been demonstrated in the previous MD studies17,19 that the slip length is inversely correlated with the magnitude of the main peak of the in-plane static structure factor of the first water layer (FWL), S(G1), where G1 is the shortest reciprocal-lattice vector. The first water layer is defined as the water molecules within the region between the wall and first minimum in the density profile16,17,19. The in-plane static structure factor is given by16,17
where rj = (xj, zj) is the two-dimensional position vector of the j-th atom and the sum is taken over N atoms within the FWL. Here, k = (kx, kz) is the reciprocal vector parallel to the walls. In a finite system, the components of the vector k are restricted to integer multiples of 2π/L, where L is the system size in the x and z directions. Thus, the larger the system size, the smaller the values of kx and kz can be.
The quantity S(G1) depends on the system size and the number of atoms. In our simulations, the average number of fluid atoms in the FWL depends of the water-solid interaction energy. Therefore, the size-independent quantity S(G1)/S(0), averaged over 1 ns, was used to correlate the water structure with the slip length. We first shown examples of static structure factor with zero surface charge density for different water-solid interaction energy, as shown in Fig. 5. At strong water-solid interaction energy, εwo = 0.1553 Kcal/mol, the in-plane static structure factor, S(G1)/S(0), exhibits decaying oscillation and is characterized as a sharp peak at the shortest reciprocal-lattice vector. This sharp peak indicates that the water forms finite degree of ordering but the water molecules are not crystallized yet17,23. The degree of ordering is referred that to what extent the water molecules arrange like a solid16,17,23,30,31. And the degree of ordering within the water molecular near the walls can be measured by the value of the main peak of the in-plane static structure factor.
Figure 5.

Examples of static structure factor with zero surface charge density for different water-solid interaction energy.
The larger of the value of the main peak of the in-plane static structure factor, the higher degree of ordering within the water molecular near the walls. The solid wall is a face-centered-cubic structure indicating that the solid atoms are arranged as a certain periodical manner, which generates a similar periodical potential field above the solid walls41. It has been showed that the ordering within the water molecular near the walls is induced by the periodical potential generated by the walls16,23,30,31. Larger water-solid interaction energy will induce more corrugated periodical potential, and the mobility of water molecules are more constrained by the periodical potential. In other words, the diffusion of water molecules becomes weaker leading to higher ordering, i.e., larger main peak of the in-plane static structure factor. Therefore, the slip length is less at stronger water-solid interaction energy. As the water-solid interaction energy decreases to εwo = 0.12424 Kcal/mol and 0.06212 Kcal/mol, the periodical potential induced by the walls becomes more smoother leading to weaker constraint of wall potential to the water molecule, i.e., the value of the main peak of the in-plane static structure factor becomes smaller, hence, larger slip.
In Fig. 6, we present the normalized main peak of the in-plane static structure at different water-solid interaction energies for indicated surface charge density. It can be seen from Fig. 6 that the value of the normalized main peak of the in-plane static structure decreases with the decreasing water-solid interaction energy for given surface charge density. This is consistent with the slip behaviors presented in the Fig. 4. For given water-solid interaction energy, the presence of surface charge increases the normalized main peak of the in-plane static structure leading to higher degree of ordering structure within the water near walls. Therefore, the slip length decreases when the surface is charged and larger surface charge density produce less slip.
Figure 6.
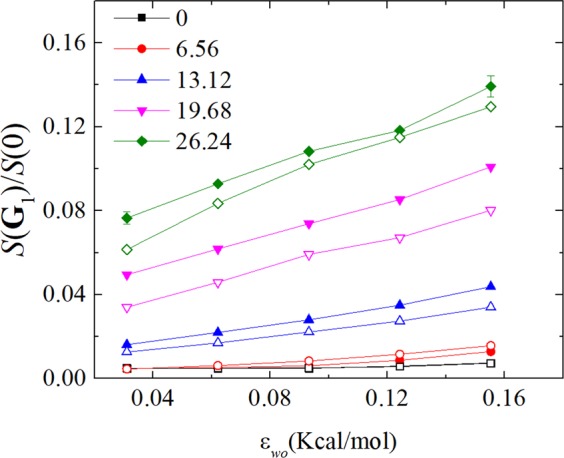
The normalized main peak of the in-plane static structure, S(G1)/S(0), at different water-solid interaction energy for indicated surface charge density. The closed and open data point indicate the slip length calculated at the positive and negative charge walls, respectively.
It can be seen from Fig. 6 that the dependence of the normalized main peak of the in-plane static structure on the water-solid interaction energy changes from nonlinear relationship to linear relationship, which induces the similar change of the dependence of slip length on the water-solid interaction energy. At the surface charge density, CD = 6.56 μC/cm2, the positive charge produces smaller the normalized main peak of the in-plane static structure, (hence, larger slip length) than that by the negative charge. While, the negative charge produces smaller the normalized main peak of the in-plane static structure, (hence, larger slip length) than that by the positive charge for the surface charge density CD > 6.56 μC/cm2. The detailed correlation between the slip length and the main peak of the in-plane static structure is presented below.
The correlation between the value of the liquid water structure factor evaluated at the first reciprocal lattice vector G1 and the slip length is presented in Fig. 7. It can be seen from the Fig. 7 that the data of slip length as a function of the normalized main peak of the in-plane structure factor collapse onto a single curve for different water-solid interactions and surface charge densities. This scaling relationship between the slip length and the normalized main peak of the in-plane structure factor well holds in both cases of positive and negative charge surface. The similar scaling relationship was also found for simple fluid over atomistic smooth walls17. We extend this relationship to the situation of liquid water flowing past the charged surface.
Figure 7.
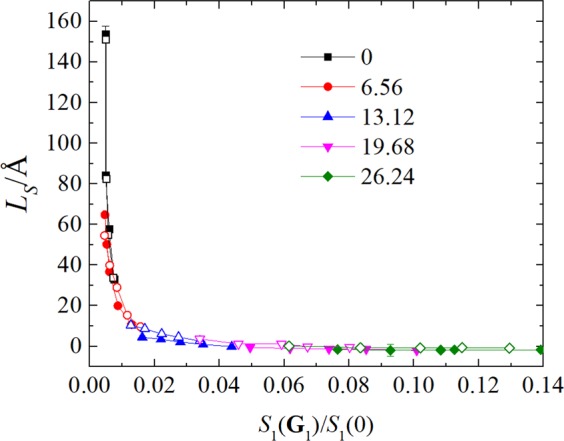
Behavior of the slip length, LS, as a function of the normalized main peak of the in-plane structure factor, S(G1)/S(0). The closed and open data point indicate the slip length calculated at the positive and negative charge walls, respectively.
Conclusion
In this paper, the effect of surface charge density and water-solid interaction on the slip length and structure in a flow of liquid water was studied by non-equilibrium molecular dynamics simulations. A constant acceleration force was used to generate the Poiseuille-like flow condition. The upper and lower walls are positive and negative charged, respectively.
It was shown that the slip length decreases with the increasing of the surface charge density and water-solid interaction energy. And the ordering structure of liquid water near walls becomes higher with the increasing of the surface charge density and water-solid interaction. Interestingly, the positive charged surface induces less ordering structure and larger slip at the small surface charge density than that by the negative charged surface. While, at large surface charge density, the opposite correlation is observed. The presence of the surface charge increases the ordering structure of liquid water leading to the decrease of slip length. The increase of the surface charge density changes the dependence of the normalized main peak of the static structure factor on the water-solid interaction energy from nonlinear relationship to linear relationship leading to the similar change of the dependence of the slip length on the water-solid interaction. Furthermore, we find that the relationship between the slip length and the normalized main peak of static structure factor collapses onto a single curve for different water-solid interaction energy and surface charge density. The results of the present work open perspectives for modeling complex systems with combined effects of surface charge and wettability.
Acknowledgements
This work was supported by the National Natural Science Foundation of China (grant number 21606099).
Author contributions
X.Y. and Y.L. proposed the idea. X.G. wrote the manuscript. M.Y. and Q.L. processed the data and produce the figures. W.Z. analyzed the results. All authors reviewed the manuscript.
Competing interests
The authors declare no competing interests.
Footnotes
Publisher’s note Springer Nature remains neutral with regard to jurisdictional claims in published maps and institutional affiliations.
Contributor Information
Xiaopeng Yu, Email: yyxxpp@jlnu.edu.cn.
Yang Lu, Email: luyang33@126.com.
References
- 1.Samiei E, Tabrizian M, Hoorfar M. A review of digital microfluidics as portable platforms for lab-on a-chip applications. Lab Chip. 2016;16:2376–2396. doi: 10.1039/C6LC00387G. [DOI] [PubMed] [Google Scholar]
- 2.Squires TM, Quake SR. Microfluidics: Fluid physics at the nanoliter scale. Rev. Mod. Phys. 2005;77:977–1026. doi: 10.1103/RevModPhys.77.977. [DOI] [Google Scholar]
- 3.Priezjev NV. Rate-dependent slip boundary conditions for simple fluids. Phys. Rev. E. 2007;75:051605. doi: 10.1103/PhysRevE.75.051605. [DOI] [PubMed] [Google Scholar]
- 4.Granick S, Zhu YX, Lee H. Slippery questions about complex fluids flowing past solids. Nat. Mater. 2003;2:221–227. doi: 10.1038/nmat854. [DOI] [PubMed] [Google Scholar]
- 5.Leger L. Friction mechanisms and interfacial slip at fluid-solid interfaces. J. Phys-condens. mat. 2003;15:S19–S29. doi: 10.1088/0953-8984/15/1/303. [DOI] [Google Scholar]
- 6.Spikes H, Granick S. Equation for slip of simple liquids at smooth solid surfaces. Langmuir. 2003;19:5065–5071. doi: 10.1021/la034123j. [DOI] [Google Scholar]
- 7.Choi CH, Ulmanella U, Kim J, Ho CM, Kim CJ. Effective slip and friction reduction in nanograted superhydrophobic microchannels. Phys. Fluids. 2006;18:087105. doi: 10.1063/1.2337669. [DOI] [Google Scholar]
- 8.Yang J, Kwok DY. Effect of liquid slip in electrokinetic parallel-plate microchannel flow. J. Colloid Interf. Sci. 2003;260:225–233. doi: 10.1016/S0021-9797(02)00158-3. [DOI] [PubMed] [Google Scholar]
- 9.Gratton Y, Slater GW. Molecular dynamics study of tethered polymers in shear flow. Eur. Phys. J. E. 2005;17:455–465. doi: 10.1140/epje/i2005-10020-0. [DOI] [PubMed] [Google Scholar]
- 10.Asproulis N, Drikakis D. Boundary slip dependency on surface stiffness. Phys. Rev. E. 2010;81:061503. doi: 10.1103/PhysRevE.81.061503. [DOI] [PubMed] [Google Scholar]
- 11.Barisik M, Beskok A. Equilibrium molecular dynamics studies on nanoscale-confined fluids. Microfluid. Nanofluid. 2011;11:269–282. doi: 10.1007/s10404-011-0794-5. [DOI] [Google Scholar]
- 12.Zhang HW, Zhang ZQ, Ye HF. Molecular dynamics-based prediction of boundary slip of fluids in nanochannels. Microfluid. Nanofluid. 2012;12:107–115. doi: 10.1007/s10404-011-0853-y. [DOI] [Google Scholar]
- 13.Lichter S, Roxin A, Mandre S. Mechanisms for liquid slip at solid surfaces. Phys. Rev. Lett. 2004;93:086001. doi: 10.1103/PhysRevLett.93.086001. [DOI] [PubMed] [Google Scholar]
- 14.Lichter S, Martini A, Snurr RQ, Wang Q. Liquid slip in nanoscale channels as a rate process. Phys. Rev. Lett. 2007;98:226001. doi: 10.1103/PhysRevLett.98.226001. [DOI] [PubMed] [Google Scholar]
- 15.Yong X, Zhang LT. Slip in nanoscale shear flow: mechanisms of interfacial friction. Microfluid. Nanofluid. 2013;14:299–308. doi: 10.1007/s10404-012-1048-x. [DOI] [Google Scholar]
- 16.Priezjev NV. Effect of surface roughness on rate-dependent slip in simple fluids. J. Chem. Phys. 2007;127:144708. doi: 10.1063/1.2796172. [DOI] [PubMed] [Google Scholar]
- 17.Thompson PA, Robbins MO. Shear-flow near solids-epitaxial order and flow boundary-conditions. Phys. Rev. A. 1990;41:6830–6837. doi: 10.1103/PhysRevA.41.6830. [DOI] [PubMed] [Google Scholar]
- 18.Thompson PA, Troian SM. A general boundary condition for liquid flow at solid surfaces. Nature. 1997;389:360–362. doi: 10.1038/38686. [DOI] [Google Scholar]
- 19.Barrat JL, Bocquet L. Influence of wetting properties on hydrodynamic boundary conditions at a fluid/solid interface. Faraday Discuss. 1999;112:119–127. doi: 10.1039/a809733j. [DOI] [Google Scholar]
- 20.Priezjev NV, Troian SM. Molecular origin and dynamic behavior of slip in sheared polymer films. Phys. Rev. Lett. 2004;92:018302. doi: 10.1103/PhysRevLett.92.018302. [DOI] [PubMed] [Google Scholar]
- 21.Huang DM, Sendner C, Horinek D, Netz RR, Bocquet L. Water Slippage versus Contact Angle: A Quasiuniversal Relationship. Phys. Rev. Lett. 2008;101:226101. doi: 10.1103/PhysRevLett.101.226101. [DOI] [PubMed] [Google Scholar]
- 22.Sendner C, Horinek D, Bocquet L, Netz RR. Interfacial Water at Hydrophobic and Hydrophilic Surfaces: Slip, Viscosity, and Diffusion. Langmuir. 2009;25:10768–10781. doi: 10.1021/la901314b. [DOI] [PubMed] [Google Scholar]
- 23.Yong X, Zhang LT. Investigating liquid-solid interfacial phenomena in a Couette flow at nanoscale. Phys. Rev. E. 2010;82:056313. doi: 10.1103/PhysRevE.82.056313. [DOI] [PubMed] [Google Scholar]
- 24.Wang FC, Zhao YP. Slip boundary conditions based on molecular kinetic theory: The critical shear stress and the energy dissipation at the liquid-solid interface. Soft Matter. 2011;7:8628–8634. doi: 10.1039/c1sm05543g. [DOI] [Google Scholar]
- 25.Zhang LT, Yong X. Nanoscale simple-fluid behavior under steady shear. Phys. Rev. E. 2012;85:051202. doi: 10.1103/PhysRevE.85.051202. [DOI] [PubMed] [Google Scholar]
- 26.Yong X, Zhang LT. Thermostats and thermostat strategies for molecular dynamics simulations of nanofluidics. J. Chem. Phys. 2013;138:084503. doi: 10.1063/1.4792202. [DOI] [PubMed] [Google Scholar]
- 27.Ramos-Alvarado B, Kumar S, Peterson GP. Hydrodynamic slip length as a surface property. Phys. Rev. E. 2016;93:023101. doi: 10.1103/PhysRevE.93.023101. [DOI] [PubMed] [Google Scholar]
- 28.Chen C, Shen LM, Ma M, Liu JZ, Zheng QS. Brownian motion-induced water slip inside carbon nanotubes. Microfluid. Nanofluid. 2014;16:305–313. doi: 10.1007/s10404-013-1247-0. [DOI] [Google Scholar]
- 29.Hiroaki Y, Hideyuki M, Tomoyuki K, Hitoshi W, Jean-Louis B. Molecular dynamics simulation of electrokinetic flow of an aqueous electrolyte solution in nanochannels. J. Chem. Phys. 2014;140:2419–2430. doi: 10.1063/1.4879547. [DOI] [PubMed] [Google Scholar]
- 30.Hu H, et al. Identifying two regimes of slip of simple fluids over smooth surfaces with weak and strong wall-fluid interaction energies. J. Chem. Phys. 2017;146:034701. doi: 10.1063/1.4973640. [DOI] [PubMed] [Google Scholar]
- 31.Falk K, Sedlmeier F, Joly L, Netz RR, Bocquet L. Molecular Origin of Fast Water Transport in Carbon Nanotube Membranes: Superlubricity versus Curvature Dependent Friction. Nano Lett. 2010;10:4067–4073. doi: 10.1021/nl1021046. [DOI] [PubMed] [Google Scholar]
- 32.Ma MD, et al. Friction of water slipping in carbon nanotubes. Phys. Rev. E. 2011;83:036316. doi: 10.1103/PhysRevE.83.036316. [DOI] [PubMed] [Google Scholar]
- 33.Celebi AT, Barisik M, Beskok A. Surface charge-dependent transport of water in graphene nano-channels. Microfluid. Nanofluid. 2017;22:7. doi: 10.1007/s10404-017-2027-z. [DOI] [PubMed] [Google Scholar]
- 34.Celebi AT, Barisik M, Beskok A. Electric field controlled transport of water in graphene nano-channels. J. Chem. Phys. 2017;147:164311. doi: 10.1063/1.4996210. [DOI] [PubMed] [Google Scholar]
- 35.Ryckaert JP, Ciccotti G, Berendsen HJC. Numerical-integration of Cartesian equations of motion of a system with constraints - molecular-dynamics of n-alkanes. J. Comput. Phys. 1977;23:327–341. doi: 10.1016/0021-9991(77)90098-5. [DOI] [Google Scholar]
- 36.Hockney R. W & Eastwood J. W. Particle-Particle-Particle-Mesh (P3m) Algorithms. Computer simulation using particles. pp. 267–304 (Taylor & Francis, 1988).
- 37.Xia X, Berkowitz ML. Electric-Field Induced Restructuring of Water at a Platinum-Water Interface: A Molecular Dynamics Computer Simulation. Phys. Rev. Lett. 1995;74:3193–3196. doi: 10.1103/PhysRevLett.74.3193. [DOI] [PubMed] [Google Scholar]
- 38.Kalluri RK, Konatham D, Striolo A. Aqueous NaCl Solutions within Charged Carbon-Slit Pores: Partition Coefficients and Density Distributions from Molecular Dynamics Simulations. J. Phys. Chem. C. 2011;115:13786–13795. doi: 10.1021/jp203086x. [DOI] [Google Scholar]
- 39.Plimpton S. Fast parallel algorithms for short-range molecular-dynamics. J. Comput. Phys. 1995;117:1–19. doi: 10.1006/jcph.1995.1039. [DOI] [Google Scholar]
- 40.Bao L, Priezjev NV, Hu H, Luo K. Effects of viscous heating and wall-fluid interaction energy on rate-dependent slip behavior of simple fluids. Phys. Rev. E. 2017;96:033110. doi: 10.1103/PhysRevE.96.033110. [DOI] [PubMed] [Google Scholar]
- 41.Bao L, Hu H, Wen J, Sepri P, Luo K. Three-Dimensional Structure of a Simple Liquid at a Face-Centered-Cubic (001) Solid Surface Interface. Sci. Rep-UK. 2016;6:29786. doi: 10.1038/srep29786. [DOI] [PMC free article] [PubMed] [Google Scholar]