Abstract
Objectives:
Studies have shown that human and peripheral blood mononuclear cells (PBMCs) are mostly used for research purposes to study several biochemical endpoints. The effects of the flavonoids, genistein, kaempferol, and quercetin on phospho tensin homolog (PTEN) levels in cancer cells (i.e., breast [BT549], lung [A549]), human embryonic kidney cells (HEK293), and the levels of lipid peroxides (LP) in PBMCs were respectively investigated.
Materials and methods:
Cancer, kidney, and PBMCs from several donors were each exposed to each of the flavonoids at concentrations of 0, 5, 10, 15, 20, and 25 μM. Our hypotheses were that exposure of cancer and kidney cells to genistein, kaempferol, and quercetin can increase PTEN and decrease lipid peroxides in PBMCs levels respectively to better cope with oxidative stress.
Results:
The results indicate that the flavonoids increased total PTEN levels in a dose-dependent manner. The effect of quercetin was more pronounced followed by genistein and kaempferol. Furthermore, decreases in lipid peroxides were observed in the PBMCs for the flavonoid-treated samples compared to those exposed to flavonoids and with oxidative stress as described by Fenton’s chemistry. Levels of LP in quercetin-treated samples were lower compared to kaempferol and genistein.
Conclusions:
The findings suggest that the flavonoids play an important role in controlling oxidative stress in several human cells.
Keywords: PTEN, PBMCs, flavonoids, lipid peroxidation, Fenton, human cells, oxidative stress
Introduction
Phosphatase and tensin homolog (PTEN) was discovered in 1997 independently by three laboratories as a tumor suppressor of which the expression is often lost in tumors (1–3). Later studies established that PTEN is a negative regulator of a major cell growth and survival signaling pathway, namely the phosphatidylinositol-3-kinase (PI3K)/Akt signaling pathway (1, 2). The biological effects of PTEN, however, are dominated by its ability to dephosphorylate the lipid substrate phosphatidylinositol-3,4,5-triphosphate (PI-3,4,5-P3) whereas protein substrates for PTEN are being discovered (4). PI-3,4,5-P3 is formed when PI3K is stimulated as a result of growth factors binding to their receptors that are coupled to PI3K (3). The enzymatic function of PTEN thus reduces the cellular concentration of PI-3,4,5-P3 and acts as a negative regulatory signaling for the PI3K mitogenic signaling pathway (3). Accumulation of PI-3,4,5-P3 serves as a major signal for growth factor accumulation where PI-3,4,5-P3 binds to the pleckstrin homology (PH) domain of downstream proteins (e.g., Akt) and provides a lipid moiety for these proteins to bind to the lipid membranes (4). Binding of PI-3,4,5-P3 to the PH domain also changes the confirmation of these proteins so they can later be activated by phosphorylation. By reducing the intracellular levels of PI-3,4,5-P3, PTEN inhibits the activation of downstream proteins of the PI3K pathway, including the serine/threonine kinase Akt and the protein kinase C (3). It has also been reported that activation of hPPARγ causes an increase in PTEN protein levels or a decrease in transforming growth factor β1 levels, resulting in tumor suppression through induction of apoptosis, inhibition of cellular growth, and/or promotion of cellular differentiation of cancer cells (5–7).
Peripheral blood mononuclear cells (PBMCs) generally refer to monocytes and lymphocytes, representing cells of the innate and adaptive immune systems. PBMCs are a promising target tissue in the field of nutrigenomics because they seem to reflect the effects of dietary modifications at the level of gene expression (8). Current studies have demonstrated that PBMCs seem to reflect liver environment and complement adipose tissue findings in transcriptomics (8). The main function of the immune system is to prevent or limit infections by microorganisms such as bacteria, viruses, fungi, and parasites. Immune responses are mediated by lymphocytes (white blood cells [WBCs], which derive from precursors in the bone marrow and then migrate to guard peripheral tissues (9). For example, WBCs are cells of the adaptive immune system, which recognize specific pathogens and act by protecting against recurrent infections and are the largest cell population covered by the more general term PBMCs, which also include monocytes (9). PBMCs seem to reflect hepatic regulation of cholesterol metabolism (10) and can migrate through the blood circulation and infiltrate various tissues such as the endothelium and adipose tissue (11). Since PBMCs can also reflect the responses of dietary modifications and drugs at the level of gene expression (12, 13), they have also been a subject of great interest in clinical and intervention studies for transcriptomics profiling (8). Furthermore, PBMCs are convenient because they can be easily and repeatedly collected in sufficient quantities, in contrast to adipose, muscle, and liver tissues. However, PBMC transcriptomics from dietary intervention studies have not resulted yet in clear confirmation of candidate genes related to disease risk. Use of microarray technology in larger well-designed dietary intervention studies are still needed for exploring PBMCs’ potential in the field of nutrigenomics (8).
In our recent studies on the effects of quercetin, kaempferol, and exogenous glutathione on phospho- and total-Akt in 3T3-L1 preadipocytes we observed significant decreases in phospho-Akt levels in cells treated each with either quercetin, kaempferol, or reduced Glutathione (GSH) at several doses compared to their respective controls (14). As described in the above studies (14), 3T3-L1 preadipocytes, exposed to quercetin, kaempferol, and GSH respectively blocked the activation of Akt, suggesting the importance of quercetin, kaempferol and GSH in preadipocytes cell differentiation (14). In view of those findings, it became obvious and plausible to hypothesize that the decreases in Akt following exposure to the flavonoids may indicate a direct increase on the expression levels of PTEN in cells. Furthermore, PBMC gene expression after dietary intervention studies can be used for studying the response of certain genes related to fatty acid and cholesterol metabolism and to explore the response of dietary interventions in relation to inflammation. Thus, the purpose of the present study was to further investigate the effects of exposure of several doses each of genistein, kaempferol, and quercetin (i.e., 0, 5, 10, 15, 20, and 25 μM doses) on the levels of PTEN in two cancer cell lines, namely, breast (BT549) and lung (A549) and human embryonic kidney cells (HEK293). Second, we sought to study the effects of the flavonoids on lipid peroxides in PBMCs before and following exposure to oxidative stress through the Fenton’s chemistry. Our study will test two hypotheses: (1) Exposure of cancer cells to either genistein, kaempferol, or quercetin can increase PTEN levels in those cells and to better cope with oxidative stress. (2) The flavonoids might help individuals better cope with oxidative damage through the inflammatory processes by PBMCs cells by decreasing the levels of lipid peroxides. The proposed studies represent an effort to define how genistein, kaempferol, and quercetin modulate the expression levels of PTEN, a tumor suppressor gene, in lung, breast, and kidney cells as wells the levels of oxidation in PBMC cells following exposure. In terms of future directions, we will follow the lead set by the experimental results.
Materials and methods
Chemicals
Isoflavone kaempferol (3,5,7-trihydroxy-2-(4-hydroxy-phenyl)-4H-chromen-4-one) and genistein (4′,5,7-trihydroxy isoflavone) and quercetin dihydrate (3,3′,4′,5,7-Pentahydroxyflavone dihydrate) were from Sigma-Aldrich (St. Louis, MO). Disodium Ethylenediaminetetraacetic acid (EDTA), ferrous sulfate (FeSO4), Dulbecco’s Modified Eagle’s Medium (DMEM), Roswell Park Memorial Institute (RPMI) media, and hydrogen peroxide(H2O2), were purchased from Fisher Scientific Suwanee, GA. Lung (A549), breast (BT549), and kidney (HEK293) cancer cell lines were obtained from the American Type Culture Collection, Manassas, VA. Blood filters were generously donated by the American Red Cross of Nashville, TN. All chemicals were of high purity (>99%), according to the manufacturer, and were used without further purification.
Preparation of PBMCs
peripheral blood mononuclear cells’ (PBMCs), were isolated from leukocyte filters (Pall corporation, Westborough, MA-Reduced red blood cells platelets leukocytes [RCPL]) obtained from the Red Cross Blood Bank Facility (Nashville, TN) as described in (15) with some modifications. Leukocytes were retrieved from the filters by back-flushing them with an elution medium (sterile phosphate buffered saline [PBS] pH 7.4 containing 5 mM disodium EDTA and 2.5% [w/v] sucrose) and collecting the eluent. The eluent was layered onto Ficoll-Hypaque (1.077 g/mL) and centrifuged at 1200 g for 30–50 minutes. Granulocytes and red cells pelleted at the bottom of the tube while the PBMCs floated on the Ficoll-Hypaque. Mononuclear cells were collected and washed with PBS (500 × g, 10 minutes). Following washing, the cells were layered on bovine calf serum for platelet removal. The cells were then suspended in RPMI-1640 complete medium which consisted of RPMI-1640 supplemented with 10% heat-inactivated bovine calf serum, 2 mM L-glutamine, and 50 U penicillin G with 50 μg streptomycin/ml. This preparation constituted PBMCs.
Culturing of cancer, PBMC cells, and treatment with the flavonoids
BT549, A549, HEK293, and PBMCs were maintained at 37 °C under 5% CO2 atmosphere in DMEM containing 4 mM L-glutamine, 4500 mg/L glucose, 1 mM sodium pyruvate, 1500 mg/L sodium bicarbonate, 10% fetal bovine serum, and 1% penicillin and streptomycin5. At 80% confluence in T-75 flasks, the cancer cells were trypsinized with 3 ml of trypsin-EDTA solution and later subcultured in six-well plates (at 5 × 10⁵ cells/well) before treatments with various flavonoids at the doses each of 0, 5, 10, 15, 20, and 25 μM. PBMC cells were also seeded in six-well plates (at 1 × 10⁶ cells/well) before treatments with the flavonoids. All the cells following the treatments were cultured for 24 hours in the incubator under the same conditions as described above.
Cell viability
Cell viability was assessed at the beginning and end of each exposure period. Viability was determined using the trypan blue exclusion method. Cells were briefly mixed with trypan blue and counted using a hemocytometer. The total number of cells and the total number of live cells were determined for both control and treated cells to determine the percentage viable cells.
Sample preparation following the treatments with flavonoids
Cancer and human embryonic kidney cells were trypsinized with 1 ml trypsin-EDTA and transferred into Eppendorf tubes. Wells were each washed with 330 μl DMEM media and transferred into their respective tubes. PBMCs were also removed from the six well plates and placed into Eppendorf tubes. The tubes were centrifuged in a refrigerated Eppendorf table top centrifuge (Model # 5804 R, Suwanee, GA) at 4 °C for 10 minutes at 3000 RPM. For PTEN analysis cells were lysed as described by the Ray Bio® Human/Mouse/Rat Phospho-PTEN (S380) and Total PTEN ELISA Kit (Cat.#: PEL-PTEN-S380-T) with the following modifications. Cells were rinsed with sterile PBS to remove any remaining medium before adding the lysis buffer. They were then solubilized in 1X lysis buffer containing protease and phosphatase inhibitors. Cell lysates were pipetted up and down to re-suspend and incubated with shaking at 8 °C for 30 minutes. Lysates were then centrifuged at 13,000 RPM for 10 minutes 4 °C, and the supernatants were transferred into clean test tubes and stored at −70 °C before use. For the analysis of lipid peroxides (measured as malonaldehyde [MDA] levels) PBMCs were sonicated with 100 μL cold PBS on ice using the Fisher Sonic Dismembrator (Model#: 100, Suwanee, GA) at a setting of 3 for 20 seconds for each sample. Samples were centrifuged as described for the cell lysates and subsequently stored at −70 °C before use.
Analysis of PTEN in cancer cell lines
PTEN levels in the cells after the treatments was analyzed as described by the RayBiotech Human/Mouse/Rat Total PTEN ELISA Kit (Cat.#: PEL-PTEN-S380-T) with the following modifications as described below.
Preparation of positive control
Briefly, 400 μl of the 1x assay diluent was added to the vial containing the lyophilized powder (HELACALS001-1 used as positive control) to prepare the serial dilutions. Care was taken to make sure that the lyophilized powder was thoroughly dissolved in 400 μl of assay diluent by gentle mix to prepare the Positive Control (P-1) to produce a dilution series as indicated below. 300 μl of the 1x assay diluent was pipetted into several Eppendorf tubes (i.e., P-2, P-3, and P4) and 150 μl from the P-1 solution and the rest of the P-tubes were transferred in sequential order to produce a dilution series of P-1, P-2, P-3, and P-4. Care was taken to bring all reagents and samples to room temperature (18–25 °C) before use.
Assay procedure
100 μl of each sample or positive control (HELACALS001-1) were added to the appropriate 96-well plates and covered with the plate holder and incubated overnight at 4 °C with shaking. Following the incubation, the solution in the wells was discarded and each well washed four times with the 1 × wash solution. Care was taken to remove completely any residual liquid to enhance a good performance of the assay by inverting the plate and blotting against a clean paper towel. 100 μl of the prepared 1x detection antibody, anti-PTEN (S380) or anti-PTEN, was added to the appropriate wells and incubated for 1 hour at room temperature with shaking. The liquid in the wells was discarded after the incubation and the wells were each washed three times with the wash buffer as described above.
Further, 100 μl of the prepared 1× HRP-conjugated anti-rabbit IgG against anti-PTEN (S380) or HRP-conjugated streptavidin were added to the corresponding wells and incubated for 1 hour at room temperature with shaking. The solution in the wells was discarded and washed three times with the wash buffer as previously described. After the incubation, 100 μl of the 3,3′,5,5′-tetramethylbenzidine one-step substrate reagent was added to each well and incubated at room temperature in the dark with shaking for 30 minutes. Following the incubation, 50 μl of the stop solution (i.e., 0.2 M sulfuric acid) [H2SO4]), was added to each sample and the samples read in a Synergy 96 well plate reader (Winooski, VT) at 450 nm.
Analysis of lipid peroxides in PBMCs
MDA was analyzed as prescribed by the Calbiochem lipid peroxidation assay kit (Cat. No. 437634) with some modifications as described below. Cells were lysed by repetitive freezing/thawing in sterile PBS. Then 650 μl of diluted 10.3 mM N-methyl-2-phenylindole, in acetonitrile, was added to 200 μl of cell lysate and vortexed for three to four - seconds. To assay for MDA only, 150 μl of the 12 N HCl solution instead of the methanesulfonic acid was added to the samples, mixed and tightly closed. Samples were incubated at 45 °C for 60 minutes, cooled on ice and the absorbance measured at 586 nm in the plate reader as described above under the assay procedure for PTEN. For controls, a blank sample was prepared which contains all the reagents and the sterile PBS. Standard curves for MDA (as bis[dimethyl acetal[ in 20 mM Tris-HCl buffer, pH 7.4) was prepared and used for calculating the molar extinction coefficient (ε) of the measured product which was equal to the slope of the line. The following equation was used to calculate the MDA levels in the sample by the equation below:
Where: A is the absorbance at 586 nm for the sample A0 is the absorbance of the blank
D is the sample dilution factor (200 μl of a sample in a total volume of 1 ml)
ε is the apparent molar extinction coefficient obtained from the standard curve.
Care was taken to ensure that those cloudy samples or samples containing cellular debris were transferred to polypropylene micro tubes and centrifuged at 15,000 × g for 10 minutes just prior to measuring the absorbance. The absorbance of the clear supernatant was read at 586 in a 96-well BioTek Synergi plate reader (Wilnooski, VT). MDA levels in cells were corrected for protein and the results expressed as MDA/mg protein.
Statistical analysis
Results are expressed as means ± standard deviation. Statistical significance was determined by two-way analysis of variance (ANOVA) followed by student’s t-test, and p < 0.05, was considered statistically significant. Each value in all figures represents the mean for each dose level of flavonoid and MDA tested, which was assayed in triplicates. PTEN values were measured by absorbance level as stated in the manufacturer’s protocol.
Results
Effects of flavonoids on PTEN levels in cancer cell lines
Figures 1 through 3 show the effects of exposure of each of the respective flavonoids, genistein, kaempferol, and quercetin, at 0, 5, 10, 15, 20, and 25 μM on PTEN levels in the respective cells.
Figure 1.
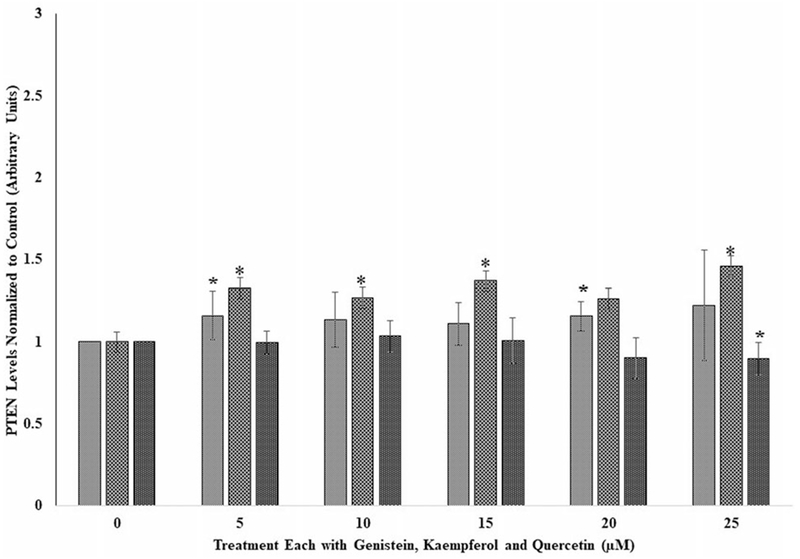
The effects of several doses (0, 5, 10, 15, 20, and 25 μM) each of genistein, kaempferol, and quercetin on phospho tensin homolog (PTEN) in lung cancer cell line, A549, following incubation at 37 °C and 5% CO2 for 24 h. Each bar chart for each flavonoid ± standard deviation in this and Figures 2 and 3 in this article represent mean for three different experiments for each dose level of genistein, kaempferol, and quercetin tested and which was assayed in triplicates. Statistical significances denoted by asterisks in Figures 1 through 3 are shown as comparison between the respective control (i.e., without genistein, kaempferol, and quercetin) and genistein, kaempferol, and quercetin A549 cells treated subgroups. *p < 0.05. Vertical bars in this and other figures denote standard deviation. The X-axis labels for Figures 1 through 3 are defined as follows: 0 means control cell samples not treated with genistein, kaempferol, and quercetin; 5, 10, 15, 20, and 25 μM means cell samples were each treated with the respective dose of genistein, kaempferol, and quercetin for 24 hours.
Figure 3.
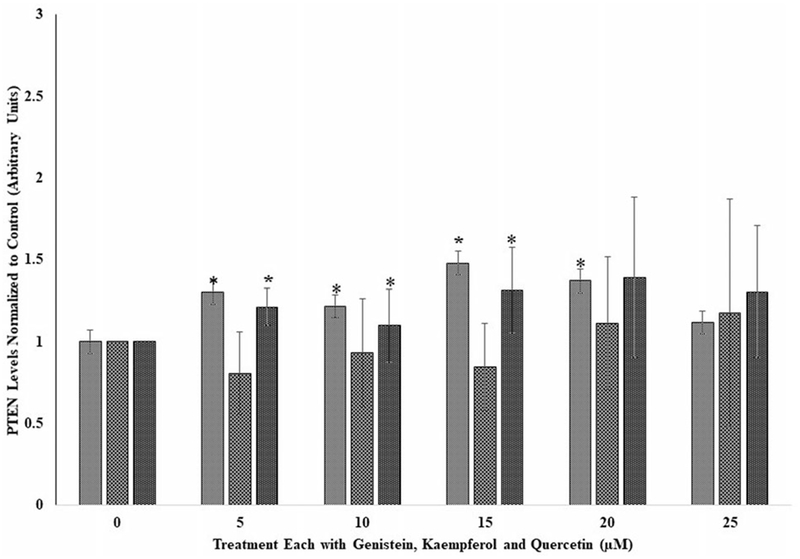
The effects of several doses (0, 5, 10, 15, 20, and 25 μM) each of genistein, kaempferol, and quercetin on phospho tensin homolog (PTEN) in human embryonic cells, HEK293, following incubation at 37 °C and 5% CO2 for 24 hours. For comparison and statistical differences, see Figure 1.
Effects of the flavonoids on lung cancer cells (A549)
As shown in Figure 1 for A549 cells, PTEN levels seem to increase for each of the flavonoids in comparison to their respective controls. Genistein at 5, 15, and 20 μM showed a significant increase (p < 0.05) in PTEN compared to its control. While PTEN levels in the kaempferol-treated samples also increased significantly (p < 0.05) for each dose at 5 to 25 μM compared to its control, that of quercetin did not have an effect on PTEN but showed a significant decrease (p < 0.05) only at the highest dose of 25 μM. Thus, with regard to potency in altering PTEN levels, genistein showed the best effect in increasing PTEN levels (Figure 1).
Effects of the flavonoids on breast cancer cells (BT549)
As observed for the A549 cells (Figure 1) there was general increase in PTEN levels for genistein and quercetin for the tested doses compared to their respective controls. Kaempferol at 5 μM showed a significant decrease (p < 0.05) in PTEN and thereafter remained the same for all the other doses compared to its control. At the 5- and 15-μM dose levels, quercetin and genistein respectively showed significant (p < 0.05) increases in PTEN levels compared to their respective controls. As observed for the lung cancer A549 cell lines (Figure 1), kaempferol did not have any effect on PTEN levels except at the 15-μM dose (Figure 2).
Figure 2.
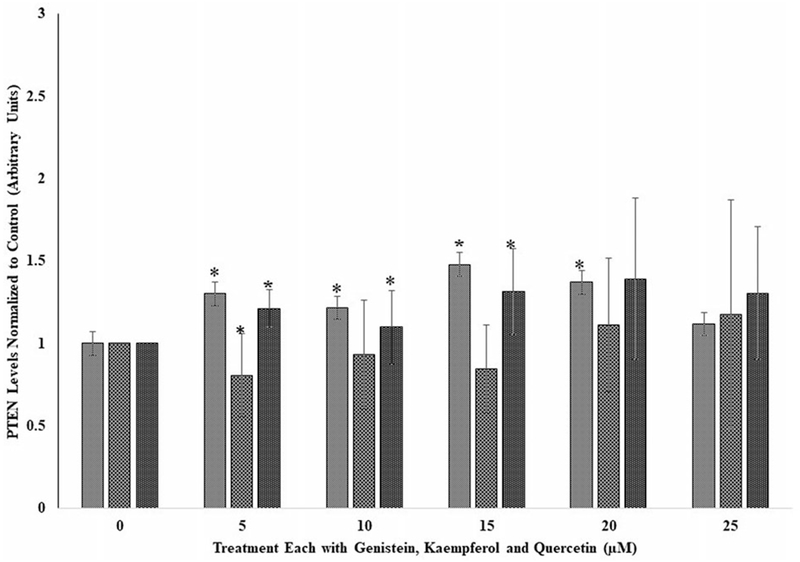
The effects of several doses (0, 5, 10, 15, 20, and 25 μM) each of genistein, kaempferol, and quercetin on phospho tensin homolog (PTEN) in breast cancer cell line, BT549, following incubation at 37 °C and 5% CO2 for 24 hours. For comparison and statistical differences, see Figure 1.
Effects of the flavonoids on human embryonic kidney cells (HEK293)
Figure 3 shows the PTEN levels in HEK293 cells following exposure to the flavonoids at the various doses tested. As observed for the BT459 cell lines (Figure 2), quercetin and genistein at the respective doses of 5 and 15 μM showed significant (p < 0.05) increases in PTEN levels compared to their respective controls. Again, and as observed for the A549 and BT549 cell lines (Figures 1 and 2), kaempferol did not have any effect on PTEN levels at the tested doses (Figure 3). With regard to A549 and BT549 cell (Figures 1 and 2) where genistein and kaempferol had significant increases at the lower doses of 5 to 15 μM, the opposite effect was observed for A549 at the highest doses of 20 and 25 μM.
Effect of the flavonoids on lipid peroxides in PBMCs in donors without and with oxidative stress
Effect of genistein on lipid peroxides in PBMCs without and with oxidative stress
Figures 4 and 5 respectively show the effects of exposure of genistein on lipid peroxides in PBMCs from three independent donors (F1, F2, and F3) without and with oxidative stress. The results in Figure 4 indicate that lipid peroxides among the donors varied differently and depended on the individual donor. Compared to each donor’s respective control, there were no significant differences in lipid peroxides for the doses tested except for donor F2, where a significant (p < 0.05) drop in lipid peroxides were observed at the 25-μM dose. Lipid peroxides in PBMCs exposed to oxidative stress and the flavonoids (Figure 5) compared to those exposed only to the flavonoids (Figure 4) increased significantly (p < 0.05) for all the doses tested as analyzed by two-way ANOVA. Again, lipid peroxides for the oxidative stressed PBMCs were not significantly different for each of the donors compared to their respective controls (Figure 5).
Figure 4.
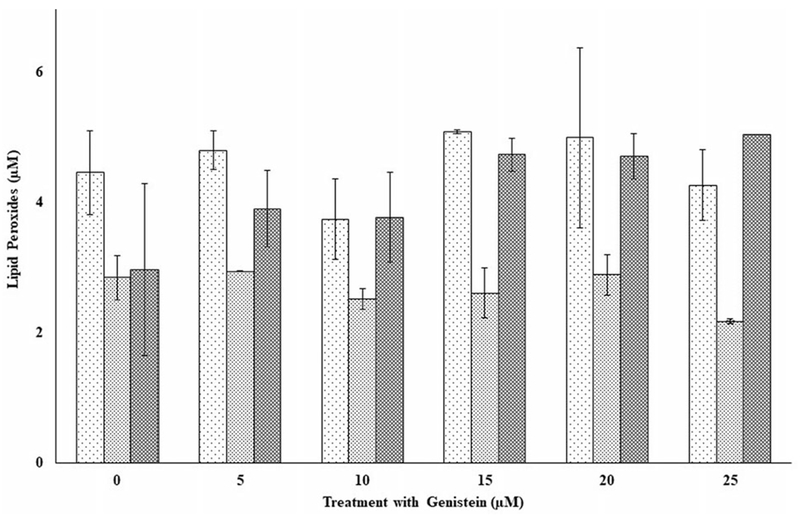
The effects of several doses of genistein (0, 5, 10, 15, 20, and 25 μM) on lipid peroxides in peripheral blood mononuclear cells (PBMCs) from three independent donors (i.e., F1, F2, and F3) without oxidative damage in PBMCs following incubation at 37 °C and 5% CO2 for 24 hours. Statistical significances denoted by asterisk in Figures 4 through 9 are shown as comparison between the respective control (i.e., without genistein, kaempferol, or quercetin) and with genistein, kaempferol, or quercetin PBMCs cells treated subgroups without oxidative damage.. For comparison and statistical differences, see Figure 1.
Figure 5.
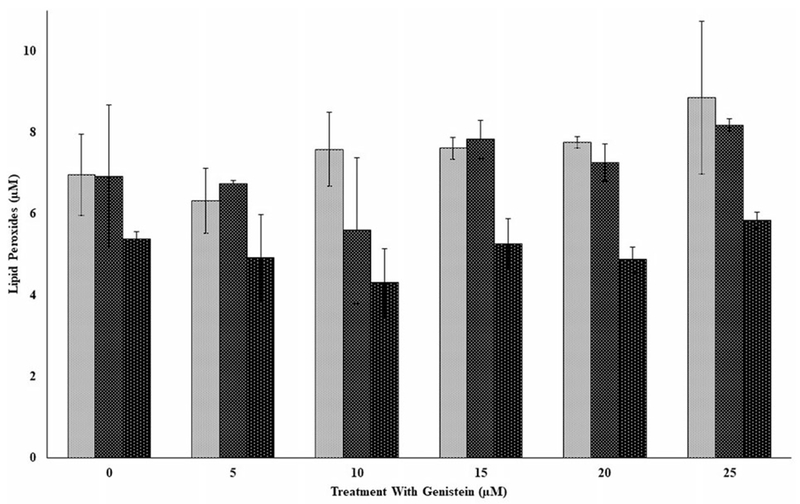
The effects of several doses of genistein (0, 5, 10, 15, 20, and 25 μM) on lipid peroxides in peripheral blood mononuclear cells (PBMCs) from three independent donors (i.e., F1, F2, and F3) with Fe2+ induced oxidative damage in PBMCs following incubation at 37 °C and 5% CO2 for 24 hours. For comparison and statistical differences, see Figure 4.
Effect of kaempferol on lipid peroxides in PBMCs without and with oxidative stress
Figures 6 and 7 show the respective profiles of lipid peroxides in PBMCs for three independent donors (F4, F5, and F6) treated with kaempferol only and with kaempferol in the presence of oxidative stress. Lipid peroxides (Figure 6) increased significantly (p < 0.05) for donor F5 at the 5- and 10-μM doses respectively compared to the control. At the 15-μM dose for the same donor, however, lipid peroxide decreased significantly (p < 0.01) compared respectively to its control and those of the 5- and 10-μM levels. Peroxide levels (Figure 7) were significantly higher (p < 0.05) as previously observed for genistein (see Figures 4 and 5) in comparison to PBMCs from donors exposed only to kaempferol (Figure 6). Increases in lipid peroxides were observed in PBMCs from donor F4 at the 15- and 25- and F6 at the 5-, 20-, and 25-μM respective doses (Figure 7).
Figure 6.
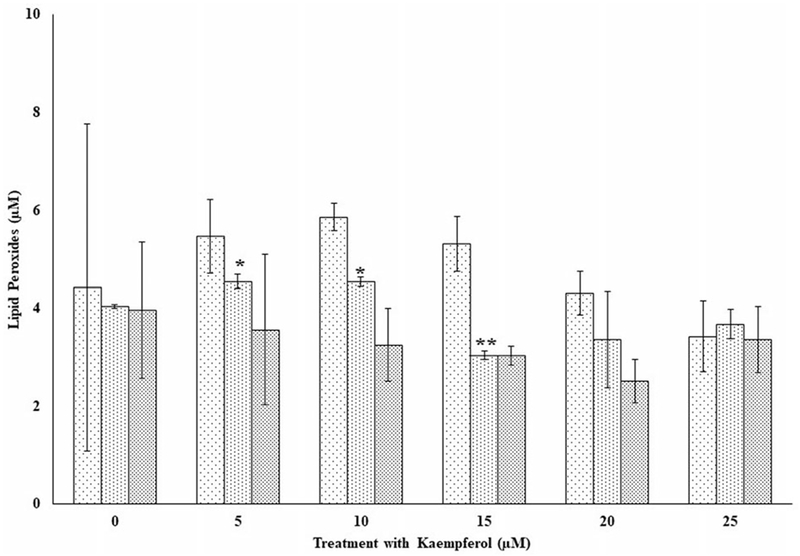
The effects of several doses of kaempferol (0, 5, 10, 15, 20, and 25 μM) on lipid peroxides in peripheral blood mononuclear cells (PBMCs) from three independent donors (i.e., F4, F5, and F6) without oxidative damage in PBMCs following incubation at 37 °C and 5% CO2 for 24 hours. For comparison and statistical differences, see Figure 4.
Figure 7.
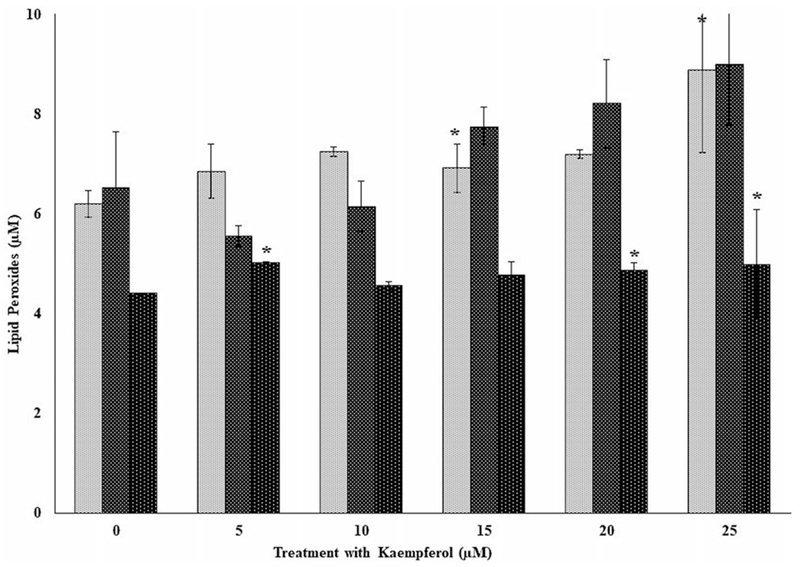
The effects of several doses of kaempferol (0, 5, 10, 15, 20, and 25 μM) on lipid peroxides in peripheral blood mononuclear cells (PBMCs) from three independent donors (i.e., F4, F5, and F6) with Fe2+ induced oxidative damage in PBMCs following incubation at 37 °C and 5% CO2 for 24 hours. For comparison and statistical differences, see Figure 4.
Effect of quercetin on lipid peroxides in PBMCs without and with oxidative stress
The effects of quercetin on lipid peroxides in three independent donors (F7, F8, and F9) following exposure to flavonoids only and in the presence of the flavonoid following oxidative stress are shown in Figures 8 and 9, respectively. Again, as observed for genistein and kaempferol, lipid peroxides were variable from donor to donor. Significant decreases (p < 0.01) in lipid peroxides were observed for donor F7 at each of the doses from 10 to 25 μM compared to its control (Figure 8). However, for donor F8, a significant increase in lipid peroxide compared to its control was observed for the 20 and 25 μM, respectively. A significant decrease (p < 0.05) in lipid peroxide was observed for donor F9 at 10 μM compared to its control (Figure 8). Following exposure to quercetin and in the presence of oxidative damage (Figure 9), lipid peroxides remained the same and not significantly different for donors F7 and F8 for all the doses tested compared to their respective controls. Surprisingly, significant increases (p < 0.05) in lipid peroxides for donor F8 was observed for quercetin tested at each of the 10 to 25 μM levels and in the presence of oxidative stress. Generally, lipid peroxides were lower for the quercetin-only treated samples (Figure 8) compared to those both exposed to quercetin and in the presence of oxidative stress (Figure 9).
Figure 8.
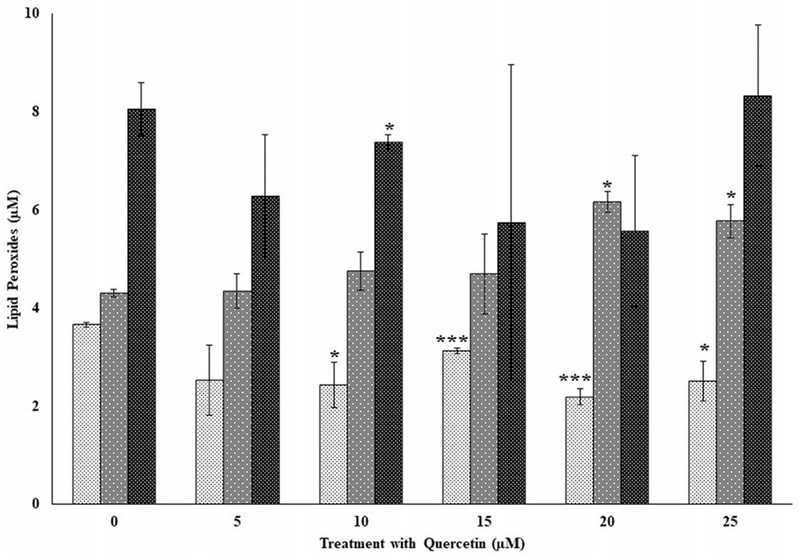
The effects of several doses of quercetin (0, 5, 10, 15, 20, and 25 μM) on lipid peroxides in peripheral blood mononuclear cells (PBMCs) from three independent donors (i.e., F7, F8, and F9) without oxidative damage in PBMCs following incubation at 37 °C and 5% CO2 for 24 hours. For comparison and statistical differences, see Figure 4.
Figure 9.
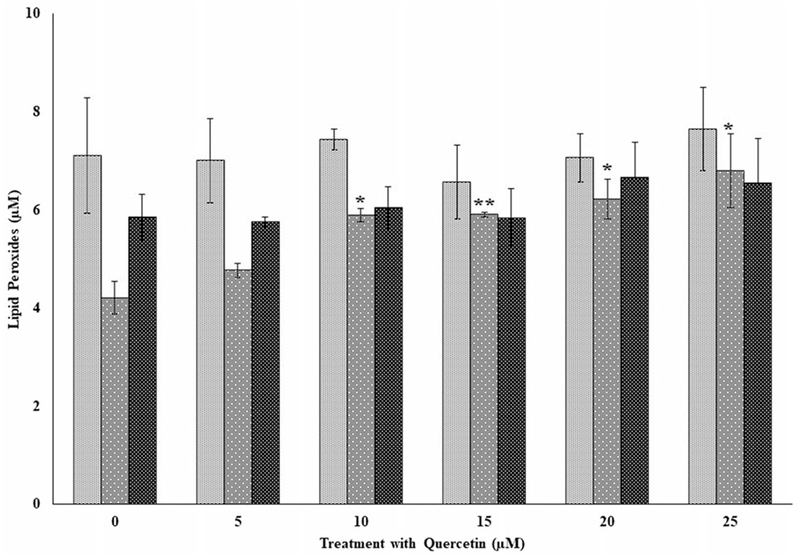
The effects of several doses of quercetin (0, 5, 10, 15, 20, and 25 μM) on lipid peroxides in peripheral blood mononuclear cells (PBMCs) from three independent donors (i.e., F7, F8, and F9) with Fe2+ induced oxidative damage in PBMCs following incubation at 37 °C and 5% CO2 for 24 hours. For comparison and statistical differences, see Figure 4.
Discussion
Flavonoids, a family of polyphenols, are generally found in various fruits and vegetables, as well as in many plant beverages such as tea, pomegranate juice, raspberries, blueberries, and red wine (16). Studies on flavonoids have attracted scientific attention as a potential nutritional strategy to prevent a broad range of chronic disorders. For example, the consumption of these flavonoids in sufficient amounts play neuroprotective, cardioprotective, anti-inflammatory, and chemopreventive roles (16, 17). While there has been a major focus on the antioxidant properties, there is an emerging view that flavonoids and their in vivo metabolites do not act only as conventional antioxidants but may also exert modulatory actions on cellular system through direct action on various signaling pathways (18). These pathways include phosphoinositide 3-kinase, Akt/protein kinase B, mitogen-activated protein kinase, tyrosine kinases, and protein kinase C. The inhibitory or stimulatory actions of flavonoids on these pathways greatly affect cellular functions by altering the phosphorylation state of targeted molecules (18).
In the present study, we further sought to investigate the effects of exposure of genistein, kaempferol, and quercetin on the levels of PTEN in several human cells. In addition, we investigated the effects of the above flavonoids on lipid peroxides in PBMCs before and after exposure to oxidative stress as described by the Fenton’s chemistry (19). The primary hypotheses were (1) that exposure of human cells to genistein, kaempferol, and quercetin can increase PTEN levels in those cells to better cope with oxidative stress and (2) that the flavonoids might help individuals better cope with oxidative damage by reducing the levels of lipid peroxides in PBMCs. The proposed studies represent an effort to define how genistein, kaempferol, and quercetin modulate the levels of PTEN, a tumor suppressor gene, in breast and lung cancer and human embryonic kidney cells as well as the levels of oxidation in PBMC from several donors.
The results in the current studies indicate that genistein, quercetin and, to a lesser extent, kaempferol seem to cause significant increases in the levels of PTEN in all the cancer and the human embryonic kidney cells, suggesting the potency of such compounds in modulating cell growth and probably enhancing cell programmed death. In fact, it has been reported elsewhere that the soy phytoestrogens, genistein, daidzein, and equol, not only controlled cell-cycle arrest and cell growth inhibition but induced apoptosis or programmed cell death in prostate cancer cell apoptosis (20–23). We have previously observed decreases in Akt levels in 3T3-L1 preadipocytes following exposure to genistein and quercetin and the observed effects were attributed to the down-regulation of the Akt transcription factor (14) or low expression of NF-κB (24–26). Thus, the increased PTEN levels attributed by genistein and quercetin may be indirectly be due to decreased Akt levels in those cells as we have previously reported (14). The differences between quercetin and genistein may indicate that quercetin is able to directly curb the PI3K/Akt/IKKα/NF-κB in the cell lines leading to the induction of cell apoptosis through a mitochondria-dependent mechanism. In fact, a similar observation was seen in human salivary adenoid cystic carcinoma as previously observed by Sun et al. (27) and as we have recently reported (14). Furthermore, many other reports indicate that flavonoids, including quercetin, are inhibitors of different PI3K isoforms and PI3K/Akt axis (28–30), making PI3K a possible molecular target for quercetin. The fact is that quercetin is able to inhibit many other kinases and enzymes besides PI3K and NF-κB-1, which makes it plausible to assume that the effectiveness also of quercetin in comparison to genistein and kaempferol may be due to the multiple facets of quercetin targeting several isoforms of the P13K isoforms. Third, the flavonol may act positively on the kinase/suppressor factors, thus inducing indirect kinase inhibition. Furthermore, quercetin is a strong DNA binder, as reported by Janjua et al. (31), and may be beneficial to both individuals who are either genetically or not predisposed to cancer as a result of the increases in the levels of PTEN. We have also shown, for the first time and among all the tested flavonoids, that the effect of the various doses of kaempferol on the human cells on the PTEN levels may be cell line-specific and could be due to the disruption of Tumor necrosis factor (TNF)-mediated operations, as has been reported elsewhere (32) or the ability of kaempferol to dramatically lower the production of reactive oxygen species in HEK293 cells (32) and, ostensibly, significantly handicapping the TNF assembly in addition to its broad spectrum of inflammatory effects. Our findings are in agreement in similar studies where HEK 293 cells, when exposed to kaempferol, blocked not only TNF-induced Interleukin-8 (IL-8) promoter activation but also IL-8 gene expression, which has been found to be a potent enhancer of angiogenesis as well, once again displaying the wide variety of proteins kaempferol affects (33). In summary, increased PTEN levels following flavonoid exposure may indicate low oxidative damage, as we have previously demonstrated in 3T3-L1 preadipocytes and the cells investigated in the current studies.
To demonstrate the effectiveness of the flavonoids on lipid peroxides before and during the oxidative stress processes we have used PBMCs to characterize this phenomena. These cells were selected because they seem to reflect hepatic regulation of cholesterol metabolism (10) and can migrate through the blood circulation and infiltrate various tissues such as the endothelium and adipose tissue (11). In addition, PBMC gene expression might reflect the metabolic and immune responses of adipocytes or hepatocytes (11) as well as their responses to dietary modifications and drugs at the level of gene expression (12, 13). Furthermore, the cells are convenient to use because they can be easily and repeatedly collected in sufficient quantities, in contrast to adipose, muscle, and liver tissues. We have consistently observed decreases in lipid peroxides in PBMCs from donors exposed only to the flavonoids and incubated for 24 hours. Such observations seem to suggest that increasing the antioxidant potential of donor cells helps not only to reduce oxidation processes in those individuals but may also help those cells better cope during inflammatory and/or oxidative stress. Such findings seem to be in agreement with studies by other authors where consumption of virgin olive oil (VOO) rich in phenolic compounds and high in monounsaturated fatty acids seem to have healthy benefits in humans with disease risk factors (34). Similarly, and in other studies, the authors explored the mechanisms of the beneficial effects of VOO, a major component of a Mediterranean diet, on gene expression at the mRNA levels in PBMCs (35). In that study, the addition of 25 ml per day of VOO up-regulated not only genes involved in the DNA repairing system, antiapoptotic genes, but those genes involved in antioxidant and oxidative cell defense mechanisms (34). Thus, it is very plausible to suggest that a diet loaded with high antioxidant potential such as the flavonoids could help reverse some potential damage(s) to cell function and viability. As to why lipid peroxides increased in PBMCs exposed to the flavonoids and then subjected to oxidative damage is very interesting. This is the very first observation of such a phenomenon and could either mean that the levels of the flavonoids exposed to the PBMCs may not be sufficiently adequate or there is a critical concentration needed by each donor to help those individuals better cope with oxidative stress and cell damage. This phenomenon is contrary to our previous studies, where we observed reduced lipid peroxides by flavonoids (36), suggesting the need to further investigate the critical doses of the flavonoids that are needed by the donors to offset any possible damage. Nevertheless, it is of interest to note that the elucidation of the mechanisms of the flavonoid antioxidant capacity on health and how much these benefits are related to reduce oxidative stress may depend on the donor. We also wish to state that the use of PBMCs in the current study is not an intervention study in which dietary manipulation was done by means of supplementation with the flavonoids since we did not have all the relevant information on the donors with regard to background in terms of dietary intake. The authors are suggesting that the above studies might be considered as a proof of concept to demonstrate the beneficial effects of these flavonoids and their impacts on the inflammatory process.
The variability in the lipid peroxide data also seems to suggest that individual differences both genetically and environmentally may dictate the critical levels of antioxidants for each individual, family, or population (19) and/or may be due to our inability to access full biographical data (due to confidentiality and compliance issues by the American Red Cross) regarding their age, sex, lifestyle, and diet. The availability of such information could have helped to normalize the data to their respective age, sex, and life-style for proper interpretation of the data on the potency of the flavonoids. Nevertheless, and taken together, our findings provide important insights into the mechanisms underlying the anti-obesity activity of the flavonoids and may be mediated by the inhibition of Akt activation by the decreased phosphorylation, which may induce the down-regulation of lipid accumulation and lipid metabolizing genes as observed previously (14) and the concomitant increases in PTEN as we have observed in the current study.
Conclusions
Our findings seem to suggest that the flavonoids are capable of enhancing the antioxidant levels by increasing PTEN levels in several human cells to better cope with oxidative damage. Second, individual differences in donor profiles may or may not truly reflect the potential benefits of such compounds in one’s diet. However, the findings from the current studies seem to suggest that consumption of foods containing polyphenols may help reduce the causes of factors related to the metabolic syndrome (37–39) and those associated with the anti-inflammatory mechanisms and improved antioxidant capacity (40, 41). Finally, the increased activity of PTEN as we have observed in the current study could help explain the concomitant low expression levels for both the phospho- and total-Akt gene (14), further substantiating the inverse relationship between the expression levels of Akt and PTEN gene as we and others have observed (14).
Acknowledgments
The authors want to thank Dr. Margaret Whalen and her students, Ms. Wendy Wilburn and Ms. Tamara Martin, for their help in preparing and providing the purified PBMCs. This study did not involve the use of human subjects or experimental animals.
Funding
Research Trainees Coordinating Centre.
This study was supported with grant from the Evans-Allen grant to Tennessee State University from the National Institute of Food and Agriculture (NIFA), of the United States Food and Drug Administration (USFDA). The financial support of the Maximizing Access to Research Careers Undergraduate Student Training in Academic Research (NIH) grant number 5T34GM007663, is greatly appreciated.
Footnotes
Declaration of interest
The authors report no conflict of interest. The authors alone are responsible for the content and writing of the article.
References
- 1.Li J, Yen C, Liaw D, Podsypanina K, Bose S, Wang SI. PTEN, a putative protein tyrosine phosphatase gene mutated in human brain, breast, and prostate cancer. Science 1997;275(5308): 1943–7. doi: 10.1126/science.275.5308.1943. [DOI] [PubMed] [Google Scholar]
- 2.Liaw D, Marsh DJ, Li J, Dahia PLM, Wang SI, Zheng Z, Bose S, Call KM, Tsou HC, Peacoke M. Germline mutations of the PTEN gene in Cowden disease, an inherited breast and thyroid cancer syndrome. Nat Genet. 1997;16(1):64–7. doi: 10.1038/ng0597-64. [DOI] [PubMed] [Google Scholar]
- 3.Li DM, Sun H. TEP1, encoded by a candidate tumor suppressor locus, is a novel protein tyrosine phosphatase regulated by transforming growth factor beta. Cancer Res. 1997;57:2124–49. [PubMed] [Google Scholar]
- 4.Downes CP, Ross S, Maccario H, Perera N, Davidson L, Leslie NR. Stimulation of PI 3-kinase signaling via inhibition of the tumor suppressor phosphatase, PTEN. Adv Enzyme Regul. 2007; 47(1):184–94. doi: 10.1016/j.advenzreg.2006.12.018. [DOI] [PubMed] [Google Scholar]
- 5.Stiles B, Groszer M, Wang S, Jiao J, Wu H. PTENless means more. Dev Biol. 2004;273(2):175–84. doi: 10.1016/j.ydbio.2004.06.008. [DOI] [PubMed] [Google Scholar]
- 6.Elghazi L, Bernal-Mizrachi E. Akt and PTEN: beta-cell mass and pancreas plasticity. Trends Endocrinol Metab. 2009;20(5):243–51. doi: 10.1016/j.tem.2009.03.002. [DOI] [PMC free article] [PubMed] [Google Scholar]
- 7.Manning BD, Cantley LC. AKT/PKB signaling: navigating down-stream. Cell. 2007;129(7):1261–74. doi: 10.1016/j.cell.2007.06.009. [DOI] [PMC free article] [PubMed] [Google Scholar]
- 8.de Mello VDF, Kolehmanien M, Schwab U, Pulkkinen L, Uusitupa M. Gene expression of peripheral blood mononuclear cells as a tool in dietary intervention studies: What do we know so far? Mol Nutr Food Res. 2012;56(7):1160–72. doi: 10.1002/mnfr.201100685. [DOI] [PubMed] [Google Scholar]
- 9.Parihar P. Microbiology and immunology. New Delhi (India): Global Media; 2009. [Google Scholar]
- 10.Powell EE, Kroon PA. Low density lipoprotein receptor and 3-hydroxy-3-methylglutaryl coenzyme A reductase gene expression in human mononuclear leukocytes is regulated coordinately and parallels gene expression in human liver. J Clin Invest. 1994; 93(5):2168–74. doi: 10.1172/JCI117213. [DOI] [PMC free article] [PubMed] [Google Scholar]
- 11.Ziegler-Heitbrock HW. Definition of human blood monocytes. J Leukoc Biol. 2000;67(5):603–06. [DOI] [PubMed] [Google Scholar]
- 12.Fuchs D, Piller R, Linseisen J, Daniel H, Wenzel U. The human peripheral blood mononuclear cell proteome responds to a dietary flaxseed-intervention and proteins identified suggest a protective effect in atherosclerosis. Proteomics. 2007;7(18):3278–88. doi: 10.1002/pmic.200700096. [DOI] [PubMed] [Google Scholar]
- 13.Di Paolo S, Schena A, Stallone G, Grandaliano G, Soccio M, Cerullo G, Gesualdo L, Paolo Schena F. Captopril enhances transforming growth factor (TGF)-beta1 expression in peripheral blood mononuclear cells: a mechanism independent from angiotensin converting enzyme inhibition? A study in cyclosporine-treated kidney-transplanted patients. Transplantation. 2002; 74(12):1710–8. doi: 10.1097/01.TP.0000038701.57053.21. [DOI] [PubMed] [Google Scholar]
- 14.Boadi WY, Lo A. Effects of quercetin, kaempferol, and exogenous glutathione on phospho- and total-AKT in 3T3-L1 preadipocytes. J Diet Suppl. 2018;15(6):814–26. doi: 10.1080/19390211.2017.1401572. [DOI] [PubMed] [Google Scholar]
- 15.Brown S, Tehrani S, Whalen MM. Dibutyltin-induced alterations of interleukin 1beta secretion from human immune cells. J Appl Toxicol. 2017;37(2):181–91. doi: 10.1002/jat.3339. [DOI] [PMC free article] [PubMed] [Google Scholar]
- 16.Di Carlo G, Mascolo N, Izzo AA, Capasso F. Flavonoids: old and new aspects of a class of natural therapeutic drugs. Life Sci. 1999;65(4):337–53. [DOI] [PubMed] [Google Scholar]
- 17.Aherne SA, O’Brien NM. Mechanism of protection by the flavo-noids, quercetin and rutin, against tert-butylhydroperoxide- and menadione-induced DNA single strand breaks in Caco-2 cells. Free Radic Biol Med. 2000;29(6):507–14. doi: 10.1016/S-5849(00)00360-9. [DOI] [PubMed] [Google Scholar]
- 18.Lee E-J, Shin S-Y, Lee J-Y, Lee S-J, Kim J-K, Yoon D-Y, Woo E-R, Kim Y-M. Cytotoxic activities of amentoflavone against human breast and cervical cancers are mediated by increasing of PTEN expression levels and due to peroxosome proliferator-activated receptor Y activation. Bull Korean Chem Soc. 2012;33(7): 2219–23. doi: 10.5012/bkcs.2012.33.7.2219. [DOI] [Google Scholar]
- 19.Boadi WY, Harris S, Anderson JB, Adunyah SE. Lipid peroxides and glutathione status in human progenitor mononuclear (U937) cells following exposure to low doses of nickel and copper. Drug Chem Toxicol. 2013;36(2):155–63. doi: 10.3109/01480545.2012.660947. [DOI] [PMC free article] [PubMed] [Google Scholar]
- 20.Di Cristofano A, Pandolfi PP. The multiple roles of PTEN in tumor suppression. Cell. 2000;100(4):387–90. [DOI] [PubMed] [Google Scholar]
- 21.Wu X, Obata T, Khan Q, Highshaw RA, de Vere White R, Sweeney C. The phosphatidylinositol-3 kinase pathway regulates bladder cancer cell invasion. BJU Int. 2004;93(1):143–50. doi: 10.1111/j.1464-410X.2004.04574.x. [DOI] [PubMed] [Google Scholar]
- 22.Tanaka M, Koul D, Davies MA, Liebert M, Steck PA, Grossman HB. MMAC1/PTEN inhibits cell growth and induces chemosensitivity to doxorubicin in human bladder cancer cells. Oncogene. 2000;19(47):5406–12. doi: 10.1038/sj.onc.1203918. [DOI] [PubMed] [Google Scholar]
- 23.Garcia R, Gonzalez CA, Agudo A, Riboli E. High intake of specific carotenoids and flavonoids does not reduce the risk of bladder cancer. Nutr Cancer. 1999;35(2):212–4. doi: 10.1207/S15327914NC352_18. [DOI] [PubMed] [Google Scholar]
- 24.Lin A, Karin M. NF-kappa B. in cancer: a marked target. Semin Cancer Biol. 2003;13(2):107–14. [DOI] [PubMed] [Google Scholar]
- 25.Jain G, Voogdt C, Tobias A, Spindler K-D, Möller P, Cronauer MV, Marienfeld RB. IkB kinases modulate the activity of the androgen receptor in prostate carcinoma cell lines. Neoplasia. 2012a;14(3):178–89. [DOI] [PMC free article] [PubMed] [Google Scholar]
- 26.Jain G, Cronauer MV, Schrader M, Möller P, Marienfeld RB. NF-κB signaling in prostate cancer: a promising therapeutic target? World J Urol. 2012b;30(3):303–10. doi: 10.1007/s00345-011-y. [DOI] [PubMed] [Google Scholar]
- 27.Sun Z-J, Chen G, Hu X, Zhang W, Liu Y, Zhu L-X, Zhou Q, Zhao Y-F. Activation of PI3K/Akt/IKK-alpha/NF-kappaB signaling pathway is required for the apoptosis-evasion in human salivary adenoid cystic carcinoma: its inhibition by quercetin. Apoptosis. 2010;15(7):850–63. doi: 10.1007/s10495-010-0497-5. [DOI] [PubMed] [Google Scholar]
- 28.Kong D, Zhang Y, Yamori T, Duan H, Jin M. Inhibitory activity of flavonoids against class I phosphatidylinositol 3-kinase isoforms. Molecules. 2011;16(6):5159–67. doi: 10.3390/molecules16065159. [DOI] [PMC free article] [PubMed] [Google Scholar]
- 29.Hou DX, Kumamoto T. Flavonoids as protein kinase inhibitors for cancer chemoprevention: direct binding and molecular modeling. Antioxid Redox Signal. 2010;13(5):691–719. doi: 10.1089/ars.2009.2816. [DOI] [PubMed] [Google Scholar]
- 30.Hwang MK, Song NR, Kang NJ, Lee KW, Lee HJ. Activation of phosphatidylinositol 3-kinase is required for tumor necrosis factor-alpha-induced upregulation of matrix metalloprotein- ase-9: its direct inhibition by quercetin. Int J Biochem Cell Biol. 2009; 41(7):1592–1600. doi: 10.1016/j.biocel.2009.01.014. [DOI] [PubMed] [Google Scholar]
- 31.Janjua NK, Siddiqa A, Yaqub A, Sabahat S, Qureshi R, Ul Haque S. Spectrophotometric analysis of flavonoid-DNA binding interactions at physiological conditions. Spect. Acta. Part A. 2009;74: 1135–7. doi: 10.1016/j.saa.2009.09.022. [DOI] [PubMed] [Google Scholar]
- 32.Lee S, Kim Y-J, Kwon S, Lee Y, Choi SY, Park J, Kwon H-J. Inhibitory effects of flavonoids on TNF-α-induced IL-8 gene expression in HEK 293 cells. BMB Rep. 2009;42(5):265–70. [DOI] [PubMed] [Google Scholar]
- 33.Qazi BS, Tang K, Qazi A. Recent advances in underlying pathologies provide insight into interleukin-8 expression-mediated inflammation and angiogenesis. Int. J Inflam 2011;2011:1–13. doi: 10.4061/2011/908468. [DOI] [PMC free article] [PubMed] [Google Scholar]
- 34.Covas M-I, Nyyssönen K, Poulsen HE, Kaikkonen J, Zunft H-JF, Kiesewetter H, Gaddi A, de la Torre R, Mursu J, Bäumler H, et al. The effect of polyphenols in olive oil on heart disease risk factors: a randomized trial. Ann Intern Med. 2006;145(5): 333–41. [DOI] [PubMed] [Google Scholar]
- 35.Konstantinidou V, Covas M-I, Muñoz-Aguayo D, Khymenets O, de la Torre R, Saez G, Tormos MDC, Toledo E, Marti A, Ruiz-Gutiérrez V, et al. In vivo nutrigenomic effects of virgin olive oil polyphenols within the frame of the Mediterranean diet: a randomized controlled trial. FASEB J. 2010;24(7):2546–57. doi: 10.1096/fj.09-148452. [DOI] [PubMed] [Google Scholar]
- 36.Boadi WY, Iyere PA, Adunyah SE. Effect of quercetin and genistein on copper- and iron-induced lipid peroxidation in methyl linolenate. J Appl Toxicol. 2003;23(5):363–9. doi: 10.1002/jat.933. [DOI] [PubMed] [Google Scholar]
- 37.Heidemann C, Scheidt-Nave C, Richter A, Mensink GB. Dietary patterns are associated with cardio metabolic risk factors in a representative study population of German adults. Br J Nutr. 2011;106(8):1253–62. doi: 10.1017/S0007114511001504. [DOI] [PubMed] [Google Scholar]
- 38.Kouki R, Schwab U, Hassinen M, Komulainen P, Heikkilä H, Lakka TA, Rauramaa R. Food consumption, nutrient intake and the risk of having metabolic syndrome: the DR’s EXTRA study. Eur J Clin Nutr. 2011;65(3):368–77. doi: 10.1038/ejcn.2010.262. [DOI] [PubMed] [Google Scholar]
- 39.Esmaillzadeh A, Kimiagar M, Mehrabi Y, Azadbakht L, Hu FB, Willett WC. Fruit and vegetable intakes, C-reactive protein, and the metabolic syndrome. Am J Clin Nutr. 2006;84(6):1489–97. doi: 10.1093/ajcn/84.6.1489. [DOI] [PubMed] [Google Scholar]
- 40.Abete I, Goyenechea E, Zulet MA, Martinez JA. Obesity and metabolic syndrome: potential benefit from specific nutritional components. Nutr Metab Cardiovasc Dis. 2011;21:B1–15. doi: 10.1016/j.numecd.2011.05.001. [DOI] [PubMed] [Google Scholar]
- 41.Hermsdorff HH, Zulet MA, Puchau B, Martinez JA. Fruit and vegetable consumption and pro inflammatory gene expression from peripheral blood mononuclear cells in young adults: a translational study. Nutr Metab (Lond). 2010;7(1):42. doi: 10.1186/1743-7-42. [DOI] [PMC free article] [PubMed] [Google Scholar]


