Abstract
Bax is a pro-apoptosis protein that translocates from the cytosol to the mitochondria membrane upon initiation of programed cell death. Bax subsequently disrupts the mitochondria membrane, resulting in the release of cytochrome C which activates the downstream caspases. The structure of inactive Bax has been solved, but despite intensive investigation, the mechanism by which it regulates apoptosis is not established. The low yield of Bax expression in E. coli hampers efforts to elucidate the mechanism. Thus, we undertook a systematic study aimed at improving the yield of Bax. Bacteria were grown in a computer-controlled fermenter and expression was induced by addition of Isopropyl ß-D-1-thiogalactopyranoside (IPTG). The Bax expression level decreased continuously when the dissolved oxygen level was kept at 30%, which is non-limiting for E. coli. Alternatively, when oxygen input was decreased with constant agitation and air flow (or kLa), Bax yield increased by a factor of three. To make sure the short chain fatty acids generated during micro-aerobic fermentation had no adverse effect, their concentrations were closely monitored with HPLC and their effect on cell growth and Bax expression were investigated additionally using shake flasks. Through proteomic analysis using Tandem Mass Tag (TMT) labeling, we identified degradation pathway within E. coli cells as a potential player behind the lower expression level.
Keywords: Dissolved oxygen in fermentation, kLa in fermenter, Recombinant protein expression, Proteomic analysis
1. Introduction
Apoptosis, or programmed cell death, is very important to tissue development and health maintenance. Its malfunction has been linked to multiple disorders such as cancer, autoimmune and degenerative diseases. Apoptosis through the mitochondrial pathway is controlled by two major groups of proteins: anti-apoptotic proteins such as Bcl-2 and Bcl-xL, and pro-apoptotic proteins such as Bax and Bak [1,2]. Bax is expressed as a cytosolic protein, and it undergoes conformational changes upon receiving stimuli such as cellular stress, DNA damage or development cues [2]. These changes allow insertion of Bax into the mitochondria membrane, where it alters the mitochondria membrane potential and permeabilizes it, allowing the release of cytochrome C [3,4]. This in turn triggers the downstream caspases which complete the cell death signaling cascade. Though the structure of inactive, cytosolic Bax was solved about two decades ago [1], the structures of its active and oligomeric forms remain controversial. In order to develop effective therapeutic strategies, the particular stepwise conformational change of Bax during activation and oligomerization needs to be understood so that each step could be targeted specifically. Therefore, Bax has been expressed as recombinant protein in E. coli and purified subsequently for invitro mechanistic study [1,3,4].
Recombinant proteins expressed in E. coli have been produced in abundant quantity through large scale fermentations, which amounts to a multi-billion dollar market with products such as Insulin from Eli Lilly, Interferon β−1b from Novartis, and Lucentis (Fab) from Genentech [5]. In the meantime, fermentation has been instrumental in aiding basic research and discovery by making recombinant proteins readily available to a wide range of topics at hand, from amyloids study of Apo C3 protein (a hard-to-express protein), to expression of intrinsically disordered region of the transcription factor NFAT5 (a hard-to-purify protein), to identification of ATP-repressible domain in Sirt1 protein [6–8]. Not only is the quantity of protein produced much higher by fermentation due to its large volume, the reproducibility is also superior because process parameters such as pH and dissolved oxygen are tightly controlled. High cell density is easily achieved in a fermenter by either manual or automated feeding of nutrients (fed-batch), which in turn increases volumetric productivity at least 10-fold compared to growth in shake flasks [9]. Oxygen transfer is the most important factor for recombinant protein expression by E. coli fermentation, and the initial oxygen transfer coefficient (kLa) is often kept the same when scaling up from small size reactors to large volume reactors [10,11]. For a given fermenter, its kLa, the indication of its oxygen transfer power, is proportional to 1.2 power of its agitation and 0.4 power of its air flow [10]. For instance, the kLa of a fermenter is constant if the agitation speed and air flow rate are kept the same. In this study, fermentation is used as a tool to produce large quantities of Bax, because the expression level of Bax in shake flask is only 0.1–0.2 mg/L [1,3,4], which is too low to allow extensive structural and functional analysis. With a simple fed-batch method, 2 mg/L Bax was generated. Through serial detailed experiments, it was also discovered that Bax specific expression level tripled under oxygen limiting conditions with a constant kLa. Combining these two factors, Bax was consistently produced at 6 mg/L in our laboratory.
Even decades ago, proteomic analysis using 2D gels were used to profile high cell density fermentation samples before and after induction, and the identified upregulated protein was cloned into the original host to improve recombinant Fab expression [12]. Nowadays, with advanced computational power and extensive protein labeling, absolute quantitative proteome analysis has been applied to many studies regarding E. coli growth such as the bacterium’s adaptations to grow in D2O and post translational modifications under ethanol stress [13,14]. Here we applied Tandem Mass Tag (TMT) labeling [18] to our fermentation samples from oxygen sufficient and oxygen limiting conditions, and the degradation pathway was identified as a potential key player for higher Bax expression level under oxygen limiting conditions.
2. Materials and methods
2.1. Plasmids, DNA constructs and host
Human Bax (hBax) cDNA was subcloned into pTYB1 vector from NEB [1], which generated a full length hBax tagged with chitin binding domain at the C terminus. The plasmid was transformed into E. coli BL21 (DE3) and colonies were selected using ampicillin plates. Cell stocks were made from the colonies and stored at − 80 °C.
2.2. Bacterial expression and fermentation
1 ml glycerol stock was used to inoculate 500 ml of medium in a 2.8 L baffled shake flask and this was grown in an incubator at 37 °C and 220 rpm. After overnight growth, four of these flasks were combined and used to inoculated 8 L medium in the fermenter. A 14 BioFlo 115 fermenter (Eppendorf, Hauppauge, NY) with a working volume of 10 L was used for all fermentation runs. The fermenter was sterile filtered with a defined medium of 10 g/L K2HPO4, 10 g/L KH2PO4, 9 g/L Na2HPO4, 2 g/L NH4Cl, 2.4 g/L K2SO4, 3 g/L glucose, 100 mg/L Ampicillin, 5 mM MgCl2, 5 ml/L trace metal solution. Temperature was controlled at 37 °C and pH at 6.8 with addition of ammonium hydroxide. Air flow was controlled at 5 L per minute throughout the whole fermentation. Before inoculation, the medium was saturated with air at 37 °C and the reading of dissolved oxygen (DO) by a InPro 6000 optical O2 probe (Mettler Toledo, MA) was set to 100%, which equals to 6.7 mg/L oxygen concentration. During growth period, DO was controlled at 30% by increasing agitation continuously. After induction with addition of 0.4 mM IPTG, one set of fermentations was kept at a constant DO of 30% by increased agitation, and the other set of fermentations were kept at a constant agitation of 500 rpm. 3 g/L of glucose was added every hour to keep the glucose concentration between 1 and 3 g/L. BioCommand Batch Control software from NBS was used for online data collection. Samples were taken at different elapsed fermentation times (EFT). Cells were centrifuged and pellets were stored at −80 °C for Western blot analysis and protein purification.
2.3. Bax concentration determination
2 mg cell pellets were re-suspended with 200 μl lysis buffer (50 mM HEPEs) and were sonicated for 12 s at 75% power (Sonics VCX-130 Vibra-Cell Ultrasonic Liquid Processor). Both the supernatant and pellet of the cell lysate were loaded onto Bis-Tris gels with 2X SDS sample buffer and electrophoresis was run at 200 V for 35 min. SDS gels were then transferred to nitrocellulose membranes using the iBlot device from Invitrogen. Membranes were incubated with Odyssey Blocking Buffer (PBS) for an hour before being blotted with 2D2-AF680 antibody (SCBT, sc-20067 AF680) at room temperature for 2 h. Membranes were then washed with 1× PBS buffer with 0.1% tween-20 three times, and then was scanned at 700 nm channel using Odyssey infrared scanner (Li-Cor) where the intensity of each band was determined using the Odyssey software. The concentration of Bax for each sample was determined by comparing the band intensity of the sample to a sample with known Bax concentration.
2.4. Bax purification
E. coli cells were resuspended and homogenized in TEN buffer (0.1 M Tris-Cl pH 8.0, 10 mM EDTA, and 1.0 mM NaCl) with Benzonase® nuclease (Merck KGaA, Darmstadt, Germany) and cOmplete™ protease inhibitor cocktail (Roche, Basel, Switzerland). Insoluble material was pelleted by ultracentrifugation for 40 min at 12,500 rcf and 4 °C. A 20 mL chitin column was prepared by washing the resin (New England Biolabs, Ipswich, MA, USA) with 10 column volumes (CV) of water and then equilibrating with 15 CV of TEN buffer. The supernatant was passed over the column, immobilizing Bax. Self-cleavage of the intein inserted between Bax and its chitin binding protein (CBP) fusion partner was induced by percolating a solution of TEN buffer with 50 mM DTT into the resin and allowing the resin to incubate in this solution for about 40 h at 4 °C. After cleavage, the DTT-containing eluate was collected and buffer exchanged into 20 mM Tris, pH 8.0 using a PD-10 column (GE Healthcare, Chicago, IL, USA). The protein was further purified by ion-exchange chromatography using a 5 mL HiTrap® 5 Q HP column (GE Healthcare) with a linear salt gradient up to 800 mM NaCl over 20 CV. The Bax-containing fractions were pooled further and purified by size exclusion chromatography (Sephadex G-75, GE Healthcare) using a buffer of 20 mM sodium acetate pH 6.3, 150 mM NaCl, 1 mM DTT, and 0.1 mM EDTA. Bax-containing fractions were pooled, concentrated, and buffer exchanged into storage buffer (20 mM sodium acetate, pH 6.3 and 0.1% sodium azide). Purified protein was stored at −20 °C.
2.5. HPLC analysis of short fatty acids
Fermentation samples were centrifuged and the supernatant was stored at − 80 °C for HPLC analysis. Short chain fatty acids were analyzed by a modified HPLC-UV method [15]. The Agilent 1100 HPLC system (Agilent technologies) was equipped with a reverse phase column, Phenomenex Luna 3μ C18 (2) (150 × 4.6 mm, 3 μm, Phenomenex). The column temperature was 30 °C and mobile phases were consisted of 20 mM NaH2PO4 pH2.10 in HPLC grade water (A) and acetonitrile (B). The gradient for the chromatographic separation was 0 min, 1% B; 3.5 min, 1% B; 4.5 min, 20% B; 10.5 min, 20% B; 11.0min, 1% B, 21.0 min, 1% B. The flow rate was 0.7 ml/min and absorbance detection was performed at 210 nm. The HPLC-reverse phase column was calibrated with various concentration of formic acid, lactic acid, acetic acid, propionic acid, and butyric acid (Sigma-Aldrich). All data were analyzed using an Agilent software, Chem Station Rev B. 04.03.
2.6. Plasmid stability and effect of short chain fatty acids on Bax expression
Overnight cultures were used to inoculate fresh medium at 1:10 ratio in a shake flask with known kLa, which ensures unlimited oxygen during the growth and induction period [16,17]. After growth at 37 °C for 2 h, cells were induced with 0.8 mM IPTG. For plasmid stability studies, ampicillin at 100 mg/L was added at the time of induction and again at 2 h and 4 h after induction. To observe the effects of short chain fatty acids, 20 mM sodium acetate and 2 mM sodium lactate was added at the time of induction. Samples were taken post induction and centrifuged, and pellets were stored at −80 °C for Bax concentration analysis using western blots.
2.7. Proteomic study using TMT (Tandem Mass Tag) labeling
2 mg E. coli cell pellets were lysed in 8 M urea using pulsed sonication. The supernatant was extracted, and then sequentially reduced, alkylated, and digested overnight with trypsin. The protein digests were labelled with 10-plex Tandem Mass Tag (TMT) reagents (Thermo Fisher Scientific, San Jose, CA) [18]. Labelled protein digests were then pooled, and desalted. High-pH reverse phase liquid chromatography (bRPLC) [19] was carried out to separate the peptide mixture into 24 fractions. Each fraction was analyzed on an Orbitrap Lumos (Thermo Fisher Scientific) based nanoLCMS system.
Peptide and protein IDs were assigned by searching the resulting LCMS raw data against the Uniprot E. coli database supplemented with the Bax-Intein-CBD sequence using the Sequest HT algorithm. Quantitation values were extracted using the Proteome Discoverer 2.2 platform (Thermo Fisher Scientific). 10 channels’ sample amounts were normalized using the total report ion intensities of their corresponding channels. Individual proteins were quantified based on the normalized report ion intensities of their unique peptides.
We used 2-fold cutoff and t-test p values less than 0.05 to select for changed proteins.
2.8. Bax in vivo turnover assay
Induced culture was diluted to 3.3 OD with fresh medium and was transferred into shake flasks with known kLa [16,17] which ensures either sufficient or limited oxygen during the assay. Protein synthesis was then terminated by adding chloramphenicol to 100 mg/L, and flasks were put back to 37 °C shakers at 300 rpm for oxygen sufficient conditions and 220 rpm for oxygen limiting conditions. Samples of equal volume were taken at 0, 0.5, 1, 1.5, 2, 3 h and centrifuged, and pellets were stored at −80 °C. Bax concentrations of all samples were determined using Western blot and the fraction remaining was obtained by comparing Bax concentration of the sample to Bax concentration of the time zero sample.
3. Results
3.1. Bax specific expression level and productivity tripled under constant kLa
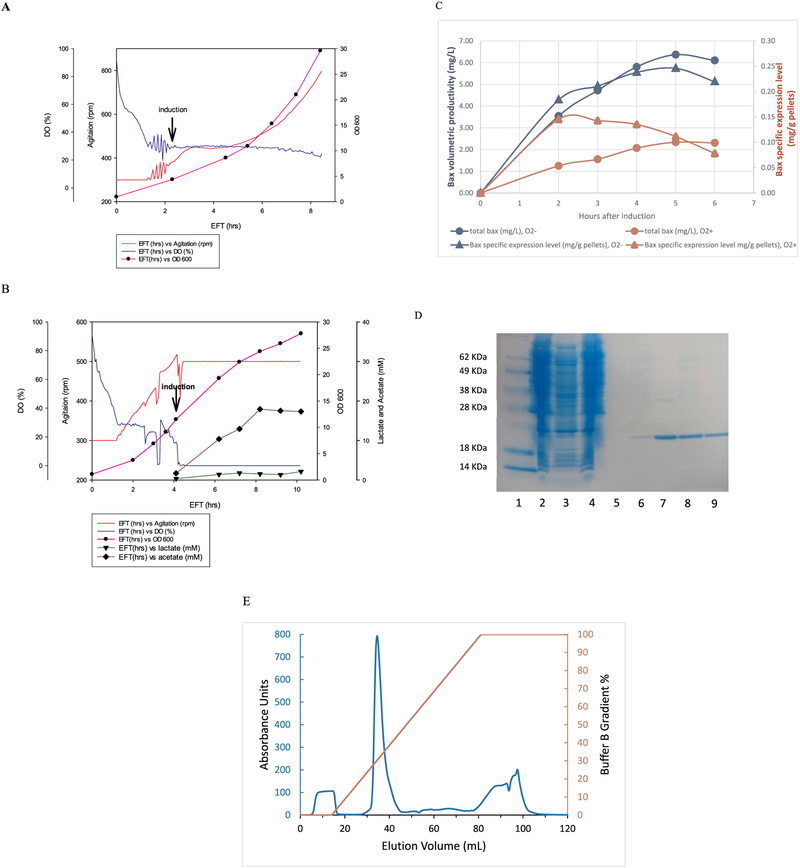
Since only 0.1–0.2 mg of Bax could be obtained from 1-L E. coli cultures in shake flasks, 10 L fermentations were used to improve the total protein yield. Fig. 1A–C shows the data obtained from 10 L fermentations of Bax. As shown in Fig. 1A, E. coli cells grown in this minimal medium had a doubling time of 1 h and were induced at 3–4 OD instead of 0.6–0.8 OD which is usually done in shake flask. Forty minutes after induction with IPTG, the degree of agitation required to maintain DO at 30% flattened out, indicating the decrease in oxygen demand due to recombinant protein synthesis. The fermentation recovered its oxygen demand 1 h later and agitation started to increase again. Interestingly, cells still grew at an exponential rate after induction, albeit the rate was half of that before induction with a doubling time of 2 h. The Bax specific expression level was 0.15 mg/g pellets after 2 h of induced growth (Fig. 1C red triangle), but this level decreased to 0.08 mg/g pellets after 6 h of induced growth. However, because cell density/weight increased exponentially using the fermenter, the total volumetric productivity of Bax (obtained by multi-plying the cell weight by its specific expression level) increased and maximized at about 2 mg/L 5 h post induction (Fig. 1C red circle). Typically, 300 g wet cell pellets were collected from each of the 10 L fermentation runs under oxygen sufficient conditions, and 5 mg pure Bax was obtained from 100 g pellets (3.3 L culture).
Fig. 1.
(A) Online data and OD600 profile from 10 L fermentation induced at oxygen sufficient conditions. (B) Online data and OD600 profile from 10 L fermentation induced at oxygen limiting conditions with constant kLa. (C) Bax specific expression level (mg/g pellets) and total volumetric productivity (mg/L) under oxygen sufficient and limiting conditions. (D) Bax purification through chitin column: lane 1 marker, lane 2 crude lysate, lane 3&4 flow through, lane 5 wash, lane 6–8 eluted Bax fractions 1–4. (E) Bax Q-column elution profile. The main Bax peak elutes at 30% buffer B.
Since the 50% decrease of Bax specific expression levels was not observed when cells were induced in shake flasks with a low kLa such as 50 ml cultures in 250 ml plastic shake flasks (data not shown), it was decided to induce E. coli cells in the fermenter with constant air flow and agitation (constant kLa) which mimicked conditions in the small shake flasks. In order to build up enough cell mass before induction, cells were grown to 12 OD under oxygen sufficient conditions before adding IPTG (Fig. 1B). At the time of induction, agitation rpm was held at that rate and maintained through the entire induction period. As shown in Fig. 1B, DO dropped to zero within minutes after agitation was no longer increasing to compensate for the increased oxygen demand of the IPTG-induced cell growth. Under this constant kLa and micro-aerobic conditions, cell density increased linearly rather than exponentially and reached 28 OD after 6 h of induction. Contrary to cells induced under oxygen sufficient conditions, Bax specific expression levels reached 0.24 mg/g pellets after 4 h of induction and kept almost constant until the end of the induction period (Fig. 1C blue triangles). The final volumetric productivity was 6 mg/L, which was three times higher over cells grown in oxygen-sufficient conditions. Fig. 1D shows a Coomassie-stained gel loaded with samples from Bax’s first purification step using a chitin column. The eluted fractions seen in lanes 6–9 were collected after reductant-induced cleavage of the CBP from Bax’s C-terminus. These fractions were pooled and run over a Q-column, which ionically separated Bax from impurities that coeluted with it from the chitin column. A typical elution profile for the Q-column run can be seen in Fig. 1E. Bax is the main peak eluting at the 30% buffer gradient mark. This peak was collected and further purified by size exclusion chromatography (data not shown). On average, 10 mg pure Bax was obtained from 50 gm pellets (2 L culture), which confirms the above-mentioned yields of Bax.
It was worth noting that short chain fatty acids (SCFA) such as formic acid, lactic acid and acetic acid could be generated under oxygen limiting conditions. In order to monitor the accumulation of SCFA, fermentation samples were centrifuged and the concentration of these compounds in the supernatant were measured using HPLC. There was no formic acid detectable, and the concentrations of lactate and acetate are shown in Fig. 1B. Before induction and under oxygen-sufficient conditions, the concentrations of lactate and acetate were 0.4 and 1.7 mM, respectively. These values increased significantly under oxygen-limiting conditions, and stabilized during the final 3 h of the induction period with lactate at 1.5 mM and acetate at 18 mM.
3.2. Ampicillin potency and plasmid stability
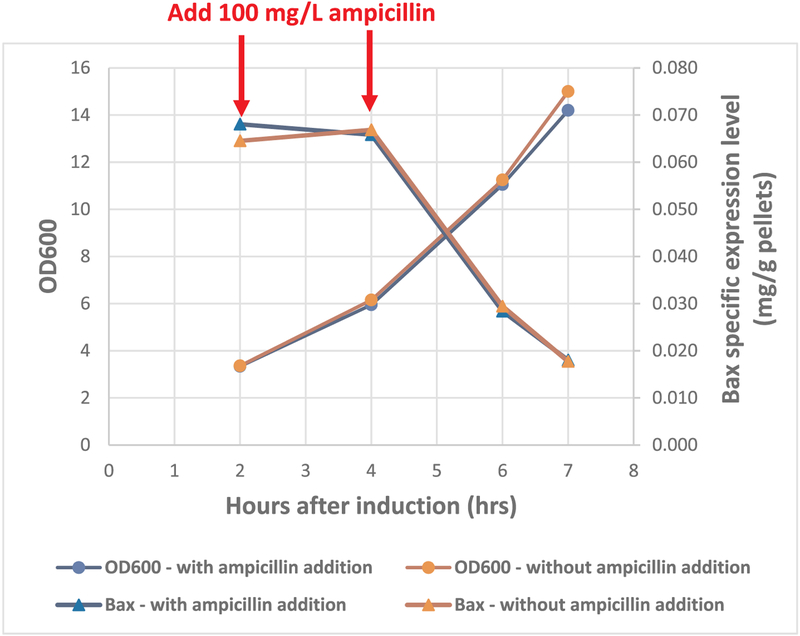
The loss of 50% Bax specific expression during the induction period was puzzling, and the first possible cause investigated was the loss of Bax expression vector. This plasmid has an Amp marker and is maintained by adding 100 mg/L ampicillin in the medium. Regular addition of ampicillin during induction period was carried out to test this hypothesis. Freshly made ampicillin was added to the culture with a final concentration of 100 mg/L at 2-h and 4-h post induction, alongside a control culture was grown without ampicillin addition. As seen in Fig. 2, the growth profiles and Bax specific expression levels were almost identical for the control and the one with ampicillin addition, where again Bax specific expression level dropped 50% after 6 h of induction and dropped even further after 7 h of induction. This trend of decline could not be stopped by adding additional antibiotics. Therefore, neither plasmid stability nor the ampicillin potency was the cause for the decrease of Bax specific expression level during induction.
Fig. 2.
Growth profile and Bax expression level for E. coli induced with or without ampicillin addition.
3.3. No inhibition of short chain fatty acids
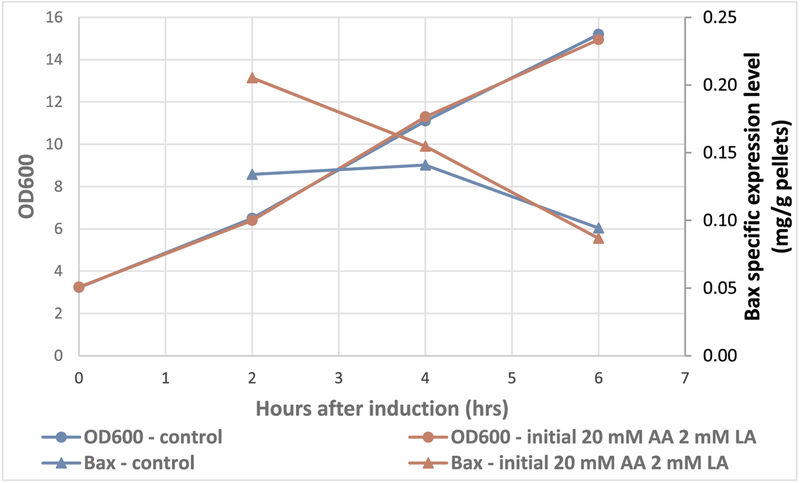
As reported by A. Roe et al., in 2002 [20], as little as 8 mM acetic acid in the medium can decrease E. coli growth rates by up to half at pH 6.0. For Bax-expressing cultures, there was close to 2 mM lactate and 20 mM acetate accumulated in oxygen limiting conditions. Here, the effect of acetate and lactate on bacterial growth and Bax expression was examined by adding 2 mM lactate and 20 mM acetate at the time of the induction. As shown in Fig. 3, the growth was not affected at all by addition of lactate and acetate. The extra short chain fatty acids did not prevent the decline of Bax specific expression level either. It seemed to elevate the Bax specific level at 2 h of induced growth, though did not affect the expression level at 4 h and 6 h after induction. Overall, the acetate and lactate generated by inducing E. coli at oxygen limiting conditions did not affect cell growth and Bax expression significantly.
Fig. 3.
Growth profile and Bax expression level for E. coli induced with or without lactate and acetate addition.
3.4. Proteomic data quality
There was still this lingering question of why Bax specific levels decreased at oxygen sufficient conditions but not oxygen limiting conditions with a constant kLa. In order to further investigate, all 10 induced samples from Fig. 1A and B, 5 from oxygen sufficient conditions (OXplus) and 5 from oxygen limiting conditions (OX-), were processed and subjected to proteomic analysis (see Method). There were 2448 proteins identified through our study and all are listed in Supplementary Table 1. Opitz et al. [13] quantified more than 1800 proteins from E. coli by mixing protonated and deuterated samples at 1:1 ratios, and Soufi et al. [14] identified 2303 proteins (88% of estimated expressed proteome of E. coli) using Super-Stable Isotope Labeling of Amino Acids. The method we applied here by Tandem Mass Tag labeling and bRPLC fractionation before nanoLCMS worked as well as the above mentioned methods, if not better.
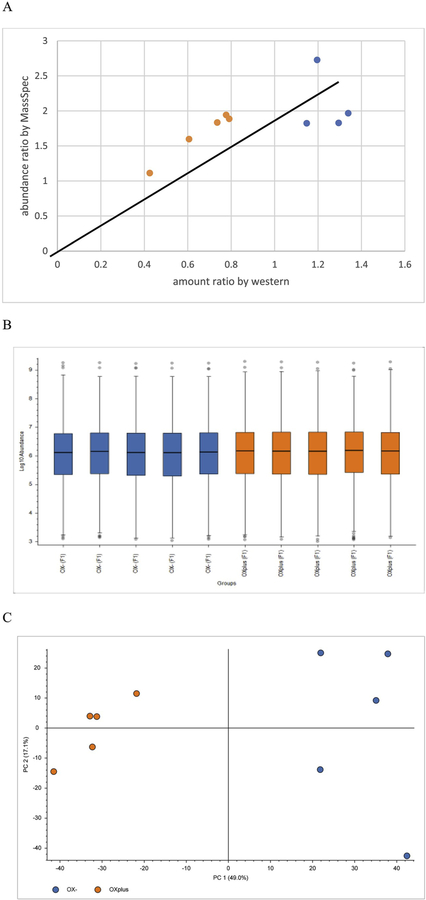
Bax was found in all 10 samples and its abundance was reported as the ratio to the amount in the sample of 2-h-induction-OX-. The same ratio was calculated using Bax specific expression levels measured by Western blot and was plotted against the one obtained by mass spec (Fig. 4A). These plots share the same linear regression line, which indicated that the mass spec data agreed with the Western blot data very well.
Fig. 4.
(A) Bax level predicted by mass spec and measured by Western blot (blue are samples from oxygen limiting under constant kLa, orange are samples from oxygen sufficient). (B) Distribution of the protein abundance of all samples. (C) Principal component analysis of normalized protein abundances from all ten samples, blue for oxygen limiting under constant kLa, orange for oxygen sufficient.
The TMT experiment is usually carried out to identify small fractions of proteins with changing expression levels from the thousands that are not in a culture. In order to load the same amount of proteins in each channel, protein assays were performed before mixing all ten labelled samples together. Furthermore, mass spec data were used to normalize the protein amount across the channels to make sure of equal loading. As shown in Fig. 4B, there was only slight variations in total protein amount between channels (samples), and the distributions and standard deviations were very similar, which resulted in good normalization across the channels. In other words, this demonstrated quality control of the mass spec data, showing that the overall sample prep was consistent and therefore the changing protein levels observed were trustworthy based on the normalization used.
As shown in Fig. 4C, principal component analysis separated samples from oxygen limiting conditions to the right panel, and samples from oxygen sufficient conditions to the left panel, which further confirmed their distinct difference and validated the data quality. Altogether, there was high confidence that the quality of proteomic data was reliable and further analysis was conducted using this set of data.
3.5. Changes in E. coli proteome specific to induction at oxygen sufficient conditions
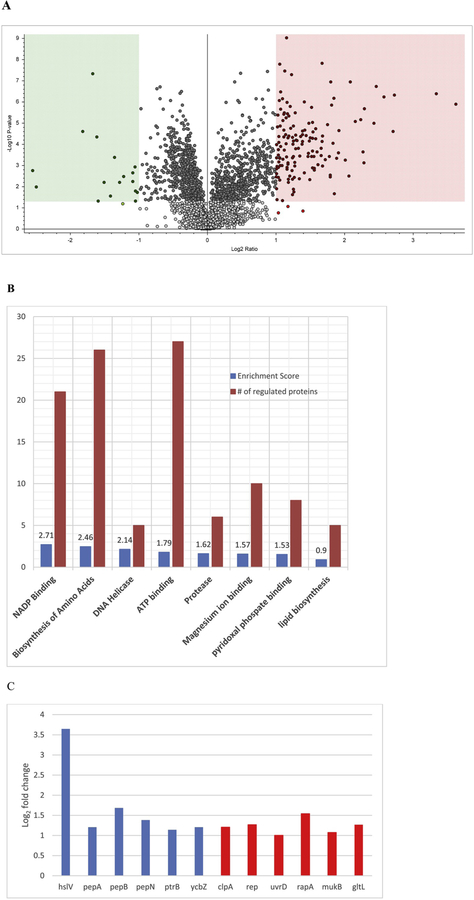
The relative protein abundance from oxygen sufficient and oxygen limiting inductions followed a very different pattern, as seen in Fig. 5A. When comparing induction at oxygen sufficient conditions vs. oxygen limiting conditions, 136 proteins exhibited two-fold increase with a P-value < 0.05 (pink panel Fig. 5A), whereas 17 proteins had a two-fold decrease with P-value < 0.05 (blue panel Fig. 5A). The abundance and statistics of all changed proteins are listed in Supplemental Table 2.
Figure 5.
(A) Log, fold changes in protein abundance and their statistical significance in the proteomes of E. coli cells induced under oxygen limiting with constant kLa (left panel) and oxygen sufficient (right panel). (B) Enrichment values and total number of proteins in each cluster generated through functional annotation analysis of 136 proteins upregulated under oxygen sufficient conditions. (C) Log2 fold changes of the proteases (in blue) and ATPases (in red) under oxygen sufficient conditions.
The 136 proteins upregulated under oxygen sufficient conditions were input into DAVID Bioinformatics Resources 6.8 (https://david.ncifcrf.gov/), and subjected to Functional Annotation Analysis. There were 15 significant functional clusters identified, and the enrichment value and total number of proteins in each of the top 8 clusters were plotted in Fig. 5B. The top five functional clusters listed were NADP binding, ATP binding, amino acids synthesis, DNA helicase and proteases. Since E. coli cells were grown under no limitation of oxygen or substrate and the TCA cycle was at its full capacitive operation, it was understandable that the NADP binding and ATP binding proteins were upregulated to accommodate the needs of higher respiration and energy synthesis. At the higher growth rate, amino acid synthesis rates were faster to meet the cellular demand and helicase levels were higher to facilitate rapid DNA replication.
To understand the rationale of increased protease levels, the six upregulated proteases and six ATPases under the ATP binding category were plotted in Fig. 5C along with their fold changes. The reason behind the increase of some ATPases, such as rep, uvrD, rapA, mukB, gltL, was to upregulate translation, transcription and transportation demanded by higher cell growth rates. However, the increase of clpA, an ATP-dependent specificity component of the ClpAP protease, was for housekeeping purposes. So were the six energy dependent proteases, hslV (clpQ), pepA, pepB, pepN, ptrB, ycbZ. Over synthesis of recombinant proteins during the induction period caused cell stress, which in turn stimulated proteolytic activities [21]. Evidently, the stimulation was stronger when cells were induced at oxygen sufficient conditions. In other words, there were more proteases for recombinant Bax degradation when E. coli was induced at oxygen sufficient conditions. The recombinant Bax expression level at any given induction time is determined by its synthesis rate and degradation rate. When its degradation rate is faster than its synthesis rate, its expression level in each cell decreases. This may explain why Bax specific expression levels decreased during induction at oxygen sufficient conditions, because there were more proteases expressed which caused proteolytic activities to outpace synthesis.
3.6. Bax turnover under oxygen sufficient and limiting conditions
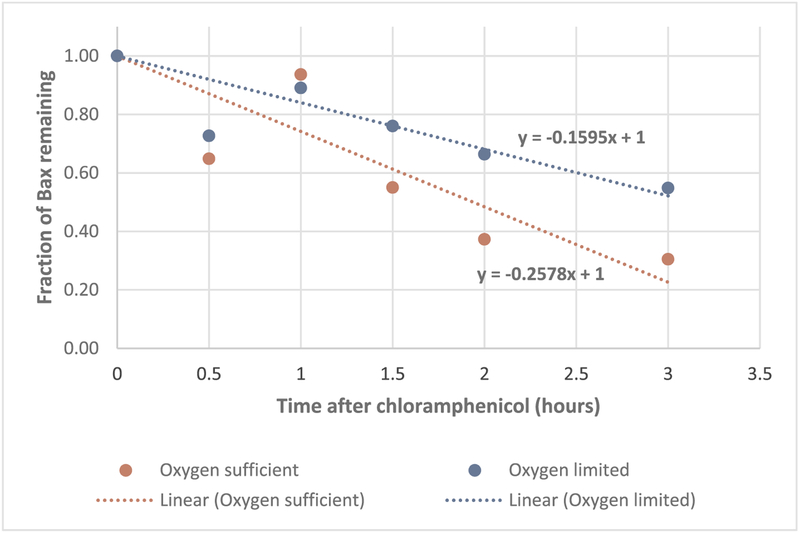
There are studies of protein turnover by adding antibiotic such as chloramphenicol or spectinomycin to E. coli culture, then monitoring the decline of the protein of interest [22,23]. Chloramphenicol is known to bind to 50 S subunit of ribosome, therefore stop protein synthesis by inhibiting the peptidyl transferase step. Here a similar approach was adopted to observe Bax turnover by adding chloramphenicol to induced culture at 100 mg/L. As shown in Fig. 6, Bax degradation was much slower under oxygen limiting conditions, where the rate of turnover was only 60% of the one under oxygen sufficient conditions. Bax was degraded at a rate of 16% per hour under limited oxygen but 26% per hour under sufficient oxygen. Under oxygen limiting conditions, Bax specific expression level increased from 0.18 mg/g pellets at 2 h post induction to 0.22 mg/g pellets at 6 h post induction, a 21% increase in 4 h. On the other hand, specific level dropped from 0.15 mg/g pellets to 0.08 mg/g pellets under oxygen sufficient conditions, a 47% decrease in 4 h (Fig. 1C). Just degradation alone could not account all the difference of the specific expression levels between the two conditions. It was possible that oxygen also played a role of affecting the recombinant protein synthesis rates.
Fig. 6.
Bax turnover monitored by adding chloramphenicol to stop protein synthesis: red circles are from flasks with sufficient oxygen and blue circles are from flasks with limited oxygen.
4. Discussions
When scaling up a recombinant protein expression process from shake flask to bioreactor, the conventional wisdom is to grow and induce E. coli cells at oxygen non-limiting conditions with the dissolved oxygen level kept above 20%. In this way, large quantities of cells could be amassed and buildup of harmful metabolites such as acetic acid, formic acid and lactic acid could be kept to a minimum. There were some instances where the best expression was achieved by scaling up based on constant kLa, but neither the oxygen level nor the amount of short chain fatty acids generated in the fermenter was reported [11]. Here, we report the best expression of 6 mg/L of Bax by growing E. coli to higher density at oxygen sufficient conditions but inducing it with a constant kLa at oxygen limiting conditions. The acids generated did not affect either the growth or expression, and the specific expression level kept constant, probably due to lower protease levels under oxygen limiting conditions that are otherwise prevalent under oxygen sufficient conditions.
There are three major protease components in E. coli: Lon, ClpA/XP, and ClpYQ [21]. BL21 E. coli strain is a Lon knockout, therefore the burden lays on ClpA/XP and ClpYQ for housekeeping proteolytic activities. It was reported by Wu and Gottesman [24] that there was redundancy between Lon and ClpYQ, claiming that ClpYQ was a backup for Lon under certain conditions. Interestingly, it is worth mentioning that ClpYQ increased almost 4-fold under oxygen sufficient conditions, a substantial increase compared to other proteases. It is possible that a ClpYQ knockout E. coli expression strain would improve recombinant protein expression by decreasing host proteolytic activities, but it cannot be ruled out that other proteases would step up just like ClpYQ did for the Lon knockouts. Nonetheless, the global regulator, oxygen, seems to play a rather indirect but effective role to curb recombinant protein degradation.
We believe our finding might be a general one, most likely associated with cases where target recombinant protein expression is relatively low. It would be advisable to try to implement a similar approach as reported here to manage competing expression between target proteins and proteases with the outcome of the highest possible yield of the target protein.
Supplementary Material
Acknowledgments
We would like to thank Dr. Rod Levine from Laboratory of Biochemistry in NHLBI, NIH for his valuable input and discussion. These investigations were supported by the Intramural Research Programs of the National Heart, Lung, and Blood Institute (NHLBI) of the NIH.
Footnotes
Appendix A. Supplementary data
Supplementary data to this article can be found online at https://doi.org/10.1016/j.pep.2019.105501.
References
- [1].Suzuki M, Youle RJ, Tjandra N, Structure of Bax: coregulation of dimer formation and intracellular localization, Cell 103 (2000) 645–654. [DOI] [PubMed] [Google Scholar]
- [2].Uren RT, Iyer S, Kluck RM, Pore formation by dimeric Bak and Bax: an unusual pore? Philos. Trans. R. Soc. Lond. B Biol. Sci 372 (2017). [DOI] [PMC free article] [PubMed] [Google Scholar]
- [3].Tsai CJ, Liu S, Hung CL, Jhong SR, Sung TC, Chiang YW, BAX-induced apoptosis can be initiated through a conformational selection mechanism, Structure 23 (2015) 139–148. [DOI] [PubMed] [Google Scholar]
- [4].Gahl RF, He Y, Yu S, Tjandra N, Conformational rearrangements in the pro-apoptotic protein, Bax, as it inserts into mitochondria: a cellular death switch, J. Biol. Chem 289 (2014) 32871–32882. [DOI] [PMC free article] [PubMed] [Google Scholar]
- [5].Tripathi NK, Production and purification of recombinant proteins from Escherichia coli, Chem. Bio. Eng. Rev 3 (2016) 116–133. [Google Scholar]
- [6].de Messieres M, Huang RK, He Y, Lee JC, Amyloid triangles, squares, and loops of apolipoprotein C-III, Biochemistry 53 (2014) 3261–3263. [DOI] [PMC free article] [PubMed] [Google Scholar]
- [7].DuMond JF, He Y, Burg MB, Ferraris JD, Expression, fermentation and purification of a predicted intrinsically disordered region of the transcription factor NFAT5, Protein Expr. Purif 115 (2015) 141–145. [DOI] [PMC free article] [PubMed] [Google Scholar]
- [8].Kang H, Oka S, Lee DY, Park J, Aponte AM, Jung YS, Bitterman J, Zhai P, He Y, Kooshapur H, Ghirlando R, Tjandra N, Lee SB, Kim MK, Sadoshima J, Chung JH, Sirt1 carboxyl-domain is an ATP-repressible domain that is transferrable to other proteins, Nat. Commun 8 (2017) 15560. [DOI] [PMC free article] [PubMed] [Google Scholar]
- [9].Yee L, Blanch HW, Recombinant protein expression in high cell density fed-batch cultures of Escherichia coli, Biotechnology 10 (1992) 1550–1556. [DOI] [PubMed] [Google Scholar]
- [10].Garcia-Ochoa F, Gomez E, Bioreactor scale-up and oxygen transfer rate in microbial processes: an overview, Biotechnol. Adv 27 (2009) 153–176. [DOI] [PubMed] [Google Scholar]
- [11].Pérez RE, Suárez JG, Diaz EN, Rodríguez RS, Menéndez EC, Balaguer HD, Lasa AM, Scaling-up fermentation of Escherichia coli for production of recombinant P64k protein from Neisseria meningitidis, Electron. J. Biotechnol 33 (2018) 29–35. [Google Scholar]
- [12].Aldor IS, Krawitz DC, Forrest W, Chen C, Nishihara JC, Joly JC, Champion KM, Proteomic profiling of recombinant Escherichia coli in high-cell-density fermentations for improved production of an antibody fragment biopharmaceutical, Appl. Environ. Microbiol 71 (2005) 1717–1728. [DOI] [PMC free article] [PubMed] [Google Scholar]
- [13].Opitz C, Ahrne E, Goldie KN, Schmidt A, Grzesiek S, Deuterium induces a distinctive Escherichia coli proteome that correlates with the reduction in growth rate, J. Biol. Chem 294 (2019) 2279–2292. [DOI] [PMC free article] [PubMed] [Google Scholar]
- [14].Soufi B, Krug K, Harst A, Macek B, Characterization of the E. coli proteome and its modifications during growth and ethanol stress, Front. Microbiol 6 (2015) 103. [DOI] [PMC free article] [PubMed] [Google Scholar]
- [15].De Baere S, Eeckhaut V, Steppe M, De Maesschalck C, De Backer P, Van Immerseel F, Croubels S, Development of a HPLC-UV method for the quantitative determination of four short-chain fatty acids and lactic acid produced by intestinal bacteria during in vitro fermentation, J. Pharm. Biomed. Anal 80 (2013) 107–115. [DOI] [PubMed] [Google Scholar]
- [16].Meier K, Klöckner W, Bonhage B, Antonov E, Regestein L, Büchs J, Correlation for the maximum oxygen transfer capacity in shake flasks for a wide range of operating conditions and for different culture media, Biochem. Eng. J 109 (2016) 228–235. [Google Scholar]
- [17].Gupta A, Rao G, A study of oxygen transfer in shake flasks using a non-invasive oxygen sensor, Biotechnol. Bioeng 84 (2003) 351–358. [DOI] [PubMed] [Google Scholar]
- [18].Dayon L, Hainard A, Licker V, Turck N, Kuhn K, Hochstrasser DF, Burkhard PR, Sanchez JC, Relative quantification of proteins in human cerebrospinal fluids by MS/MS using 6-plex isobaric tags, Anal. Chem 80 (2008) 2921–2931. [DOI] [PubMed] [Google Scholar]
- [19].Yang F, Shen Y, Camp DG 2nd, Smith RD, High-pH reversed-phase chromatography with fraction concatenation for 2D proteomic analysis, Expert Rev. Proteomics 9 (2012) 129–134. [DOI] [PMC free article] [PubMed] [Google Scholar]
- [20].Roe AJ, O’Byrne C, McLaggan D, Booth IR, Inhibition of Escherichia coli growth by acetic acid: a problem with methionine biosynthesis and homocysteine toxicity, Microbiology 148 (2002) 2215–2222. [DOI] [PubMed] [Google Scholar]
- [21].Gottesman S, Proteases and their targets in Escherichia coli, Annu. Rev. Genet 30 (1996) 465–506. [DOI] [PubMed] [Google Scholar]
- [22].Camberg JL, Hoskins JR, Wickner S, The interplay of ClpXP with the cell division machinery in Escherichia coli, J. Bacteriol 193 (2011) 1911–1918. [DOI] [PMC free article] [PubMed] [Google Scholar]
- [23].Rozkov A, Schweder T, Veide A, Enfors S-O, Dynamics of proteolysis and its influence on the accumulation of intracellular recombinant proteins, Enzym. Microb. Technol 27 (2000) 743–748. [DOI] [PubMed] [Google Scholar]
- [24].Wu WF, Zhou Y, Gottesman S, Redundant in vivo proteolytic activities of Escherichia coli Lon and the ClpYQ (HslUV) protease, J. Bacteriol 181 (1999) 3681–3687. [DOI] [PMC free article] [PubMed] [Google Scholar]
Associated Data
This section collects any data citations, data availability statements, or supplementary materials included in this article.


