Abstract
We describe a new class of fluorescence polarization immunoassays based on the luminescence from an asymmetrical Ru-ligand complex. We found that such a complex displays larger polarization values than those of comparable symmetrical complexes and appear to be highly photostable in aqueous solution. We synthesized a conjugatable Ru-ligand complex, which was used to label human serum albumin (HSA) as the antigen. The Ru—ligand complex displays a long decay time near 400 ns when covalently linked to proteins. We found that the steady-state polarization of labeled HSA was sensitive to binding of anti-HSA, resulting in a 200% increase in polarization. The labeled HSA was also used in a competitive format using unlabeled HSA as the antigen. The time-resolved anisotropy decays demonstrate increased correlation times for labeled HSA in the presence of anti-HSA, an effect which was partially reversed in the presence of unlabeled HSA. These results demonstrate the potential of the metal-ligand complexes to be used in the fluorescence polarization immunoassay of high-molecular-weight analytes. The use of such metal—ligand complexes enable fluorescence polarization immunoassays which bypass the usual limitation to low-molecular-weight antigens, which is a consequence of the 2–5 ns decay time of the previously used fluorophores.
Fluorescence-based assays are widely used in analytical and clinical chemistry (1–3). Many of these applications of fluorescence are based on the use of immunological methods which provide the specificity needed to selectively detect a wide variety of antigens (4–6). Fluorescence immunoassays can be based on a variety of mechanisms which affect the observed spectral properties, including fluorescence quenching, enhancement, polarization, energy transfer, and the use of fluorogenic substrates (6).
Fluorescence polarization immunoassays (FPI)1 is one of the more versatile and widely used methods. The assays are based on polarization measurements of antigens labeled with fluorescence probes, typically fluorescein derivatives. This method was introduced by several groups (7–11) and is now in widespread commercial use in an instrument marketed by Abbott Laboratories. A serious limitation of present immunoassays is that they are limited to low-molecular-weight antigens. This limitation is the result of the use of fluorophores, such as fluorescein, which display lifetimes near 4 ns. A FPI requires that the emission from the unbound labeled antigen be depolarized, so that an increase in polarization may be observed upon binding to antibody. For depolarization to occur the antigen must display a rotational correlation time much shorter than 4 ns, which limits the FPI to antigens with molecular weight less than several thousand daltons.
In the present paper we demonstrate that the Ru complex [Ru(bpy)2 (dcbpy)] displays high polarization in viscous solution and when bound to proteins. This is a surprising result because one may expect such symmetric complexes to have low polarization due to randomization of the excited state among the three ligands. Importantly, the lifetime of these complexes is near 400 ns. Consequently, the use of such metal-ligand complexes in FPI should allow immunoassays of antigens with molecular weights up to one million daltons.
THEORY
The fluorescence polarization (P) of a labeled macromolecule depends on the fluorescence lifetime (τ) and the rotational correlation time (θ)
| [1] |
where P0 is the polarization observed in the absence of rotational diffusion. The effect of molecular weight on the polarization values can be seen from an alternative form of Eq. [1],
| [2] |
where k is the Boltzmann constant, T is the absolute temperature (K), η is the viscosity, and V is the molecular volume (12). The molecular volume of the protein is related to the molecular weight (Mr) and the rotational correlation time by
| [3] |
where R is the ideal gas constant, is the specific volume of the protein, and h is the hydration, typically 0.2 g H2O/g of protein. Generally, the observed correlation times are about twofold longer than those calculated for an anhydrous sphere (Eq. [3] with h = 0) due to the effects of hydration and the nonspherical shapes of most proteins. Hence, in aqueous solution at 20°C (η = 1 cP) one can expect a protein such as HSA (Mr ≃65,000, with ) to display a rotational correlation time near 50 ns.
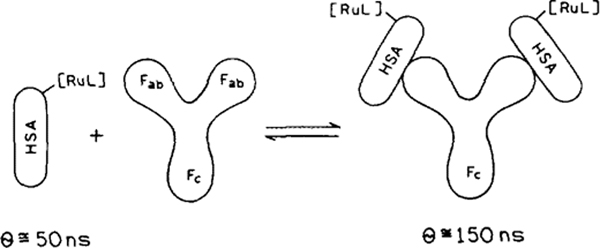
The advantage of using a fluorophore with a long decay time can be seen by comparing the expected polarization values of HSA when free in rotation and when bound to IgG (Mr, 160,000) (Scheme 1). For this calculation it is more convenient to use the anisotropy (r). The anisotropy and polarization are related as
| [4] |
| [5] |
SCHEME 1.
Intuitive description of a fluorescence polarization immunoassay. RuL is the Ru-ligand complex and θ is the rotational correlation time.
where and are the vertically and horizontally polarized components of the emission (13). The values of P and r can be interchanged using
| [6] |
| [7] |
The parameters P and r are both in common use. The values of P are used more often in FPI because they are entrenched by tradition and slightly larger than the anisotropy values. The parameter r is preferred on the basis of theory. The anisotropy of a labeled macromolecule is given by
| [8] |
where r0 is the value observed in the absence of rotational diffusion and is typically near 0.3.
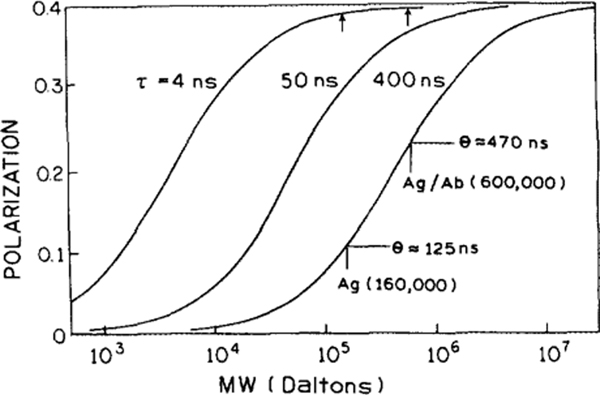
Based on Eqs. [1] and [3], we calculated the expected polarization values for a lifetime of 4, 50, and 400 ns for a range of molecular weights. For these calculations we assume that the polarization in the absence of rotation diffusion (P0) was 0.4. These calculations (Fig. 1) demonstrate how the lifetime of the fluorophore determines the range of molecular weights which can be resolved by the fluorophore. For present immunoassays the lifetimes of the probes are near 4 ns (fluorescein or rhodamine). The polarization of low-molecular-weight antigens (Mr <1000) can be estimated from Fig. 1 to be in the range of 0.07 and that of the antibody-bound antigen (Mr, 160,000) to be about 0.39. Hence, a large change in polarization is found upon binding of Ag to Ab for low-molecular-weight antigens (see Fig. 1).
FIG. 1.
Molecular-weight-dependent polarization for a protein-bound fluorophore with fluorescence lifetime (τ) of 4, 50, and 400 ns. The curves are based on Eqs. [1] and [3] assuming for the proteins in aqueous solution at 20°C with a viscosity of 1 cP. The arrows and bars indicate Mrs of the antigen (Ag) and antibodies (Ab) and complexes discussed in the text.
However, if the molecular weight of the antigen is larger, above 20,000 Da, then the polarization changes only slightly upon binding to antigen. For instance, suppose the molecular weight of the labeled antigen is about 160,000, with a correlation time θ = 125 ns, and that of the antibody-bound form is 600,000 with θ = 470 ns. In this case the polarization values for the presently used short-lifetime fluorophores will differ only about 2% for the free and bound form of the antigen (see Fig. 1, arrows). The small change in polarization can be related to a large discrepancy between the lifetime of the fluorophore and the correlation time of the molecules. Due to the low sensitivity of a 4-ns fluorophore in the high-molecular-weight range, FPIs are routinely performed only on low-molecular-weight antigens.
Suppose the lifetime of the probe is near 400 ns, which is near the value found for our metal-ligand complex. For the example described above, the polarization value of the labeled antigen is expected to increase by 110% upon binding to the antibody compared to about 2% for the 4-ns-lifetime probe (see Fig. 1). Also, many antibodies of interest (e.g., IgM) are still larger (Mr, 950,000, θ ≥ 700 ns) which will yield still higher polarization. Theoretically, a fluorophore with a lifetime of 400 ns could allow the analysis of biological systems with molecular weights up to 10 million daltons and correlation times up to 8 μs.
MATERIALS AND METHODS
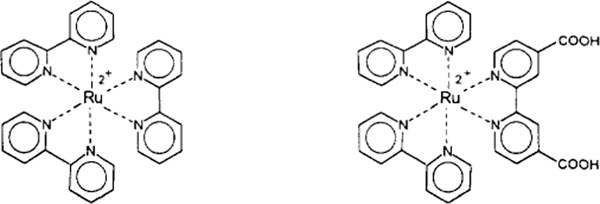
The chemical structures of the symmetric and a non-symmetric ruthenium metal-ligand complexes are shown in Scheme 2. Ru(bpy)3Cl2 was purchased from the Aldrich Chemical Company. Chemical synthesis of the NHS ester of [Ru(bpy)2(dcbpy)]2+ has been described elsewhere (14).
SCHEME 2.
Chemical structure of [Ru(bpy)3]2+ and of [Ru(bpy)2(dcbpy)].
Monoclonal IgG specific for HSA (anti-HSA) from mouse ascites, human IgG, mouse IgG2a,k, (UPC-10) and HSA were purchased from Sigma Chemical Company and used without further purification. HSA was labeled with the NHS ester of [Ru(bpy)dcbpy] by adding a 30-fold molar excess of the Ru-NHS ester in 50 μ1 of di-methylformamide to 0.75 ml of a stirred protein solution (0.2 M carbonate buffer, pH 9.2), followed by a 3-h incubation at room temperature and purification of the labeled protein by gel filtration chromatography on Sephadex G-25, using 50 mM phosphate-buffered saline, (PBS), pH 7.2. The dye:protein ratio of the Ru-HSA conjugate was determined to be 11:1 with an estimated protein concentration of 1.9 mg/ml.
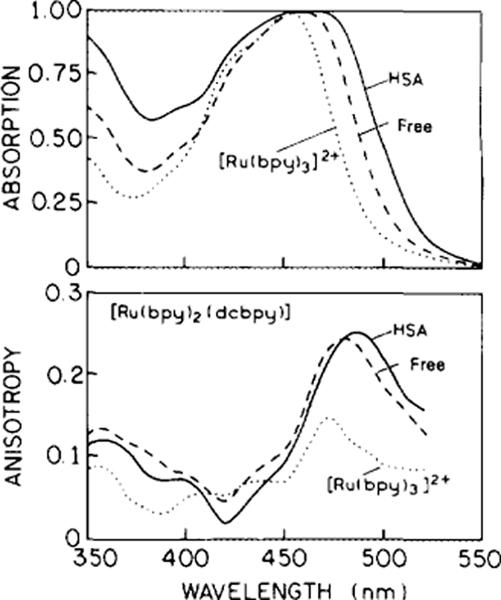
Fluorescence intensity and anisotropy decays were measured by time-correlated single photon counting (TCSPC). The primary light source was a cavity-dumped (1 MHz) pyridine one-dye laser, frequency doubled to 360 nm. This dye laser was pumped by a mode-locked Nd:YAG laser. We used 360 nm as the excitation wavelength for our Ru complex, even though fluorophore exhibits lower anisotropies at this wavelength than at the maximum 485 nm (see Fig. 2). In previous studies we used 483 nm excitation from a perylene solution excited by the same dye laser (14). The intensity from this “perylene lamp” which allows excitation at 483 nm used in our previous experiments (14) was in-sufficient in our present measurements due to low concentrations of the fluorophore. Detection of the emission was accomplished with a Hamamatsu R2809 microchannel plate (MCP) PMT and the usual electronics for TCSPC (15). To isolate the emission we used a 660-nm interference filter with a bandpass of 10 nm.
FIG. 2.
Absorption (top) and excitation anisotropy spectra (bottom) of [Ru(bpy)2(dcbpy)], free (- - -) and when conjugated to HSA (—). Absorption spectra are in aqueous buffers at 20°C, and the anisotropy spectra are in glycerol:buffer (9:1, v/v) at −55°C. The dotted lines (. . .) represent the symmetrical [Ru(bpy)3]Cl2. The emission wavelength was 650 nm, except for [Ru(bpy)3 ]C12 for which we used 600 nm, with bandpass 8 nm.
RESULTS
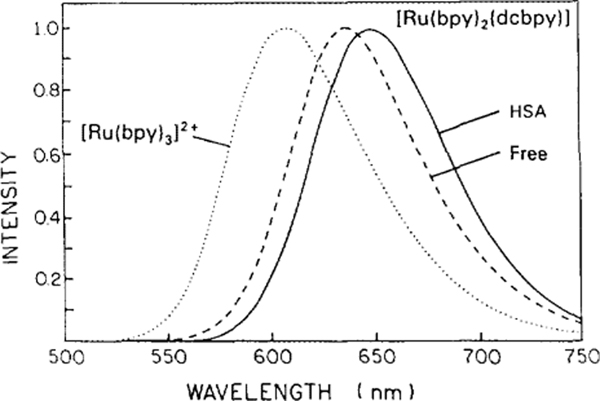
Absorption and emission spectra of [Ru(bpy)2-(dcbpy)], here called the Ru complex, are shown in Figs. 2 (top) and 3. These spectra are normalized to unity to facilitate comparison. At pH 7, the net charge on the Ru complex is expected to be zero, with two positive charges on the Ru and two negative charges from the two dcbpy ligands. The long-wavelength absorption bands of the free and protein-bound forms of Ru are similar except for a modest shift of the maximum and an observed band broadening for the protein-bound form (Fig. 2). The emission spectrum of Ru-labeled HSA is red shifted about 10 nm relative to that of the Ru complex in aqueous solution at pH 7 (Fig. 3). We also investigated the effect of oxygen on the quantum yields of the free and protein-bound Ru complexes. Compared to their deoxygenized solutions, the relative fluorescence intensities for [Ru(bpy)2 (dcbpy)] and Ru-HSA in air-equilibrated buffer solutions were 0.77 and 0.89, respectively. The intensity of the free Ru complex is more sensitive to dissolved oxygen than the protein-bound form. However, the sensitivity of the protein-bound form is modest and will not require elimination of oxygen for use in polarization immunoassays.
FIG. 3.
Emission spectra of [Ru(bpy)3]Cl2, and [Ru(bpy)2(dcbpy)] free (pH 7) and when conjugated to HSA, at excitation wavelength 460 nm, 20°C in PBS.
We examined the steady-state excitation anisotropy spectra for [Ru(bpy)3]2+- and [Ru(bpy)2 (dcbpy)] - labeled HSA (Fig. 2, bottom) in vitrified solutions where rotational diffusion does not occur during the excited state lifetime. Importantly, the HSA conjugate of [Ru(bpy)2(dcbpy)] displays a steady-state polarization value of 0.35 (anisotropy value of 0.26) for excitation near 480–490 nm. In contrast, the more symmetrical [Ru(bpy)3]2+ displays considerably smaller values at excitation wavelengths above 450 nm. Observation of a high polarization for these complexes is not an obvious result. A large number of published reports have suggested that the anisotropy and anisotropy decay of the Ru metal-ligand complexes is due to intermolecular processes such as randomization of the excited state among the three organic ligands and/or interactions with the solvent which result in localization of the excited state after randomization (15–17). Evidently, the presence of a nonidentical ligand is important for obtaining a useful anisotropy probe.
The usefulness of the Ru complex in a FPI depends on the lifetime of the excited state. We use TCSPC to determine the luminescence lifetimes of the Ru complex and the Ru-labeled HSA. The intensity decays were closely approximated by a single decay time. The decay times of the labeled HSA are about 7% shorter than those of the free Ru complex under the same experimental conditions (Table 1). The decay times are also shorter in presence of oxygen. Oxygen quenching is about twice more efficient for the free Ru complex than for the protein-bound form. The long lifetime of this complex suggests that the Ru complex can be used to measure rotational correlation times as long as 1.5 μs, about three times the luminescence lifetime.
TABLE 1.
Lifetimes (τ), Rotational Correlation Times (θ), and Polarizations (P) of [Ru(bpy)2(dcbpy)] free,a Labeled to HSA and Bound to Anti-HSA (Ab)
Immunoassay for HSA
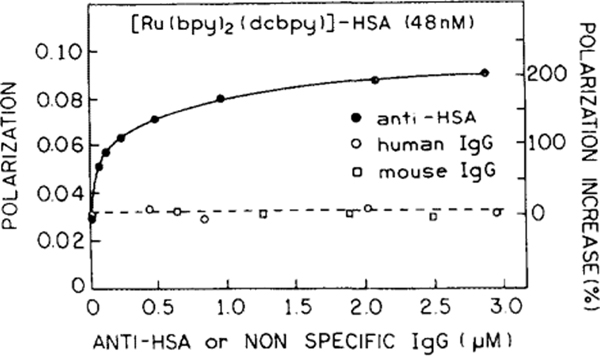
We examined the changes in polarization of Ru-labeled HSA in the presence of increasing amounts of anti-HSA (Fig. 4). As a result the polarization (Fig. 4, closed circles) increased about threefold from 0.029 to a plateau at 0.09. Similar results were obtained using two different batches of anti-HSA with Ab concentrations ranging from 0 to 40 times of that of Ru-HSA (Ag). We used two types of nonspecific IgG as controls. The first was purified nonspecific human IgG (Fig. 4, open circles), which was used to confirm the specifity of the Ru-HSA/anti-HSA reaction. The second was a mouse IgG (clarified ascites, Fig. 4, open squares) which, according to the manufacturer, contained similar proteins as did the specific monoclonal anti-HSA (Ab). The separate titration of the Ru-labeled HSA with nonspecific mouse ascites was performed to correct for any nonspecific binding of the tracer antigen to proteins, present in large amounts (25 mg/ml) in the ascites fluid of anti-HSA. The unspecific proteins were found not to effect the polarization of the tracer antigen. Importantly, no detectable changes in polarization of Ru-HSA were observed in both control experiments (Fig. 4).
FIG. 4.
Steady-state fluorescence polarization of Ru HSA at various concentrations of IgG specific for HSA (anti-HSA) or nonspecific IgG. The excitation wavelength was 485 nm and observation was 660 nm with a bandpass of 10 nm at 20°C.
One may question whether labeling of HSA with the Ru complex altered its antigenicity. Such changes probably occurred, but apparently did not eliminate binding between labeled HSA and anti-HSA (Fig. 4). We did not attempt to use the data in Fig. 4 to determine the labeled HSA-anti-HSA association constant, which can be difficult given the essential irreversibility of such reactions.
We attempted to developed a competitive assay for HSA, wherein labeled and unlabeled antigens are competing for the binding sites in the Ab. The simultaneous exposure of labeled and unlabeled HSA to anti-HSA did not result in measurable changes of polarization. This may reflect a higher affinity of anti-HSA for labeled HSA than for unlabeled HSA. However, preincubation of the unlabeled HSA and anti-HSA for 30 min, followed by the addition of Ru-labeled HSA, resulted in measurable changes in polarization. In this sequential immunoassay the concentrations for Ru-labeled HSA and anti-HSA were 48 and 720 nM, respectively (Fig. 5). The polarization was found to decrease with increasing amounts of unlabeled HSA in the range of 0 to 700 nM. At high concentrations of unlabeled HSA, the polarization could not be reversed to the value for unbound Ru-HSA (P = 0.029), which should be observed on total replacement of Ru-HSA by HSA. The most evident explanation for this effect would have been nonspecific binding of the Ru-HSA to other proteins present in solution. As the polarization of Ru-HSA was proven not to be influenced by the presence of the unspecific proteins in the IgG ascites fluid (see above), this effect could possibly be explained by a higher binding affinity of the Ab for Ru-labeled HSA than for free HSA or irreversible interactions between the Ab and Ags. It seems probable that additional research to identify suitable antibodies could result in an improved competitive immunoassay. The present results are intended to demonstrate the feasibility of our method.
FIG. 5.
Competitive immunoassay for HSA showing the steady-state fluorescence polarization of Ru-HSA. The Ru-HSA was added to preincubated mixtures of anti-HSA with increasing amounts of free HSA. Error bars represent the standard deviations of three polarization readings. See Fig. 4 for experimental conditions.
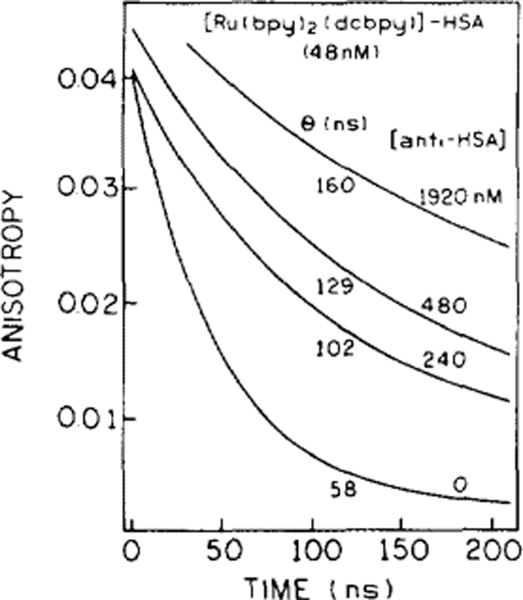
The changes in the steady-state polarization shown in Figs. 4 and 5 were supported by the time-resolved anisotropy decay measurements shown in Figs. 6 and 7. Here we use the anisotropy, rather than the polarization, because the former more directly reveals the rotational motion. Time-dependent anisotropy decays of the Ru-labeled HSA in the presence of 0, 240, 480, and 1920 nM anti-HSA are presented in Fig. 6. For a sample containing Ru-HSA and Ru-HSA bound to IgG one can expect two or more rotational correlation times. However, the resolution of the present time-resolved data were not adequate to recover multiple correlation times. Instead, we recovered a single mean correlation time which contains contributions from Ru-HSA in the free and bound forms. Our ability to distinguish multiple correlation times was decreased by the presence of short-lived impurities. The anisotropy decay analyses presented in Fig. 6 were calculated for the TCSPC data, 25 ns (0, 240, 480 nM anti-HSA) and 50 ns (192 nM anti-HSA) after the maximum to avoid influence of impurities fluorescence from anti-HSA. This “gating” method resulted in loss of resolution. This kind of gating should be regarded as advantageous. For real samples we can expect undesirable fluorescence from impurities, which can be easily removed from the observed signal using a gate of 10–50 ns. The values for the correlation times and lifetimes of Ru-labeled HSA for various concentrations of Ab are summarized in Table 1. While the changes in lifetime are small, the correlation times for the Ab/Ag complexes increase on addition of anti-HSA from θ = 58 ns (Ru-HSA + 0 Ab) to 178 ns (+ 2880 nM Ab).
FIG. 6.
Time-dependent anisotropy decays of Ru-labeled HSA in the presence of various concentrations of anti HSA. For experimental details see Table 1.
FIG. 7.
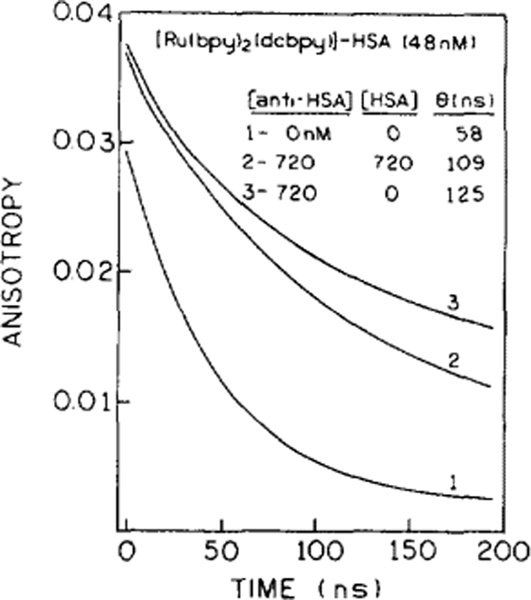
Time-dependent anisotropy decays of the Ru-labeled HSA (unbound) (1), after addition of anti HSA (3), and after addition of anti-HSA and unlabeled HSA (2). Excitation wavelength was 360 nm and observation was 660 nm with a bandpass of 10 nm at 20°C.
The time-resolved anisotropy data also confirm the results of the competitive immunoassay. Figure 7 shows the anisotropy decays of Ru-HSA, without Ab (1), in presence of a 15-fold molar excess of Ab (2) and on addition of 720 nM HSA, partially replacing Ru-HSA and thus reducing the correlation time from 125 to 109 ns. These data demonstrate the sensitivity of the Ru label to changes in rotational motions which occur with formation of larger macromolecular associations.
A large number of reports have questioned the mechanism of depolarization in the Ru-ligand complexes, which could be due in part to exchange of the excited state energy among the ligands (18). This latter process would not depend on rotational motion of the protein. Hence, we questioned whether the steady-state anisotropy reflected the rate of rotational motion. We used the time-resolved anisotropy decays to predict the steady-state anisotropy. The calculated polarization values for this Ab/Ag system, based on the measured values for lifetime (τ) and the rotational correlation time (θ) for different Ab concentrations, are given in Table 1. Apparently these values are higher than those measured with steady-state excitation. The calculated polarization values are not corrected for local motions of the fluorophores, caused by the free rotation of the probe molecules attached to the protein, which evidently lower the steady-state polarization. These local motions may not be quantified in the present time-resolved anisotropy data. Alternatively, the Ru-ligand complex may display some internal mechanisms of depolarization.
For our HSA/anti-HSA system the molecular weights of the tracer antigen and that of the final Ab:Ag complex (assuming a 2:1 molecular ratio of Ag to Ab) were 65,000 and 280,000, respectively. Based on the assumptions used for the calculations in Fig. 1, these Mrs should yield theoretical polarization values of 0.049 (Ag) and 0.143 (Ab/Ag) for a 400-ns lifetime probe. The measured values are somewhat smaller, again suggesting local motions. More detailed time-resolved measurements are needed to clarify this point.
Finally we examined the photostability of the Ru complex. An aqueous solution of [Ru(bpy)2(dcbpy)] was left exposed to the room light for close to 1 year, with no detectable changes in the absorption and emission spectra. Under comparable conditions fluorophores such as fluorescein and cyanines lose their characteristic spectra in several days. In other studies we have demonstrated that a similar Ru complex was stable to autoclaving (19). This stability test suggested that the Ru complex will be adequately stable for use in clinical assays.
DISCUSSION
The results described above demonstrate the possibility of fluorescence polarization immunoassay of high-molecular-weight antigens. What other methods are available to circumvent the present limitation of FPI to low-molecular-weight substances. An early attempt to develop FPI for higher-molecular-weight antigens was reported by Grossman (20). The dansyl (dimethylaminonaphthalene sulfonic acid) fluorophore was used because of its lifetime near 20 ns. However, even this spectrum was too short, and the dansyl probe has the additional disadvantages of requiring ultraviolet excitation. Tsuruoka et al. attempted to develop a FPI from IgG by increasing the molecular weight of the antibody (21). This was accomplished by immobilizing the antibody with latex or silver colloids. While the authors did obtain some improvements, the assay still used fluorescein as the probe, and its lifetime near 4 ns is already too short for such larger molecules. Urios and Cittanova (22) decreased the size of the labeled antibody by using Fab fragments in place of complete IgG molecules. However, the size of Fab fragment results in a rotational correlation time near 40 ns, which is also too long for use with fluorescein-type probes. These authors used lucifer yellow as a probe (22), but did not report the decay time. Another approach to enable the measurement of high molecular antigens was introduced by Wei and Herron (23). They used a tetramethylrhodamine-labeled synthetic peptide, which has a high binding affinity to the Ab of hCG (human chorionic gonadotrophin) as the tracer antigen in their FPI for hCG. In the assay the tracer antigen, which has a low molecular weight, is replaced by hCG (high molecular weight) thus reducing the amount of polarization.
In our opinion a superior approach for direct measurement of high-molecular-weight analytes by FPI is to increase the lifetime of the fluorescent probes to be comparable with the rotational correlation times of the antibody and antigen. The use of the Ru complex as probe molecule for antigens can be regarded as the first attempt of a direct measurement of high-molecular-weight analytes with a FPI based on metal-ligand complexes. As discussed earlier the sensitivity of a given probe for the polarization measurements can be correlated to the lifetime of the used probe and the hydrodynamic volumes (molecular weight) of the bound and free tracer antigen (see also Fig. 1). To observe comparable polarization values for a 400-ns probe like for a 4-ns probe, the molecular weight range for the tracer antigens can be at least 2 orders of magnitude higher than for commonly used short-lived fluorophores.
One disadvantage of the Ru complex is its smaller extinction coefficient and quantum yield when compared to a probe like fluorescein. For the long wavelength absorption band of fluorescein and [Ru(bpy)2dcbpy], the extinction coefficients are 65,000 (24) and 14,500 M−1 cm−1 (14). The quantum yields of fluorescein and [Ru(bpy)2dcbpy] are about 0.9 and 0.05, respectively. Hence, the signal from the Ru complex is expected to be 80-fold smaller than that for fluorescein. However, this disadvantage can be offset by the high photostability of the Ru complex, as fluorescein is poorly photostable. Also, the long lifetime of the Ru complex allows off-gating of the prompt autofluorescence, which is not possible with fluorescein, and it is this undesired background which often limits the sensitivity. And finally, we expect to develop improved metal-ligand probes with higher quantum yields.
In summary, the use of metal-ligand complexes for FPI is in its infancy. This versatile class of compounds appears to offer a variety of new opportunities for fluorescence polarization immunoassay of high-molecular-weight antigens. It seems probable that future studies will reveal other structures with even more favorable fluorescence spectral properties and higher initial anisotropy values.
ACKNOWLEDGMENTS
This work was supported by a grant from the National Institutes of Health (RR-08119), with support for instrumentation from the NIH (RR-07510-01) and the National Science Foundation (DIR-8710401). J.R.L. also expresses appreciation for support from the Medical Biotechnology Center at the University of Maryland.
Footnotes
Abbreviations used: Ab, antibody; Ag, antigen; bpy, 2,2’-bipyridine; dcbpy, 4,4’-dicarboxyl-2,2’-bipyridine; FPI, fluorescence polarization immunoassay; hCG, human chorionic gonadotrophin; HSA, human serum albumin; IgG, immunoglobin G, human; NHS, N-hydroxysuccinimide; TCSPC, time-correlated single photon counting.
REFERENCES
- 1.Schulman SG (Ed.) (1985) Molecular Luminescence Spectroscopy. 1. Methods and Applications, Wiley, New York. [Google Scholar]
- 2.Ichinose N, Schwedt G, Schnepel FM, and Adachi K (Eds.) (1987) Fluorometric Analysis in Biomedical Chemistry, Wiley, New York. [Google Scholar]
- 3.Wolfbeis OS (Ed.) (1993) Proceedings of the 1st European Conference on Optical Chemistry. Sensors and Biosensors, EUROPT(R)ODE 1, Graz, Austria, April 12–15, 1992, Sensors and Actuators B: Chemical, Vol. Bll, Elsevier Sequoia. [Google Scholar]
- 4.Van Dyke K, and Van Dyke R (Eds.) (1990) Luminescence Immunoassay and Molecular Applications, CRC Press, Boca Raton, FL. [Google Scholar]
- 5.Ozinskas AJ (1994) in Topics in Fluorescence Spectroscopy: Probe Design and Chemical Sensing (Lakowicz JR, Ed.), Vol. 4, pp. 449–496, Plenum, New York. [Google Scholar]
- 6.Karnes HT, O’Neal JS, and Schulman SG (1985) in Molecular Luminescence Spectroscopy. 1. Methods and Applications (Schulman SG, Ed.), pp. 717–779, Wiley, New York. [Google Scholar]
- 7.Levison SA (1975) in Biochemical Fluorescence: Concepts (Chen RF, and Edelhoch H, Eds.), Vol. 1, pp. 375–408, Dekker, New York. [Google Scholar]
- 8.Spencer RD, Toledo FB, Williams BT, and Yoss NL (1973) Clin. Chem. 19, 838–844. [PubMed] [Google Scholar]
- 9.Haber E, and Bennett JC (1962) Proc. Natl. Acad. Sci. USA 48, 1935–1942. [DOI] [PMC free article] [PubMed] [Google Scholar]
- 10.Levison SA, Dandiker WB, and Murayama D (1977) Environ. Sci. Technol. 11, 292–297. [Google Scholar]
- 11.Stroupe SD (1981) Clin. Chem. 27,1093. [PubMed] [Google Scholar]
- 12.Weber G (1966) in Fluorescence and Phosphorescence Analysis Principles and Applications (Hercules DM, Ed.), pp. 217–240. Interscience, New York. [Google Scholar]
- 13.Lakowicz JR (1983) Principles of Fluorescence Spectroscopy, Plenum, New York. [Google Scholar]
- 14.Terpetschnig E, Szmacinski H, Malak H, and Lakowicz JR (1995) Biophys. J. 68, 342–350. [DOI] [PMC free article] [PubMed] [Google Scholar]
- 15.Birch DJS, and Imhof RE (1991) in Topics in Fluorescence Spectroscopy: Principles (Lakowicz JR, Ed.), Vol. 1, pp. 1–95, Plenum, New York. [Google Scholar]
- 16.Yersin H, and Braun D (1991) Coord. Chem. Rev. 111,39–46. [Google Scholar]
- 17.McClanahan SF, Dallinger RF, Holler FJ, and Kincaid JR (1985) J. Am. Chem. Soc. 107, 4853–4860. [Google Scholar]
- 18.Blakley RL, Myrick ML, and DeArmond MK (1988) Inorg. Chem. 27, 589–590. [Google Scholar]
- 19.Bambot SB, Holavanahali R, Lakowicz JR, Carter GM, and Rao G (1994) Biotechnol. Bioengr. 43, 1139–1145. [DOI] [PubMed] [Google Scholar]
- 20.Grossman SH (1984) J. Clin. Immunoassay 7(1), 96–100. [Google Scholar]
- 21.Tsuruoka M, Tamiya E, and Karube I (1991) Biosens. Bioelectron. 6,501–505. [DOI] [PubMed] [Google Scholar]
- 22.Urios P, and Cittanova N (1990) Anal. Biochem. 185,308–312. [DOI] [PubMed] [Google Scholar]
- 23.Wei AP, and Herron JN (1993) Anal. Chem. 65, 3372–3377. [DOI] [PubMed] [Google Scholar]
- 24.Probes Molecular, Handbook of Fluorescent Probes and Research Chemicals, 1992–1994. [Google Scholar]


