Abstract
Background
The aim of this study was to evaluate the differently expressed genes (DEGs) relevant to type 2 diabetes mellitus (T2DM) and pathway by performing integrated bioinformatics analysis.
Material/Methods
The gene expression datasets GSE7014 and GSE29221 were downloaded in GEO database, and DEGs from type 2 diabetes mellitus and normal skeletal muscle tissues were identified. Biological function analysis of the DEGs was enriched by GO and KEEG pathway. A PPI network for the identified DEGs was built using the STRING database.
Results
Thirty top DEGs were identified from 2 datasets: GSE7014 and GSE29221. Of the 30 top DEGs, 20 were up-regulated and 10 were down-regulated. The 20 up-regulated genes were enriched in regulation of mRNA, protein biding, and phospholipase D signaling pathway. The 10 down-regulated genes were enriched in telomere maintenance via semi-conservative replication, AGE-RAGE signaling pathway in diabetic complications, and insulin resistance pathway. In the PPI network of 20 up-regulated DEGs, there were 40 nodes and 84 edges, with an average node degree of 4.2. For the 10 down-regulated DEGs, we found a total of 30 nodes and 105 edges, with an average node degree of 7.0 and local clustering coefficient of 0.812. Among the 30 DEGs, 10 hub genes (CNOT6L, CNOT6, CNOT1, CNOT7, RQCD1, RFC2, PRIM1, RFC4, RFC5, and RFC1) were also identified through Cytoscape.
Conclusions
DEGs of T2DM may play an essential role in disease development and may be potential pathogeneses of T2DM.
MeSH Keywords: Diabetes Mellitus, Type 2; Genes, vif; Local Area Networks
Background
Skeletal muscle is key metabolic tissue of the human body and accounts for most glucose absorption and utilization [1]. Skeletal muscle is essential for the balance of glucose metabolism [2,3]. Insulin resistance of skeletal muscle is an important factor in T2DM. Therefore, identification of DEGs of skeletal muscle tissue expressed differently between patients with T2DM and healthy controls can provide essential information on the pathogenesis of T2DM [4]. In recent years, with the development and application of gene chip technology, a large amount of gene expression profile data has been generated [5,6]. How to extract valuable information from these data sets has become an important bioinformatics research topic. In the present work, the differently expressed genes (DEGs) relevant to T2DM and pathway were analyzed through integrated bioinformatics analysis to elucidate the pathogenesis of T2DM.
Material and Methods
DEGs identification form datasets GSE7014 and GSE29221
The gene expression profile datasets GSE7014 [7] and GSE29221 [8] were downloaded from the GEO database, and DEGs from T2DM and normal skeletal muscle samples were identified. The included 2 datasets were tissue samples from human skeletal muscle of T2MD patients versus healthy subjects. For the GSE7014 dataset, gene expression of a total of 26 skeletal muscle samples, including 20 samples from T2DM patients and 6 healthy subjects were analyzed using the GPL570 [HG-U133_Plus_2] Affymetrix Human Genome U133 Plus 2.0 Array. For the GSE29221 dataset, gene expression of 24 samples, including 12 skeletal muscle samples of T2MD and 12 normal skeletal muscle samples were analyzed using GPL6947 Illumina Human HT-12 V3.0 expression bead chips. The differently expressed genes of the 2 datasets (GSE7014 and GSE29221) were first screened independently with the restriction of FC>5 and p<0.01, then the differently expressed genes of GSE7014 and GSE29221 were merged to identify the overlapping DEGs.
Functional and pathway analysis of the DEGs
The biological function and pathway were analyzed by GO and KEGG enrichment. GO enrichment includes 3 aspects: biological process, cellular component, and molecular function. The enrichment of GO and KEGG was expressed with a bubble plot showing the gene ratio, gene count, gene function description, and p value.
PPI and hub genes identification
We used the STRING database in the construction of the PPI network for the 30 identified DEGs with the restriction of a minimum required interaction score of 0.4. The PPI network active interaction sources were identified from text mining, experiments, databases, co-expression, neighborhood, gene fusion, and co-recurrence. Hub genes of the 30 DEGs were identified by Cytohubba ranking method.
Results
DEGs identification
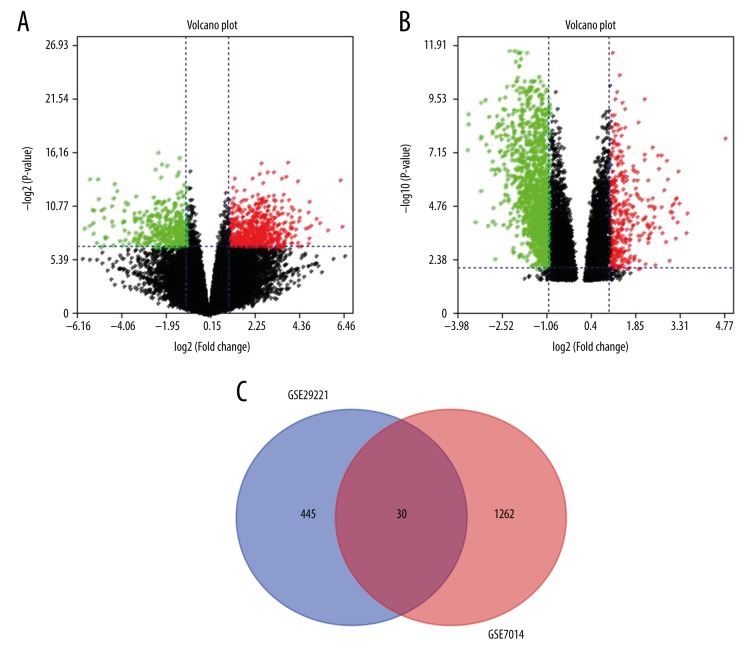
We used 2 data sets (GSE7014 and GSE29221) for bioinformatics analysis. In GSE7014, there were a total of 26 skeletal muscle samples, including 20 samples from T2DM patients and 6 normal samples. In GSE29221, there were 24 samples, including 12 skeletal muscle tissues of T2DM patients and 12 normal skeletal muscle samples. The DEGs were initially screened independently from GSE7014 and GSE29221 with the restriction of FC >5 and p<0.01. We identified 30 DEGs from 2 datasets (GSE 7014 and GSE29221) (Figure 1). Of the 30 top DEGs, 20 were up-regulated (Table 1) and 10 were down-regulated (Table 2). The 30 top DEGs identified from T2DM samples and normal skeletal muscle samples through GSE 7014 and GSE29221 are represented by a heat map in Figure 2.
Figure 1.
(A–C) Identification of DEGs in GSE29221 and GSE7014 data series (A: Volcano plot GSE29221 in identification DEGs; B: Volcano plot GSE7014 in identification DEGs; C: Venn plot in identification overlap DEGs of GSE29221 and GSE7014 data series).
Table 1.
| Gene symbol | Gene name | Fold change | P value |
|---|---|---|---|
| CNOT7 | CCR4-NOT transcription complex subunit 7 | 3.771885 | 3.63E-03 |
| IGFBPL1 | Insulin-like growth factor binding protein-like 1 | 3.767067 | 2.50E-05 |
| MAPT | Microtubule-associated protein tau | 3.557061 | 2.33E-04 |
| HILPDA | Hypoxia inducible lipid droplet-associated | 3.50515 | 8.78E-04 |
| TNKS2 | Tankyrase 2 | 3.383897 | 9.31E-04 |
| NIPSNAP3B | Nipsnap homolog 3B | 3.046473 | 6.37E-03 |
| CTU2 | Cytosolic thiouridylase subunit 2 | 2.931942 | 7.95E-03 |
| ANKH | Ankyrin repeat and KH domain containing 1 | 6.309422 | 2.13E-03 |
| TPM3 | Tropomyosin 3 | 2.873881 | 3.67E-03 |
| ARF6 | ADP ribosylation factor 6 | 2.81937 | 1.37E-03 |
| TNRC6B | trinucleotide repeat containing 6B | 2.791015 | 4.94E-05 |
| ZNF451 | Zinc finger protein 451 | 2.645071 | 1.04E-03 |
| N4BP2L1 | NEDD4 binding protein 2-like 1 | 2.604427 | 4.39E-03 |
| MALAT1 | Metastasis associated lung adenocarcinoma transcript 1 (non-protein coding) | 2.535709 | 7.52E-03 |
| HYAL2 | Hyaluronoglucosaminidase 2 | 2.444833 | 3.36E-03 |
| UACA | Uveal autoantigen with coiled-coil domains and ankyrin repeats | 2.436325 | 8.59E-03 |
| CCDC85B | Coiled-coil domain containing 85B | 2.369664 | 7.11E-03 |
| TEAD3 | TEA domain transcription factor 3 | 2.292119 | 1.74E-03 |
| CREB3 | cAMP responsive element binding protein 3 | 2.243004 | 8.84E-04 |
| EPHX1 | Epoxide hydrolase 1 | 2.213641 | 4.26E-03 |
Table 2.
| Gene symbol | Gene name | Fold change | P value |
|---|---|---|---|
| LTF | Lactotransferrin | −2.2336 | 2.15E-03 |
| ZDHHC9 | Zinc finger DHHC-type containing 9 | −2.36458 | 9.97E-03 |
| PLXNC1 | Plexin C1 | −2.44666 | 1.10E-03 |
| RFC2 | Replication factor C subunit 2 | −2.55141 | 2.48E-03 |
| IL6R | Interleukin 6 receptor | −2.59581 | 2.74E-04 |
| BRD4 | Bromodomain containing 4 | −2.83271 | 4.88E-03 |
| WNK1 | WNK lysine deficient protein kinase 1 | −2.93786 | 6.86E-03 |
| SCAI | Suppressor of cancer cell invasion | −3.95926 | 5.49E-03 |
| NR4A2 | Nuclear receptor subfamily 4 group A member 2 | −4.06962 | 1.55E-03 |
| FECH | Ferrochelatase | −5.19389 | 3.18E-04 |
Figure 2.
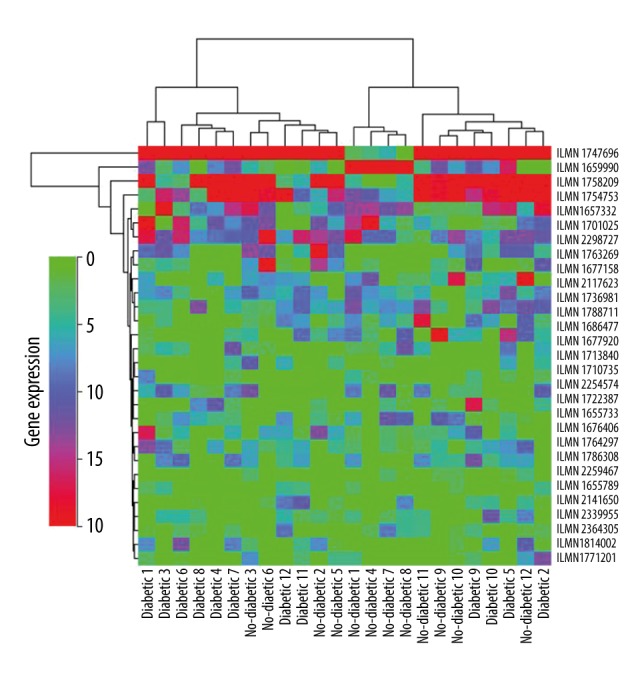
Heat map of the 30 DEGs (data originally from GSE29221).
GO and KEGG enrichment of the 30 DEGs
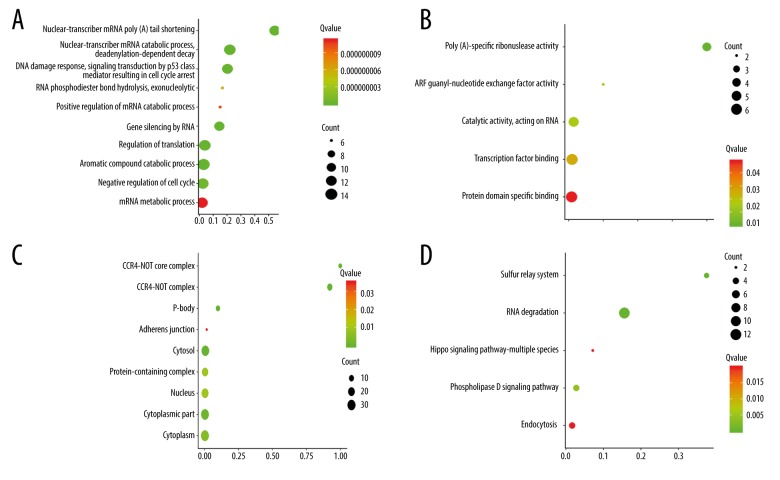
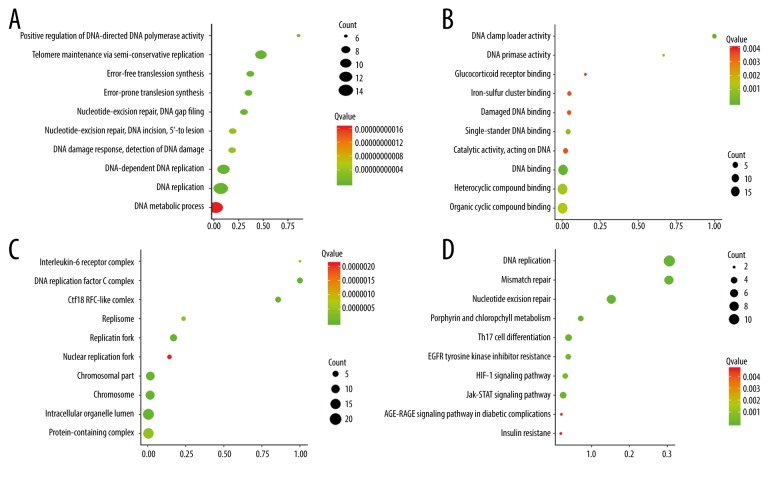
Genes ontology biological functional evaluation indicated that the 20 up-regulated genes were mainly enriched in regulation of mRNA process for biological process, protein biding related to molecular function, and cytosol for cellular component (Figure 3A–3C). For KEGG pathway evaluation, the 20 up-regulated genes were mainly enriched in RNA degradation and phospholipase D signaling pathway (Figure 3D). For the 10 down-regulated genes, GO was mainly enriched in telomere maintenance via semi-conservative replication, DNA binding, and DNA replication factor C complex (Figure 4A–4C). For KEGG evaluation, the 10 down-regulated genes were mainly enriched in AGE-RAGE signaling pathway in diabetic complications and insulin resistance (Figure 4D).
Figure 3.
(A–D) Bubble plot of Go term and KEGG enrichment of the 20 up-regulated DEGs. (A: Biology process enrichment of the 20 up-regulated DEGs; B: Molecular function enrichment of the 20 up-regulated DEGs; C: Cellular component enrichment of the 20 up-regulated DEGs; D: KEGG pathway enrichment of the 20 up-regulated DEGs).
Figure 4.
(A–D) Bubble plot of Go term and KEGG enrichment of the 10 down-regulated DEGs. (A: Biology process enrichment of the 10 down-regulated DEGs; B: Molecular function enrichment of the 10 down-regulated DEGs; C: Cellular component enrichment of the 10 down-regulated DEGs; D: KEGG pathway enrichment of the 10 down-regulated DEGs).
PPI hub genes identification
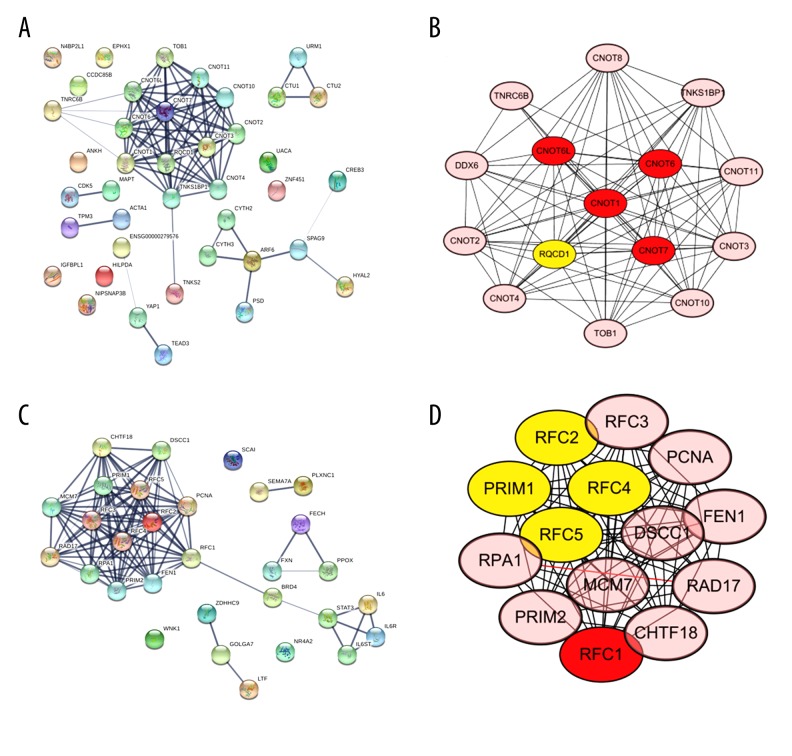
A PPI network for the DEGs was constructed using STRING (Figure 5A). In the PPI network of 20 up-regulated DEGs, there were 40 nodes and 84 edges, with an average node degree of 4.2 and local clustering coefficient of 0.684, which indicated statistically significant PPI enrichment (p<0.001). For the 10 down-regulated DEGs, there were 30 nodes and 105 edges, with an average node degree of 7.0 and local clustering coefficient of 0.812, which also demonstrated significant PPI enrichment (p<0.001) (Figure 5C). Ten hub genes (CNOT6L, CNOT6, CNOT1, CNOT7, RQCD1, RFC2, PRIM1, RFC4, RFC5, and RFC1) were also identified through Cytoscape (Figure 5B, 5D).
Figure 5.
(A–D) PPI network and hub genes identification of the DEGs (A: PPI network of the 20 up-regulated DEGs; B: 5 hub genes identified for the 20 up-regulated DEGs by Cytoscape; C: PPI network of the 10 down-regulated DEGs; D: 5 hub genes identified of the 10 down-regulated DEGs by Cytoscape).
Discussion
Type 2 diabetes (T2DM) is a metabolic disorder characterized by impaired glucose uptake in muscle and fat, altered glucose-induced insulin secretion, and increased hepatic glucose production, which lead to hyperglycemia [9–11]. There are now about 410 million people with T2DM globally, and this number is projected to increase to over 640 million by the year 2040 [12]. T2DM has become a heavy burden around the world [13,14].
Studies have demonstrated that the development of T2DM is a result of multi-gene interaction [15–17]. The extensive application of gene expression profiles in diabetes mellitus raises the possibility of evaluating the pathogenesis of T2DM using bioinformatics analysis.
In this work, we identified 30 DEGs (20 up-regulated and 10 down-regulated genes) from 2 datasets: GSE7014 and GSE29221. The 30 DEGs were generally enriched in the aspects of mRNA regulation, protein biding and phospholipase D signaling pathway, telomere maintenance via semi-conservative replication, AGE-RAGE signaling pathway in diabetic complications, and insulin resistance pathway. Ten hub genes (CNOT1, CNOT6, CNOT6L, CONT7, RQCD1, RFC1, RFC2, RFC2, RFC4, and RFC5) were screened according to the PPI network constructed in Cytoscape. CNOT has a scaffolding component essential for mRNA degradation [18], but its correlation with T2DM has not been previously reported. Only 1 study, by Franco [19], demonstrated that CNOT1 de novo missense mutation can result in a syndrome of pancreatic agenesis in mice. According to Franco [19] and our findings, CNOT1 may be a potential target for T2DM treatment. RFC is a replication factor C subunit that binds to the primer-template junction, PO-B transcription element, and other GA-rich DNA sequences [20]. RFC plays a role in DNA transcription regulation and in DNA replication and/or repair [21,22], but its correlation with T2DM had not been reported previously. The present study if the first to report that RFC is correlated with T2DM development, but our findings need to be confirmed by in vitro and in vivo experiments.
Conclusions
DEGs in skeletal muscle between T2DM patients and healthy controls can be identified through integrated bioinformatics analysis. New genes that were not found to be correlated with T2DM can also be identified and may provide new information about T2MD development and help develop better treatments.
Footnotes
Source of support: Departmental sources
Conflict of interest
None.
References
- 1.Nagatomo F, Takemura A, Roy RR, et al. Mild hyperbaric oxygen inhibits the growth-related decline in skeletal muscle oxidative capacity and prevents hyperglycemia in rats with type 2 diabetes mellitus. J Diabetes. 2018;10:753–63. doi: 10.1111/1753-0407.12666. [DOI] [PubMed] [Google Scholar]
- 2.Luo T, Yang Y, Xu Y, et al. Dietary methionine restriction improves glucose metabolism in the skeletal muscle of obese mice. Food Funct. 2019;10:2676–90. doi: 10.1039/c8fo02571a. [DOI] [PubMed] [Google Scholar]
- 3.Sweeney EL, Jeromson S, Hamilton DL, et al. Skeletal muscle insulin signaling and whole-body glucose metabolism following acute sleep restriction in healthy males. Physiol Rep. 2017;5 doi: 10.14814/phy2.13498. [DOI] [PMC free article] [PubMed] [Google Scholar]
- 4.Hou D, Ma Y, Wang B, et al. Selective impairment of attentional networks of executive control in middle-aged subjects with type 2 diabetes mellitus. Med Sci Monit. 2018;24:5355–62. doi: 10.12659/MSM.909142. [DOI] [PMC free article] [PubMed] [Google Scholar]
- 5.Hu S, Liao Y, Chen L. Identification of key pathways and genes in anaplastic thyroid carcinoma via integrated bioinformatics analysis. Med Sci Monit. 2018;24:6438–48. doi: 10.12659/MSM.910088. [DOI] [PMC free article] [PubMed] [Google Scholar]
- 6.Zhu F, Huang R, Li J, et al. Identification of key genes and pathways associated with RUNX1 mutations in acute myeloid leukemia using bioinformatics analysis. Med Sci Monit. 2018;24:7100–8. doi: 10.12659/MSM910916. [DOI] [PMC free article] [PubMed] [Google Scholar]
- 7.Vihola A, Bachinski LL, Sirito M, et al. Differences in aberrant expression and splicing of sarcomeric proteins in the myotonic dystrophies DM1 and DM2. Acta Neuropathol. 2010;119:465–79. doi: 10.1007/s00401-010-0637-6. [DOI] [PMC free article] [PubMed] [Google Scholar]
- 8.Jain P, Vig S, Datta M, et al. Systems biology approach reveals genome to phenome correlation in type 2 diabetes. PLoS One. 2013;8:e53522. doi: 10.1371/journal.pone.0053522. [DOI] [PMC free article] [PubMed] [Google Scholar]
- 9.Nolen-Doerr E, Stockman MC, Rizo I. Mechanism of glucagon-like peptide 1 improvements in type 2 diabetes mellitus and obesity. Curr Obes Rep. 2019;8(3):284–91. doi: 10.1007/s13679-019-00350-4. [DOI] [PubMed] [Google Scholar]
- 10.Qin H, Chen H, Zou Y, et al. Systematic investigation of the mechanism of Cichorium glandulosum on type 2 diabetes mellitus accompanied with non-alcoholic fatty liver rats. Food Funct. 2019;10:2450–60. doi: 10.1039/c8fo02284d. [DOI] [PubMed] [Google Scholar]
- 11.Lyra ESNM, Lam MP, Soares CN, et al. Insulin resistance as a shared pathogenic mechanism between depression and type 2 diabetes. Front Psychiatry. 2019;10:57. doi: 10.3389/fpsyt.2019.00057. [DOI] [PMC free article] [PubMed] [Google Scholar]
- 12.Zheng Y, Ley SH, Hu FB. Global aetiology and epidemiology of type 2 diabetes mellitus and its complications. Nat Rev Endocrinol. 2018;14:88–98. doi: 10.1038/nrendo.2017.151. [DOI] [PubMed] [Google Scholar]
- 13.Jehan S, Myers AK, Zizi F, et al. Obesity, obstructive sleep apnea and type 2 diabetes mellitus: Epidemiology and pathophysiologic insights. Sleep Med Disord. 2018;2:52–58. [PMC free article] [PubMed] [Google Scholar]
- 14.Hills AP, Arena R, Khunti K, et al. Epidemiology and determinants of type 2 diabetes in south Asia. Lancet Diabetes Endocrinol. 2018;6:966–78. doi: 10.1016/S2213-8587(18)30204-3. [DOI] [PubMed] [Google Scholar]
- 15.Mao YQ, Liu JF, Han B, Wang LS. Longevity-associated Forkhead Box O3 (FOXO3) single nucleotide polymorphisms are associated with type 2 diabetes mellitus in Chinese elderly women. Med Sci Monit. 2019;25:2966–75. doi: 10.12659/MSM.913788. [DOI] [PMC free article] [PubMed] [Google Scholar]
- 16.Sun W, Liu J, Wu L, et al. [Transcriptome analysis of the effects of Moringa Oleifera leaf extract in db/db mice with type 2 diabetes mellitus]. Int J Clin Exp Med. 2019;12(6):6643–58. [in Chinese] [Google Scholar]
- 17.Wang T, Zhang Q, Liu M, et al. [suPAR as a marker of diabetic nephropathy in patients with type 2 diabetes]. Int J Clin Exp Med. 2019;12(4):4218–25. [in Chinese] [Google Scholar]
- 18.Xu K, Bai Y, Zhang A, et al. Insights into the structure and architecture of the CCR4-NOT complex. Front Genet. 2014;5:137. doi: 10.3389/fgene.2014.00137. [DOI] [PMC free article] [PubMed] [Google Scholar]
- 19.De Franco E, Watson RA, Weninger WJ, et al. A specific CNOT1 mutation results in a novel syndrome of pancreatic agenesis and holoprosencephaly through impaired pancreatic and neurological development. Am J Hum Genet. 2019;104:985–89. doi: 10.1016/j.ajhg.2019.03.018. [DOI] [PMC free article] [PubMed] [Google Scholar]
- 20.Marzahn MR, Bloom LB. Improved solubility of replication factor C (RFC) Walker A mutants. Protein Expr Purif. 2012;83:135–44. doi: 10.1016/j.pep.2012.03.010. [DOI] [PMC free article] [PubMed] [Google Scholar]
- 21.Hedglin M, Kumar R, Benkovic SJ. Replication clamps and clamp loaders. Cold Spring Harb Perspect Biol. 2013;5:a010165. doi: 10.1101/cshperspect.a010165. [DOI] [PMC free article] [PubMed] [Google Scholar]
- 22.Yao NY, O’Donnell M. The RFC clamp loader: Structure and function. Subcell Biochem. 2012;62:259–79. doi: 10.1007/978-94-007-4572-8_14. [DOI] [PMC free article] [PubMed] [Google Scholar]


