Abstract
Background
Oral squamous cell carcinoma (OSCC), one of the most common cavity-associated cancers, has a high incidence and worldwide mortality. However, the cause and underlying molecular mechanisms of OSCC remain unclear.
Material/Methods
Three microarray datasets (GSE23558, GSE34105, and GSE74530) from the Gene Expression Omnibus (GEO) database were downloaded and then integrated to gain differentially expressed genes (DEGs). We performed Gene Ontology (GO) analysis and Kyoto Encyclopedia of Genes and Genomes (KEGG) pathway enrichments of DEGs in order to elucidate DEGs’ biological roles. Protein-protein interaction (PPI) networks were established in order to identify hub genes. To validate the gene markers for OSCC, the data of TCGA OSCC were also assessed.
Results
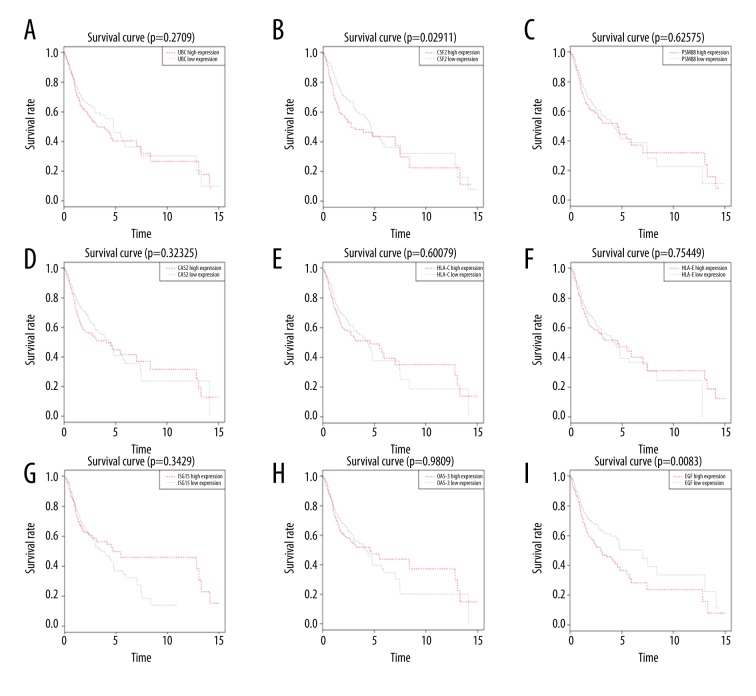
Together, 651 DEGs containing 288 upregulated genes and 363 downregulated genes were screened out, which could completely distinguish between OSCC and normal control tissues by principal component analysis (PCA). The GO analysis indicated the DEGs were enriched in chemokine activity in the biological process group. The molecular functions of DEGs included growth factor activity. The molecular functions included oxidoreductase activity. The main DEG-associated cellular components included extracellular exosome. The KEGG pathway analysis indicated the DEGs were mainly participated in the cytokine-cytokine receptor interaction, metabolism of xenobiotics by cytochrome P450 and glutathione metabolism signal pathway. The co-expression network identified core genes from the PPI network. Additionally, Kaplan-Meier survival analysis showed that CSF2 and EGF genes were significantly correlated with OSCC patients’ overall survival.
Conclusions
Our study using an integrated bioinformatics analysis might provide valuable information for exploring potential new molecular biomarkers and therapeutic targets for OSCC.
MeSH Keywords: Biological Markers; Efferent Pathways; Genes, vif
Background
Oral cancers, including oral cavity and oropharynx malignancy, are the ninth most common global malignancy which have an incidence of > 300 000 each year [1]. Approximately more than 90% of these oral cancers are oral squamous cell carcinomas (OSCC) [2]. It is estimated that 75% of oral cancers are related to lifestyle choices, and tobacco and alcohol abuse [1,3,4]. Although a range of diagnostic and therapeutic strategies have been used for treatment, there are still approximately over 145 000 oral cancer deaths annually globally [5]. Most published studies report that 5-year survival rate of OSCC is still around 50% [6–8].
With the development of molecular biological and pathological techniques, a variety of tumor markers are considered powerful tools for exploring diagnostic and predictive biomarkers, especially in the therapies targeting OSCC. Gene expression microarrays, efficient and large-scale techniques for gaining genetic data, have been widely performed to collect and to study gene expression profiling data in many human tumors. These microarray studies develop a new approach for identifying cancer-related genes and provide promising prospects for molecular prediction and therapeutic targets [9].
However, false-positive rates from each microarray analysis make it difficult to identify reliable results. Therefore, we downloaded 3 original microarray datasets, GSE23558, GSE34105, and GSE74530, from the NCBI-Gene Expression Omnibus (GEO) database, which contained a total of 122 samples, consisting of 95 tumor and 27 normal samples. Differentially expressed gene (DEG) investigation and functional and pathway enrichment studies in addition to protein-protein interaction network (PPI) analyses, were performed. We also validate the findings from The Cancer Gene Atlas (TCGA) datasets of OSCC. Our study should yield valuable genes for investigating the mechanisms underlying OSCC pathogenesis and provide candidate genes for identifying diagnostic and therapeutic OSCC targets.
Material and Methods
Microarray data
OSCC datasets in this study were downloaded from the GEO database (https://www.ncbi.nlm.nih.gov/gds/). The DEGs were considered by 3 independent OSCC datasets, involving GSE23558, GSE34105, and GSE74530, with 122 OSCC and 27 normal samples. The GSE23558 microarray data was based on the GPL6480 Platform (Agilent-014850 Whole Human Genome Microarray 4×44K G4112F), including 27 OSCC and 5 normal control samples. The GSE34105 dataset was based on the GPL14951 Platform (Illumina HumanHT-12 WG-DASL V4.0 R2 expression beadchip) and composed of 62 OSCC and 16 normal control samples. The platform for GSE74530 is GPL570, [HG-U133_Plus_2] Affymetrix Human Genome U133 Plus 2.0 Array, consisting of 6 OSCC and 6 adjacent normal samples. To validate the gene markers being a specific signature for OSCC, the mRNA expression data and clinical data of OSCC (403 samples) were also downloaded from TCGA database (https://portal.gdc.cancer.gov/repository). Gene symbols were annotated based on the Homo_sapiens.GRCh38.91.chr.gtf file (http://asia.ensembl.org/index.html). Log2 transformations were performed for all gene expression data. The average mRNA expression value was used when duplicate data were found.
Screening of DEGs
The Affy package of R language were used to normalize and convert the raw probelevel data to expression profiles [10,11]. The limma package of R language was used for DEGs between OSCC and normal control samples [12]. The P-value was adjusted by the Benjamini-Hochberg method [13]. An adjusted P-value <0.05 and |log2 fold change (FC) | >1 were considered as threshold values for DEGs identification. The volcano plot was performed using ggplot2 package, and the heat map was constructed using pheatmap package in R language [14].
Principal component analysis (PCA) of DEGs
Principal component analysis (PCA), a multivariate regression analysis, was used to confirm the differential functions of the DEGs for tumor samples and normal control samples [15,16]. A PCA graph was conducted using pca3d in R language. The 3-dimensional graph was then obtained, in which DEGs were considered as variables and the difference between tumor and normal control samples were observed.
Gene Ontology (GO) and pathway enrichment analyses of DEGs
Gene Ontology (GO) analysis is a common analysis for annotating genes and determining biological characteristics, including cellular component (CC), molecular function (MF), and biological process (BP) [17]. Kyoto Encyclopedia of Genes and Genomes (KEGG) pathway database is applied for classification by correlating gene sets into their respective pathways [18]. The Database for Annotation, Visualization and Integrated Discovery (DAVID, https://david.ncifcrf.gov/) is a gene functional classification tool that aims to provide a comprehensive set of functional annotation tools for authors to understand the biological meaning behind large lists of genes [19,20]. P<0.05 was identified statistically significant.
Protein-protein interaction (PPI) network analysis
The Search Tool for Interacting Genes/Proteins Retrieval (STRING; http://www.string-db.org/) database provides comprehensive coverage and access to experimental and predicted information concerning the interactions between known and predicted proteins [21]. In our study, only those experimentally validated interactions with a combined score >0.7 were selected as significant, and the maximum number of interactors=0 were set as the cutoff criterion. Hub proteins were identified as those interacted with most partners using the R language (version 3.5.1).
Analysis of the hub genes with TCGA data
We also attempted to validate the findings from the TCGA datasets of OSCC. A total of 403 OSCC samples were included containing 371 OSCC and 32 adjacent nontumor OSCC tissues. The expression level of each hub gene was extracted for further analysis from all included data. Student’s t-test was used for the statistical analyses of the hub genes between OSCC and adjacent nontumor OSCC tissues as described previously [22]. In the meantime, survival information was also achieved from the TCGA. Survival analysis was carried out through the Kaplan-Meier analysis and the logrank test was performed to evaluate the statistical significance of the differences.
Results
Identification of DEGs
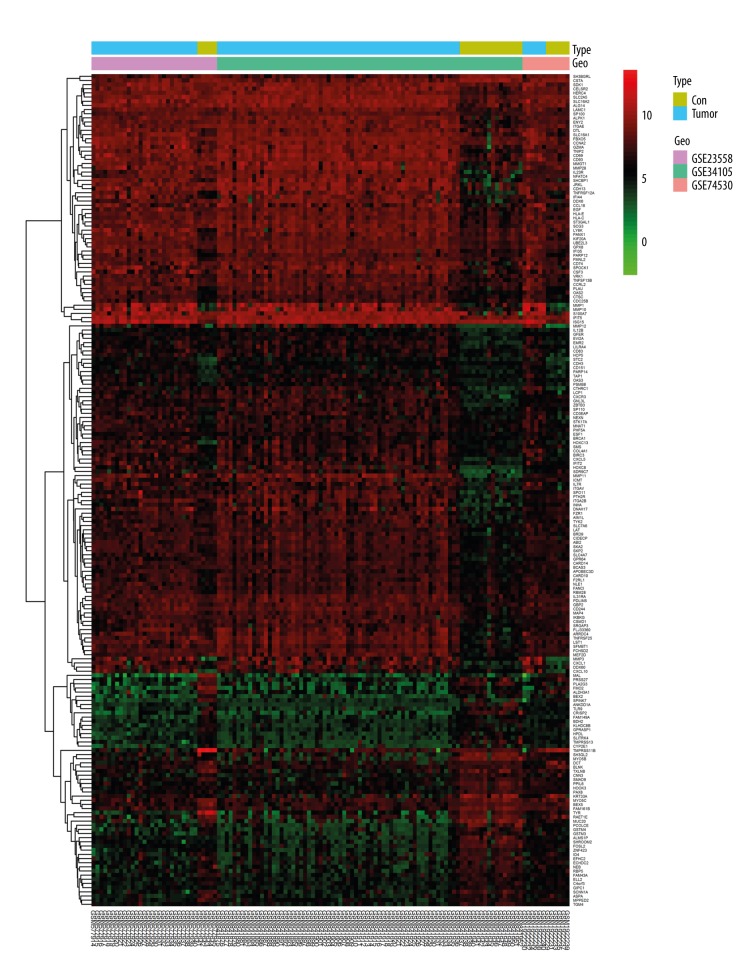
The gene expression profiles of GSE23558, GSE34105, and GSE74530 were gained from the GEO. When the 3 datasets were screened by the limma package, a total of 651 genes were considered to be differentially expressed in OSCC compared with the expression profiles from normal controls. Among these DEGs, 288 genes were upregulated, and 363 were downregulated. The cluster heatmap of the top 200 DEGs is seen in Figure 1. The volcano plot is shown in Figure 2.
Figure 1.
DEGs between the OSCC and control groups are shown in heatmap. DEGs – differentially expressed genes; OSCC – oral squamous cell carcinoma.
Figure 2.
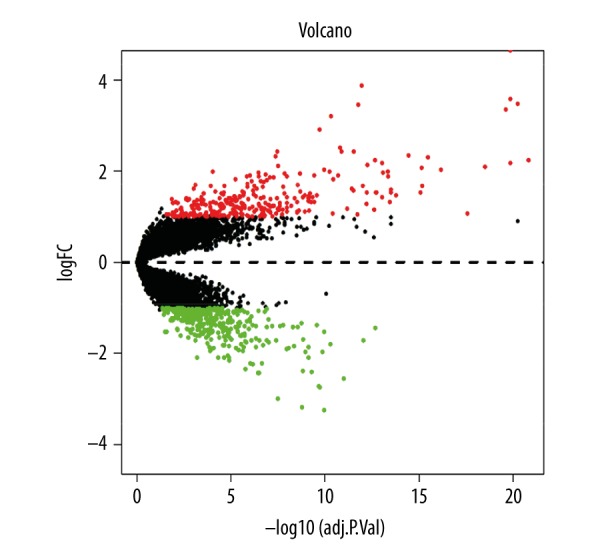
Volcano plots of DEGs between the OSCC and control groups. DEGs – differentially expressed genes; OSCC – oral squamous cell carcinoma.
PCA of DEGs
In order to examine overall gene expression pattern of OSCC and normal tissues, we performed a PCA analysis. As presented in Figure 3, OSCC and normal tissues were completely separated by the DEGs, indicating that DEG expression patterns were specific and could be used to completely distinguish between OSCC and normal tissues.
Figure 3.
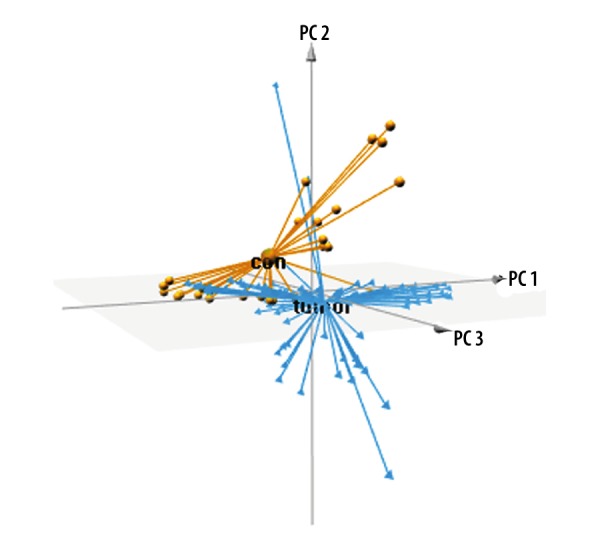
PCA of DEGs between the OSCC and control groups. PCA – principal component analysis; DEGs – differentially expressed genes. OSCC – oral squamous cell carcinoma.
GO and KEGG pathway analyses of DEGs
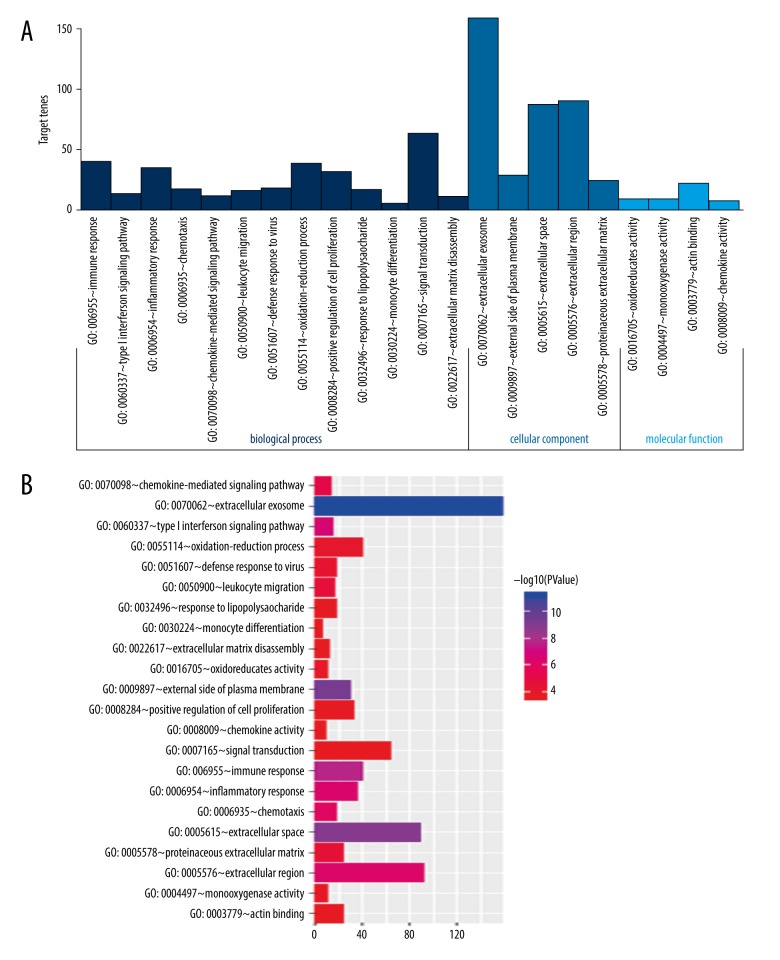
In order to obtain further insight into gene function, we performed significant DEG enrichment functions determined by the DAVID online analysis tool, and the GO functional enrichments of upregulated and downregulated genes with a P-value of 0.05 were selected. The GO analysis of DEGs was mainly classified into three functional groups: CC, MF, and BP (Figure 4). In the BP group, the GO term analysis indicated that the common DEGs were primarily enriched in functions such as chemokine activity, monocyte differentiation, signal transduction, and extracellular matrix disassembly. In the MF group, the enriched GO terms were primarily involved in oxidoreductase activity, monooxygenase activity, positive regulation of cell proliferation and response to lipopolysaccharide. In the CC group, the results of GO analysis were enriched in extracellular exosome, external side of plasma membrane, extracellular region and inflammatory response.
Figure 4.
GO term analysis of DEGs. (A) GO analysis divided DEGs into 3 functional groups: molecular function, biological processes, and cell composition. (B) GO enrichment significance items of DEGs in different functional groups. GO – Gene Ontology; DEGs – differentially expressed genes.
As demonstrated in Figure 5, the KEGG pathway analysis showed that cytokine-cytokine receptor interaction, metabolism of xenobiotics by cytochrome P450 and glutathione metabolism were the most significantly enriched pathways.
Figure 5.
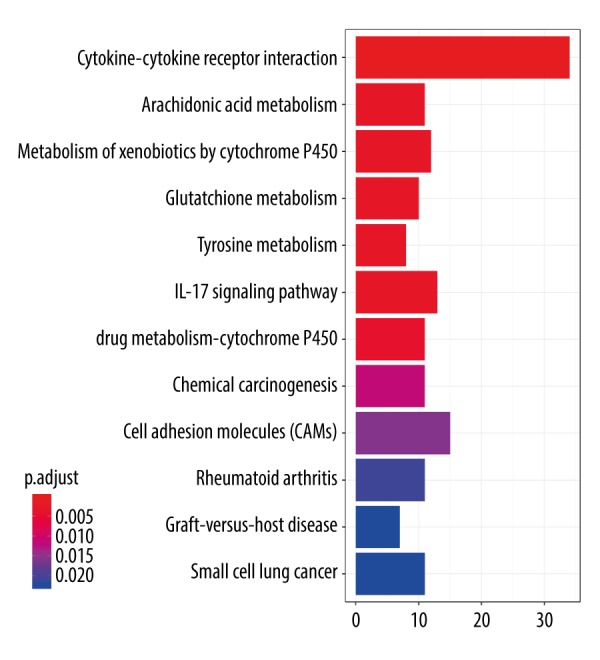
KEGG pathway enrichment analysis of DEGs. KEGG – Kyoto Encyclopedia of Genes and Genomes; DEGs – differentially expressed genes.
PPI network construction and modules selection
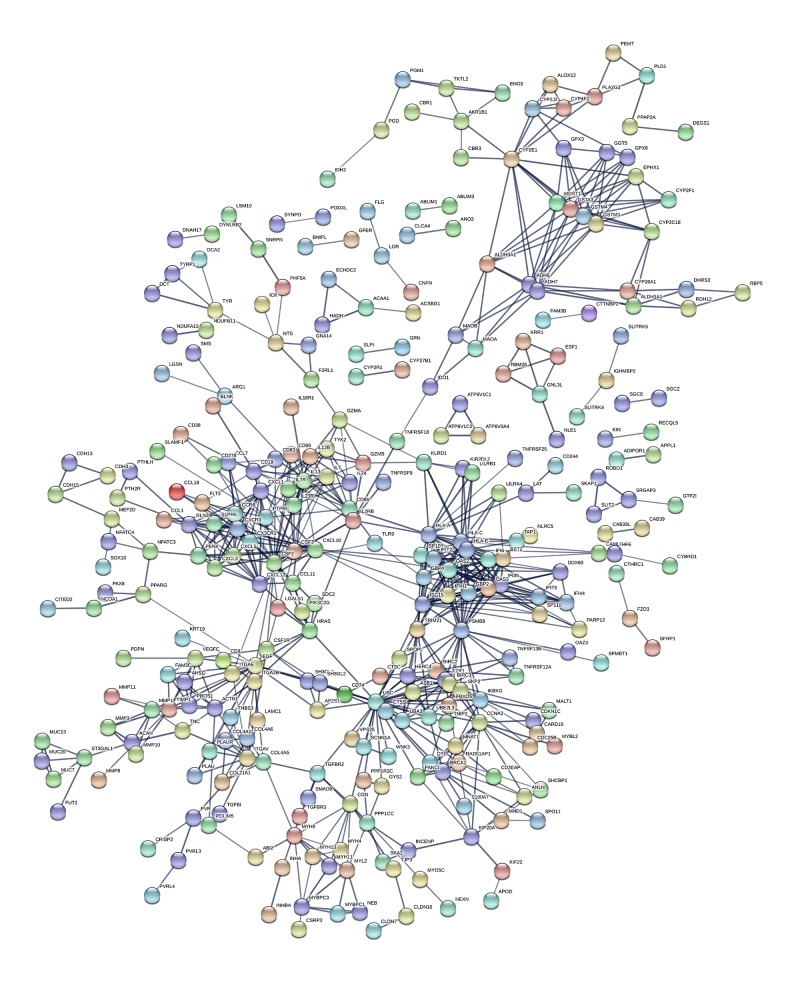
We constructed the 288-DEG expression products using the STRING database to construct PPI networks. After eliminating the isolated connected nodes, a total of 774 protein interactions were selected with combined score >0.7 and the PPI network was constructed for additional analysis (Figure 6). Genes with higher degrees of interaction were considered as hub genes. The top 30 hub genes in PPI network are listed in Figure 7. Results showed that the 10 most significant genes showing significant interactions were UBC (degree=33), CSF2 (degree=24), PSMB8 (degree=24), HLA-A (degree=23), OAS2 (degree=21), HLA-C (degree=20), HLA-E (degree=20), ISG15 (degree=19), OAS3 (degree=19) and EGF (degree=18) in this PPI network.
Figure 6.
PPI network. PPI – protein-protein interaction.
Figure 7.
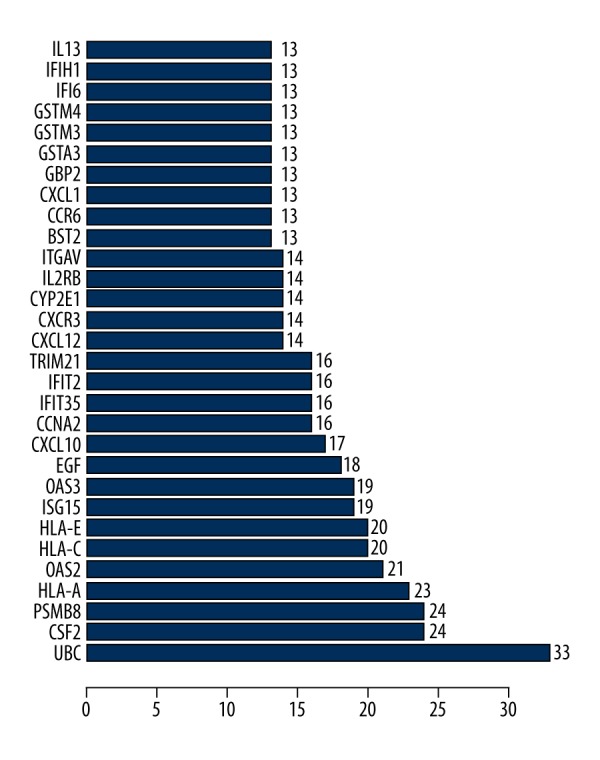
Potential hub genes with higher degrees of interaction.
Validation of the hub gene expression with TCGA data
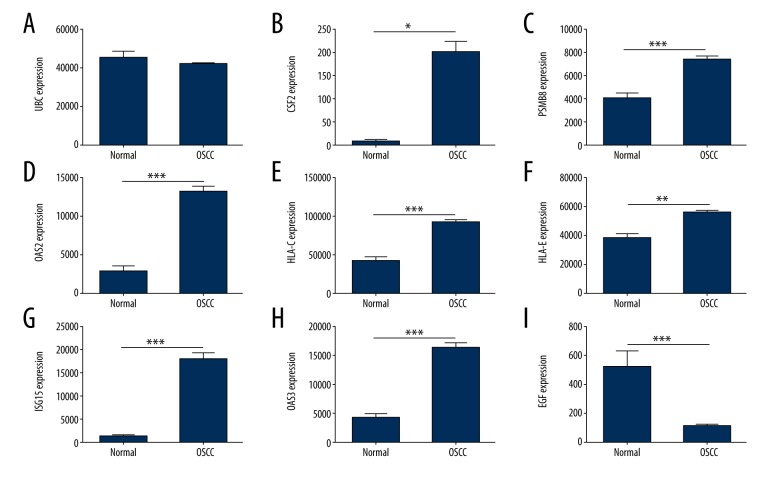
The expression of hub genes in the 371 OSCC and 32 adjacent non-tumor tissues were also investigated with TCGA OSCC data. According to the univariate and multivariate Cox regression analyses, we found age and stage could be used as poorer survival of OSCC patients (Figure 8). Nine genes could be screened out from TCGA OSCC data, including UBC, CSF2, PSMB8, OAS2, HLA-C, HLA-E, ISG15, OAS3, and EGF. In addition, the expressions levels of CSF2, PSMB8, OAS2, HLA-C, HLA-E, ISG15, OAS3, and EGF were found to be significant differences between OSCC and adjacent non-tumor tissues (Figure 9). Furthermore, we attempted to investigate Kaplan-Meier curves of the 9 hub genes (Figure 10), and we identified that the DEGS CSF2 and EGF were statistically different with the patients’ prognoses by survival analysis. The results revealed that CSF2 and EGF can be applied to differentiate between OSCC and adjacent non-tumor tissues.
Figure 8.
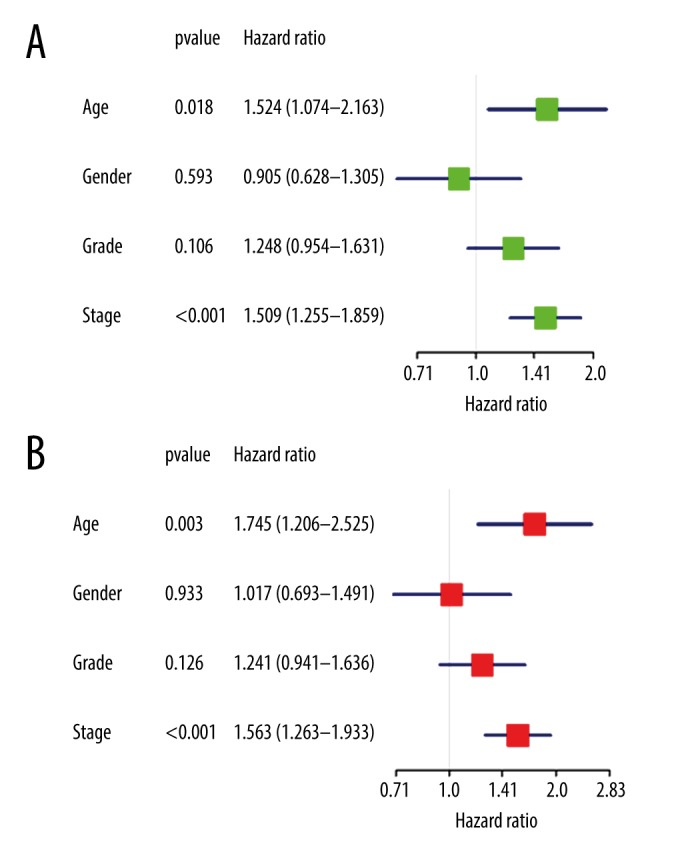
(A, B) Univariate and multivariate Cox regression analysis of the correlation among the clinical characteristics with overall survival.
Figure 9.
Different expressions of the hub genes between the OSCC and adjacent non-tumor tissues. (A) UBC; (B) CSF2; (C) PSMB8; (D) OAS2; (E) HLA-C; (F) HLA-E; (G) ISG15; (H) OAS3; (I) EGF. OSCC – oral squamous cell carcinoma.
Figure 10.
Kaplan-Meier curves for the hub genes in TCGA OSCC cohort. (A) UBC; (B) CSF2; (C) PSMB8; (D) OAS2; (E) HLA-C; (F) HLA-E; (G) ISG15; (H) OAS3; (I) EGF. OSCC – oral squamous cell carcinoma.
Discussion
OSCC is the most common types of human cancer worldwide, and the overall 5-year survival is about 50% [7,23]. However, the potential molecular mechanisms in OSCC pathogenesis and progression are largely unknown. Recently, microarray and high-throughput sequencing technology has been rapidly and widely used in order to investigate genetic alterations during the different diseases’ progression. This technology appears to introduce promising therapeutic targets for tumors’ early detection, diagnosis and treatment.
In our study, based on 3 microarray datasets and using bioinformatics analysis, we identified 651 DEGs, including 288 upregulated and 363 downregulated genes in OSCC tissues compared to non-tumor tissues. Using PCA analysis, we found that OSCC tissues were clearly separated from non-tumor tissues indicating that screened DEGs were specific and could be used to identify relevant genes implicated in OSCC development.
GO analysis showed that the DEGs were enriched in extracellular exosome, external side of plasma membrane, extracellular region, and inflammatory response. Exosomes are delivered into recipient cells by mechanisms such as cell fusion, receptor-mediated uptake, and internalization [24]. Therefore, exosomes may be involved in OSCC’s physiological and pathological developments through regulation of cell-cell communication [25]. Growing evidence indicates that numerous tumor cells produce exosomes, and exosomes promoted OSCC growth and progression, which are emerging as potential technologies for OSCC early therapy or control [26,27]. KEGG pathway annotation of DEGs suggested that DEGs were mainly involved in several biological processes including cytokine-cytokine receptor interaction, metabolism of xenobiotics by cytochrome P450 and glutathione metabolism. Cytokine and cytokine receptor interaction networks are regarded as crucial aspects of inflammation and tumor immunology [28]. In the PPI network, UBC, CSF2, PSMB8, HLA-A, OAS2, HLA-C, HLA-E, ISG15, OAS3, and EGF had higher connectivity degree. The expressions levels of CSF2, PSMB8, OAS2, HLA-C, HLA-E, ISG15, OAS3, and EGF were found to be significant differences between OSCC and adjacent non-tumor tissues from TCGA data. Then, survival analysis using the hub genes revealed that CSF2 and EGF genes were significantly correlated with patients’ overall survival. The results suggested that CSF2 and EGF genes may play crucial roles in the progression of OSCC.
In our study, CSF2 can be considered as a hub gene in OSCC PPI network. CSF-2 (GM-CSF) is now best viewed as a major regulator governing the functions of granulocyte and macrophage lineage populations at all stages of maturation. Several studies reported that tumor-derived hematopoietic growth factors CSF-2 was significantly increased in OSCC tumors compared to controls [29–31]. Another hub gene, epidermal growth factor (EGF) is a key growth factor that initiates a series of biochemical events resulting in increased cell growth [32]. Increasing evidence shows that EGF is closely associated with migration, proliferation, and tumor apoptosis [33–35]. Moreover, several scholars found that EGF in OSCC patients was significantly different compared to healthy control group [36–38]. Also, EGF in OSCC has been correlated to a worse clinical outcome in OSCC [39]. Thus, the targets of CSF2 and EGF may contribute to the progression of OSCC.
Despite these results, there are some limitations to our study. First, we performed a bioinformatics analysis using 3 different microarray datasets and platforms. Though we used background correction and quartile data normalization for the 3 microarray datasets, it might also have variances. Second, OSCC is a highly heterogeneous tumor. For example, there are a lot of differences between oral cavity and oropharynx squamous cell carcinoma. The base of the tongue should be considered different from oral cavity because of HPV infections. Third, most of normal control tissues are adjacent to the tumors, therefore, could be involved of different grades of dysplasia because of the field cancerization phenomenon. Fourth, we identified some enriched pathways and hub genes in this study, however, the relationships between the enriched pathways and hub genes and the hierarchical processes within them were not fully elucidated. In order to find the underlying molecular mechanisms of OSCC, further studies are warranted.
Conclusions
In conclusion, we integrated 3 microarray datasets and identified the functional pathways and hub genes according to bioinformatics methods. This study may provide useful evidence for future investigation into the mechanisms and selection of biomarkers for OSCC. Moreover, a series of verification experiments should be performed later in order to confirm the identified genes function in OSCC.
Footnotes
Source of support: Departmental sources
Conflict of interest
None.
References
- 1.Sievilainen M, Almahmoudi R, Al-Samadi A, et al. The prognostic value of immune checkpoints in oral squamous cell carcinoma. Oral Diseases. :2018. doi: 10.1111/odi.12991. [Epub ahead of print] [DOI] [PubMed] [Google Scholar]
- 2.Fathi N, Ahmadian E, Shahi S, et al. Role of vitamin D and vitamin D receptor (VDR) in oral cancer. Biomed Pharmacother. 2018;109:391–401. doi: 10.1016/j.biopha.2018.10.102. [DOI] [PubMed] [Google Scholar]
- 3.D’Souza S, Addepalli V. Preventive measures in oral cancer: An overview. Biomed Pharmacother. 2018;107:72–80. doi: 10.1016/j.biopha.2018.07.114. [DOI] [PubMed] [Google Scholar]
- 4.Chen C, Ricks S, Doody DR, et al. N-Acetyltransferase 2 polymorphisms, cigarette smoking and alcohol consumption, and oral squamous cell cancer risk. Carcinogenesis. 2001;22(12):1993–99. doi: 10.1093/carcin/22.12.1993. [DOI] [PubMed] [Google Scholar]
- 5.Diniz MG, Silva Jde F, de Souza FT, et al. Association between cell cycle gene transcription and tumor size in oral squamous cell carcinoma. Tumour Biol. 2015;36(12):9717–22. doi: 10.1007/s13277-015-3735-1. [DOI] [PubMed] [Google Scholar]
- 6.Wang B, Zhang S, Yue K, Wang XD. The recurrence and survival of oral squamous cell carcinoma: A report of 275 cases. Chin J Cancer. 2013;32(11):614–18. doi: 10.5732/cjc.012.10219. [DOI] [PMC free article] [PubMed] [Google Scholar]
- 7.Todd R, Hinds PW, Munger K, et al. Cell cycle dysregulation in oral cancer. Crit Rev Oral Biol Med. 2002;13(1):51–61. doi: 10.1177/154411130201300106. [DOI] [PubMed] [Google Scholar]
- 8.Gallo C, Ciavarella D, Santarelli A, et al. Potential salivary proteomic markers of oral squamous cell carcinoma. Cancer Genomics Proteomics. 2016;13(1):55–61. [PubMed] [Google Scholar]
- 9.Yang X, Zhu S, Li L, et al. Identification of differentially expressed genes and signaling pathways in ovarian cancer by integrated bioinformatics analysis. Onco Targets Ther. 2018;11:1457–74. doi: 10.2147/OTT.S152238. [DOI] [PMC free article] [PubMed] [Google Scholar]
- 10.Gautier L, Cope L, Bolstad BM, Irizarry RAL. Affy - analysis of Affymetrix GeneChip data at the probe level. Bioinformatics (Oxford, England) 2004;20(3):307–15. doi: 10.1093/bioinformatics/btg405. [DOI] [PubMed] [Google Scholar]
- 11.Tang Y, Zhang Z, Tang Y, et al. Identification of potential target genes in pancreatic ductal adenocarcinoma by bioinformatics analysis. Oncol Lett. 2018;16(2):2453–61. doi: 10.3892/ol.2018.8912. [DOI] [PMC free article] [PubMed] [Google Scholar]
- 12.Law CW, Alhamdoosh M, Su S, et al. RNA-seq analysis is easy as 1-2-3 with limma, Glimma and edgeR. F1000Res. 2016;5 doi: 10.12688/f1000research.9005.1. pii: ISCB. [DOI] [PMC free article] [PubMed] [Google Scholar]
- 13.Winnepenninckx V, Lazar V, Michiels S, et al. Gene expression profiling of primary cutaneous melanoma and clinical outcome. J Natl Cancer Inst. 2006;98(7):472–82. doi: 10.1093/jnci/djj103. [DOI] [PubMed] [Google Scholar]
- 14.Wang L, Cao C, Ma Q, et al. RNA-seq analyses of multiple meristems of soybean: Novel and alternative transcripts, evolutionary and functional implications. BMC Plant Biol. 2014;14:169. doi: 10.1186/1471-2229-14-169. [DOI] [PMC free article] [PubMed] [Google Scholar]
- 15.Hild M, Beckmann B, Haas SA, et al. An integrated gene annotation and transcriptional profiling approach towards the full gene content of the Drosophila genome. Genome Biol. 2003;5(1):R3. doi: 10.1186/gb-2003-5-1-r3. [DOI] [PMC free article] [PubMed] [Google Scholar]
- 16.Zhao W, Wang D, Zhao J, Zhao W. Bioinformatic analysis of retinal gene function and expression in diabetic rats. Exp Ther Med. 2017;14(3):2485–92. doi: 10.3892/etm.2017.4805. [DOI] [PMC free article] [PubMed] [Google Scholar]
- 17.Ashburner M, Ball CA, Blake JA, et al. Gene ontology: Tool for the unification of biology. The Gene Ontology Consortium. Nat Genet. 2000;25(1):25–29. doi: 10.1038/75556. [DOI] [PMC free article] [PubMed] [Google Scholar]
- 18.Kanehisa M, Goto S, Sato Y, et al. KEGG for integration and interpretation of large-scale molecular data sets. Nucleic Acids Res. 2012;40(Database issue):D109–14. doi: 10.1093/nar/gkr988. [DOI] [PMC free article] [PubMed] [Google Scholar]
- 19.Huang da W, Sherman BT, Lempicki RA. Systematic and integrative analysis of large gene lists using DAVID bioinformatics resources. Nat Protoc. 2009;4(1):44–57. doi: 10.1038/nprot.2008.211. [DOI] [PubMed] [Google Scholar]
- 20.Huang da W, Sherman BT, Lempicki RA. Bioinformatics enrichment tools: Paths toward the comprehensive functional analysis of large gene lists. Nucleic Acids Res. 2009;37(1):1–13. doi: 10.1093/nar/gkn923. [DOI] [PMC free article] [PubMed] [Google Scholar]
- 21.Szklarczyk D, Franceschini A, Kuhn M, et al. The STRING database in 2011: Functional interaction networks of proteins, globally integrated and scored. Nucleic Acids Res. 2011;39(Database issue):D561–68. doi: 10.1093/nar/gkq973. [DOI] [PMC free article] [PubMed] [Google Scholar]
- 22.Zhu Y, Guan Y, Loor JJ, et al. Fatty acid-induced endoplasmic reticulum stress promoted lipid accumulation in calf hepatocytes, and endoplasmic reticulum stress existed in the liver of severe fatty liver cows. J Dairy Sci. 2019;102(8):7359–70. doi: 10.3168/jds.2018-16015. [DOI] [PubMed] [Google Scholar]
- 23.Hanahan D, Weinberg RA. The hallmarks of cancer. Cell. 2000;100(1):57–70. doi: 10.1016/s0092-8674(00)81683-9. [DOI] [PubMed] [Google Scholar]
- 24.Bang C, Thum T. Exosomes: New players in cell-cell communication. Int J Biochem Cell Biol. 2012;44(11):2060–64. doi: 10.1016/j.biocel.2012.08.007. [DOI] [PubMed] [Google Scholar]
- 25.Yang C, Robbins PD. The roles of tumor-derived exosomes in cancer pathogenesis. Clin & Dev Immunol. 2011;2011 doi: 10.1155/2011/842849. 842849. [DOI] [PMC free article] [PubMed] [Google Scholar]
- 26.Liu T, Chen G, Sun D, et al. Exosomes containing miR-21 transfer the characteristic of cisplatin resistance by targeting PTEN and PDCD4 in oral squamous cell carcinoma. Acta Biochim Biophys Sin (Shangai) 2017;49(9):808–16. doi: 10.1093/abbs/gmx078. [DOI] [PubMed] [Google Scholar]
- 27.Sento S, Sasabe E, Yamamoto T. Application of a persistent heparin treatment inhibits the malignant potential of oral squamous carcinoma cells induced by tumor cell-derived exosomes. PloS One. 2016;11(2):e0148454. doi: 10.1371/journal.pone.0148454. [DOI] [PMC free article] [PubMed] [Google Scholar]
- 28.Weidle UH, Klostermann S, Eggle D, Kruger A. Interleukin 6/interleukin 6 receptor interaction and its role as a therapeutic target for treatment of cachexia and cancer. Cancer Genomics Proteomics. 2010;7(6):287–302. [PubMed] [Google Scholar]
- 29.Rhodus NL, Ho V, Miller CS, et al. NF-kappaB dependent cytokine levels in saliva of patients with oral preneoplastic lesions and oral squamous cell carcinoma. Cancer Detect Prev. 2005;29(1):42–45. doi: 10.1016/j.cdp.2004.10.003. [DOI] [PubMed] [Google Scholar]
- 30.Dorta RG, Landman G, Kowalski LP, et al. Tumour-associated tissue eosinophilia as a prognostic factor in oral squamous cell carcinomas. Histopathology. 2002;41(2):152–57. doi: 10.1046/j.1365-2559.2002.01437.x. [DOI] [PubMed] [Google Scholar]
- 31.Yamamoto T, Yoneda K, Ueta E, et al. Serum cytokine levels in patients with oral mucous membrane disorders. J Oral Pathol Med. 1991;20(6):275–79. doi: 10.1111/j.1600-0714.1991.tb00927.x. [DOI] [PubMed] [Google Scholar]
- 32.Henson ES, Gibson SB. Surviving cell death through epidermal growth factor (EGF) signal transduction pathways: Implications for cancer therapy. Cell Signall. 2006;18(12):2089–97. doi: 10.1016/j.cellsig.2006.05.015. [DOI] [PubMed] [Google Scholar]
- 33.Amin DN, Hida K, Bielenberg DR, Klagsbrun M. Tumor endothelial cells express epidermal growth factor receptor (EGFR) but not ErbB3 and are responsive to EGF and to EGFR kinase inhibitors. Cancer Res. 2006;66(4):2173–80. doi: 10.1158/0008-5472.CAN-05-3387. [DOI] [PubMed] [Google Scholar]
- 34.Zhu ML, Kyprianou N. Androgen receptor and growth factor signaling cross-talk in prostate cancer cells. Endocr Relat Cancer. 2008;5(4):841–49. doi: 10.1677/ERC-08-0084. [DOI] [PMC free article] [PubMed] [Google Scholar]
- 35.Campo-Trapero J, Cano-Sanchez J, Palacios-Sanchez B, et al. Update on molecular pathology in oral cancer and precancer. Anticancer Res. 2008;28(2b):1197–205. [PubMed] [Google Scholar]
- 36.Agha-Hosseini F, Mohebbian M, Sarookani MR, et al. Comparative evaluation of EGF in oral lichen planus and oral squamous cell carcinoma. Acta Med Iran. 2015;53(8):471–75. [PubMed] [Google Scholar]
- 37.Bernardes VF, Gleber-Netto FO, Sousa SF, et al. Clinical significance of EGFR, Her-2 and EGF in oral squamous cell carcinoma: A case control study. J Exp Clin Cancer Res. 2010;29:40. doi: 10.1186/1756-9966-29-40. [DOI] [PMC free article] [PubMed] [Google Scholar]
- 38.Bernardes VF, Gleber-Netto FO, Sousa SF, et al. EGF in saliva and tumor samples of oral squamous cell carcinoma. Appl Immunohistochem Mol Morphol. 2011;19(6):528–33. doi: 10.1097/PAI.0b013e3182143367. [DOI] [PubMed] [Google Scholar]
- 39.Romanitan M, Nasman A, Munck-Wikland E, et al. EGFR and phosphorylated EGFR in relation to HPV and clinical outcome in tonsillar cancer. Anticancer Res. 2013;33(4):1575–83. [PubMed] [Google Scholar]


