Abstract
The purpose of this Letter to the Editor is to demonstrate an effective method for estimating viscoelasticity based on measurements of the Rayleigh surface wave speed. It is important to identify the surface wave mode for measuring surface wave speed. A concept of start frequency of surface waves is proposed. The surface wave speeds above the start frequency should be used to estimate the viscoelasticity of tissue. The motivation was to develop a noninvasive surface wave elastography (SWE) technique for assessing skin disease by measuring skin viscoelastic properties. Using an optical based SWE system, the author generated a local harmonic vibration on the surface of phantom using an electromechanical shaker and measured the resulting surface waves on the phantom using an optical vibrometer system. The surface wave speed was measured using a phase gradient method. It was shown that different standing wave modes were generated below the start frequency because of wave reflection. However, the pure symmetric surface waves were generated from the excitation above the start frequency. Using the wave speed dispersion above the start frequency, the viscoelasticity of the phantom can be correctly estimated.
I. INTRODUCTION
Some systemic diseases, including systemic sclerosis (Steen and Medsger, 2000), are associated with stiffened skin due to fibrosis. Skin palpation is the most common clinical method of evaluating skin stiffness. The Modified Rodnan Skin Score (MRSS) (Furst et al., 1998), currently the most common clinical method of assessment, is obtained by palpating 17 designated sites and scoring the level of skin thickening from 0 to 3 at each site. However, the MRSS has high intra-rater and inter-rater user variability (12% and 25%, respectively) (Clements et al., 1995). Delineation of disease state or its progression requires sensitive measurement of skin elastic properties to detect small changes. We have developed a novel surface wave elastography (SWE) technique capable of measuring skin viscoelasticity accurately and quickly (Zhang et al., 2011a). In SWE, an electromechanical shaker is used to generate a local harmonic vibration on the skin. The resulting surface wave propagation on the skin is detected using either an optical probe or an ultrasound probe. Different methods using ultrasound, acoustics, and optics have been studied for surface wave generation and detection (Zhang and Greenleaf, 2007; Qiang et al., 2010). Detection of wave propagation in the skin and subcutaneous tissue is possible using an ultrasound-based SWE system (Zhang et al., 2011b; Zhang et al., 2011c). A novel technique using geometrically focused surface waves was recently proposed to measure skin viscoelastic properties (Kearney et al., 2015). Several viscoelastic models were studied to fit the shear modulus dispersion curve.
Using the reflection free band of the wave dispersion curve, the viscoelasticity of the tissue can be accurately measured. Wave reflection may exist in various organs depending on tissue material properties and geometric and boundary conditions of an organ. In this Letter to the Editor, I propose a concept of start frequency of the Rayleigh surface waves and demonstrate that pure symmetric surface waves can be generated after the start frequency. Using the wave speed dispersion curve after the start frequency, the viscoelasticity of tissue can be correctly estimated.
II. METHODS
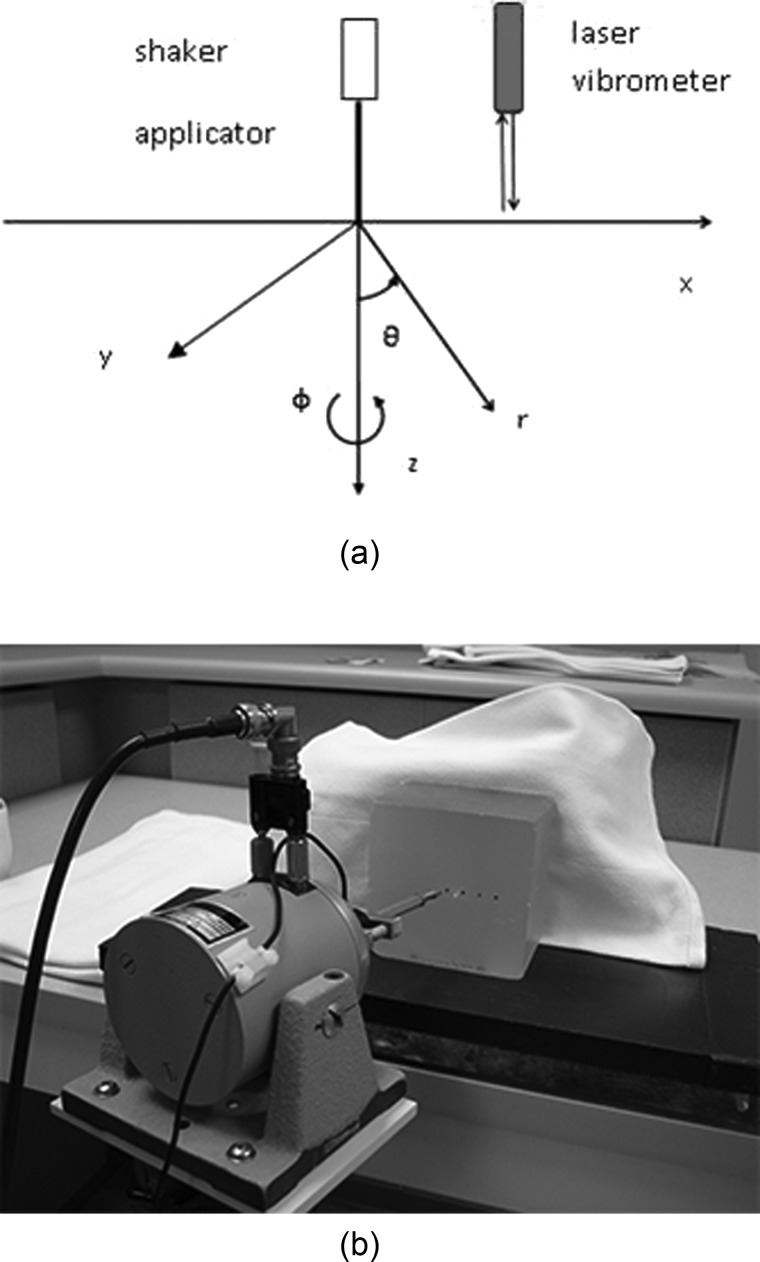
SWE uses an electromagnetic shaker to generate a local harmonic vibration on tissue and a detection probe to measure the resulting surface wave propagation on the tissue. In an optical-based SWE system, the surface wave motion is measured by using a laser vibrometer [Fig. 1(a)]. The measurements of wave speed and wave attenuation enable calculation of viscoelastic properties. Surface wave propagation can be analyzed in a semi-infinite uniform medium under a harmonic excitation. The optical-based SWE system is only capable of measuring normal surface motion of the medium. When considering a harmonic force excitation on the surface of the medium using a circular indenter with radius of a, the normal displacements on the surface of and inside the medium can be solved by (Miller and Pursey, 1954; Royston et al., 1999)
| (1) |
where , , , , , is the Poisson's ratio, is density, and and are the Lamb coefficients, respectively, and denote the wave numbers for compression and shear wave propagation, respectively, and and refer to Bessel functions of the first kind.
FIG. 1.
(Color online) (a) Schema of surface wave measurement on a medium. The medium surface is on the plane of x and y coordinates. The surface wave is generated by an electromechanical shaker. The surface wave is measured with a laser vibrometer. (b) Experimental setup for a rubber block phantom. The phantom sits on a vibration isolated platform and is restrained from the back. The electromechanical shaker generates a harmonic vibration excitation on the front face of the phantom. The surface normal motion of wave propagation is measured by a laser vibrometer.
The wave motion can be solved using Eq. (1). However, our method is to measure the wave speed for estimating the viscoelasticity of tissue. The wave speed is a function of local tissue material properties and does not depend on the detection and excitation. The surface wave speed can be derived as previously described reference for soft tissues (Zhang and Greenleaf, 2007) and can be related to the shear modulus of tissue as
| (2) |
where μ is the real shear elasticity.
The viscosity of tissue can be analyzed by the decay of wave amplitude with distance. Alternatively, viscoelasticity may be expressed using the Kelvin-Voigt model , where is shear elasticity and is shear viscosity. Equation (2) can be modified as
| (3) |
where is mass density, and is the angular frequency.
Experiments were carried out on a commercial tissue mimicking ultrasound phantom (ATS Laboratories, Bridgeport, CT). The phantom has an attenuation coefficient of 0.7 dB/cm/MHz. The usable life of the phantom is greater than 7–10 yrs. The phantom's dimensions are 10 × 10 × 7 cm3. The phantom was supported on a thick rubber material and also backed by vibration absorbed rubber material. A harmonic vibration between 100 and 500 Hz was generated by an electromechanical shaker (V201-PA25E, Ling Dynamic Systems Inc., Middleton, WI) on the phantom. The force was applied on the phantom with a ball-tip indenter with diameter of 3 mm. The surface normal motion of the phantom was measured by a Polytec VibraScan Laser Vibrometer system (Polytec-PI, Inc., Auburn, MA). The experimental setup is shown in Fig. 1(b).
The wave speed is measured by the phase gradient method using , where is the distance between two detection locations, is the phase change over that distance, and ω is the angular frequency. The estimation of wave speed can be improved by measuring the phase change over multiple locations using a regression model , where denotes the regression value of multiple measurements, and are regression parameters, and . A good measurement of wave speed can be assured by the sum of squares of regression residuals (R2) being ≥0.8. By using wave speed measurements at several frequencies, and can be estimated from Eq. (3) by using a nonlinear least-squares fitting technique.
III. RESULTS AND DISCUSSION
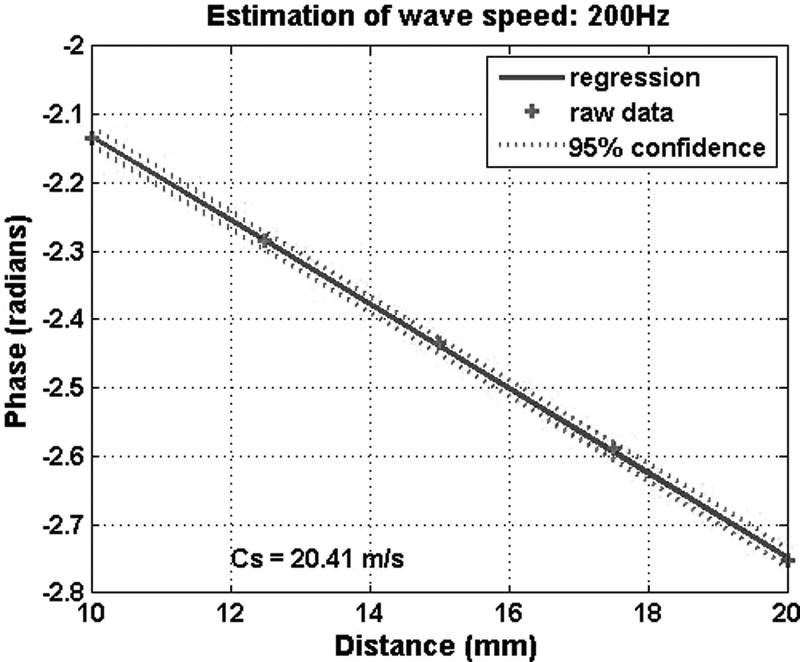
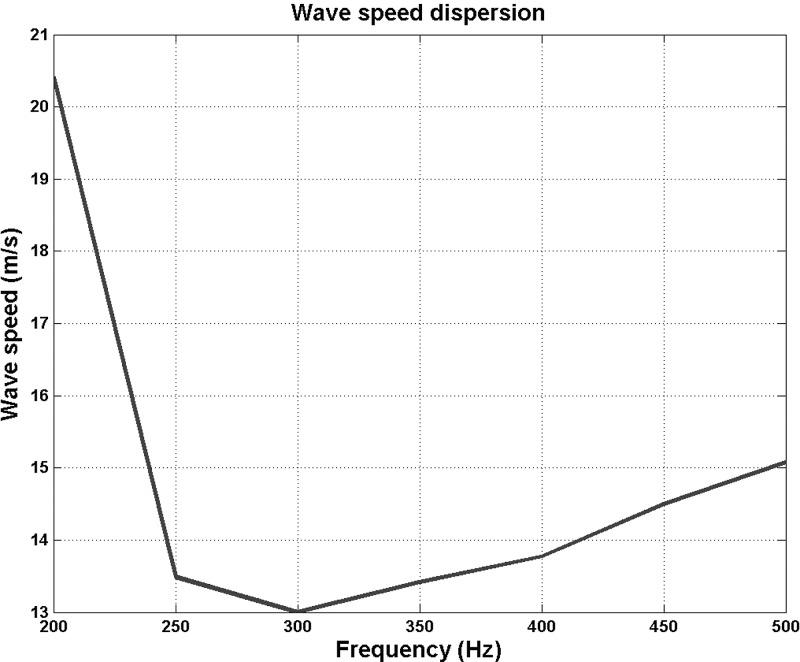
Figure 2 shows the variation of phase with distance along a horizontal line from the exciting force. The first measurement position was 10 mm away from the exciting force. The excitation was a 200 Hz continuous wave. Multiple measurements were taken over the 10 mm distance at every 2.5 mm. The regression analysis for the 200 Hz wave is shown in Fig. 2(a). The regression analysis, with the 95% confidence interval, estimates that the apparent wave speed is = 20.41 ± 0.27 m/s at 200 Hz. The results are expressed in the format of mean ± standard error. The wave speed dispersion, or variation of surface wave speed with frequency, is shown in Fig. 3. The surface wave speeds are, respectively, 20.41, 13.49, 13.00, 13.42, 13.77, 14.50, and 15.08 m/s for 200, 250, 300, 350, 400, 450, and 500 Hz. The wave speed reduces from 200 to 300 Hz and then increases with frequency.
FIG. 2.
(Color online) Regression analysis of the phase change with distance. The first measurement is 10 mm away from the excitation. The phase is measured every 2.5 mm over 10 mm along the horizontal line from the indenter. Estimation of the wave speed is = 20.41 m/s for 200 Hz.
FIG. 3.
(Color online) Measurements of the surface wave speed dispersion with frequency of the phantom. The surface wave speeds are, respectively, 20.41, 13.49, 13.00, 13.42, 13.77, 14.50, and 15.08 m/s for 200, 250, 300, 350, 400, 450, and 500 Hz.
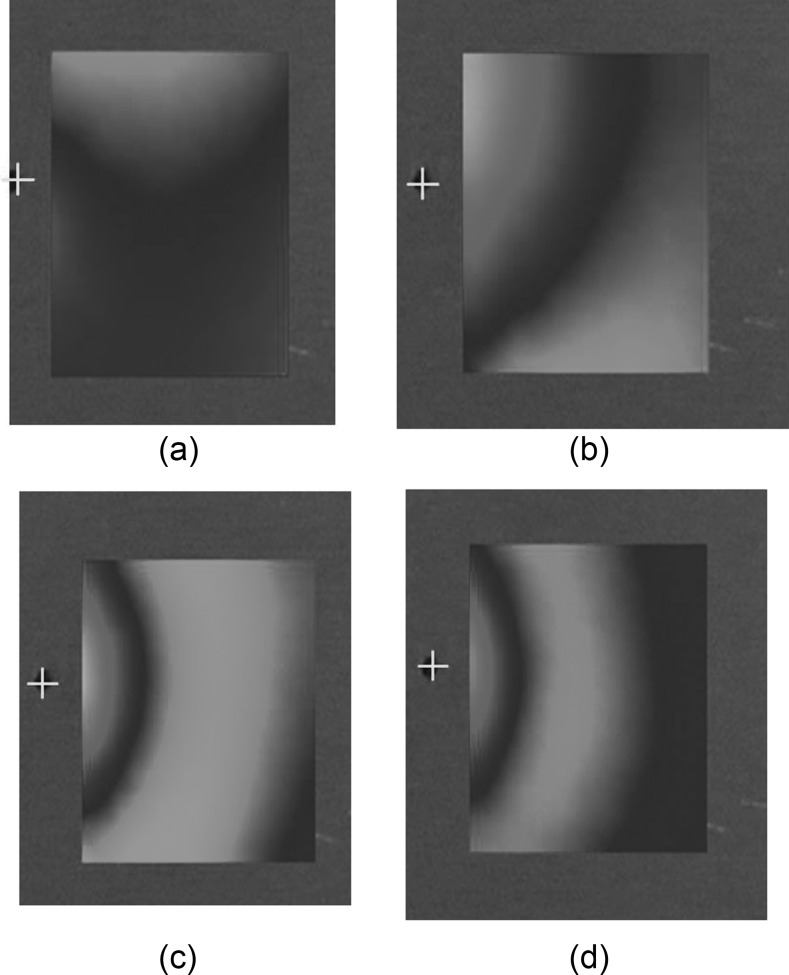
In order to identify surface wave modes, measurements of surface motion over an area on the phantom were performed. The measurement was the particle velocity amplitude in the unit of μm/s coded with color. The red color means that the particle moves out of plane while the green color means that the particle moves into the plane. Figure 4(a) shows the measurement of the 100 Hz wave. The wave mainly travels in the vertical direction up and down on the phantom. It is not a symmetric surface wave mode generated from the source. This is one of the wave modes that results from the combined reflection of waves from the top and bottom boundaries of the phantom. Figure 4(b) shows the area measurement of surface motion at the 200 Hz. The wave mode is not symmetric from the source. The wave propagates in a direction to the right bottom corner of the phantom. This is one of the wave modes that results from the combined reflections of waves from the four edges of the phantom. These wave modes at 100 and 200 Hz are not the symmetric surface waves. The wave propagation was measured over an area at 300 Hz in Fig. 4(c). The wave propagation starts from the indenter excitation and travels symmetrically from the source. The wave propagation at 300 Hz is the pure surface wave. Area measurements of surface wave propagation were also measured at 400 and 500 Hz. Measurements of surface motion at 400 Hz is shown in Fig. 4(d). This is the symmetric surface wave. The wavelength of the 400 Hz wave is smaller than that of the 300 Hz wave. These measurements suggest that the pure symmetric surface waves are generated after 300 Hz for this phantom. The wavelength is getting smaller with increasing frequency. Wave reflection is not present because of the strong absorption of wave energy at high frequencies.
FIG. 4.
(Color online) Measurements of surface motion over an area on the phantom for identifying the surface wave modes. The measurement was the particle velocity amplitude in the unit of μm/s coded with color. The red color means that the particle moves out of plane while the green color means that the particle moves into the plane. The yellow cross indicates where the indenter of the shaker excites the phantom surface. The figures display solely the phantom surface motion. (a) Measurement of the 100 Hz wave suggests that the wave propagates from the up and down. It is not a symmetric surface wave from the excitation. It is one of the resonant waves of the phantom. (b) Measurement of the 200 Hz wave. The wave mode is not symmetric from the source. The wave propagates in a direction to the right bottom corner of the phantom. This is one of the wave modes that results from the combined reflection of waves from the top and bottom boundaries of the phantom. These wave modes at 100 and 200 Hz are not the symmetric surface waves. (c) Measurement of the 300 Hz wave suggests that the wave is a symmetric surface wave. The wave propagation starts from the indenter excitation and travels symmetrically from the source. (d) Measurements of surface motion at 400 Hz. This is the symmetric surface wave. The wavelength of the 400 Hz wave is smaller than that of the 300 Hz wave.
In low frequency, the wavelength can be comparable to the size of a tissue sample. The wave generated on the surface of the tissue can be reflected from the tissue boundaries. Therefore, the wave field shows a complex wave mode in the low frequency due to the interaction of generated wave and reflected waves. In high frequency, the wavelength is decreasing and the wave decays quickly. In this paper, we present the concept of the start frequency of surface waves. The start frequency should be dependent of the material property of the tested medium. The size and boundary conditions of the medium also affect the start frequency. While we cannot analytically calculate the start frequency, pure surface wave are generated at and above 300 Hz in our phantom study. We may identify the start frequency of the tested medium by looking at the two-dimensional (2D) wave propagation pattern or identifying the frequency at which the wave speed is lowest among the tested frequencies. The start frequency of tissue may be lower than 300 Hz for this phantom because tissue is typically softer than this phantom. Tissue is also more viscous than this phantom, which decays the wave more rapidly. In order to correctly estimate the viscoelasticity of tissue, we need to use the surface wave speed dispersion curve above the start frequency. However, high frequency waves decay rapidly. Therefore, there is a frequency band in which pure symmetric surface waves can be generated with strong signals for measuring tissue viscoelasticity.
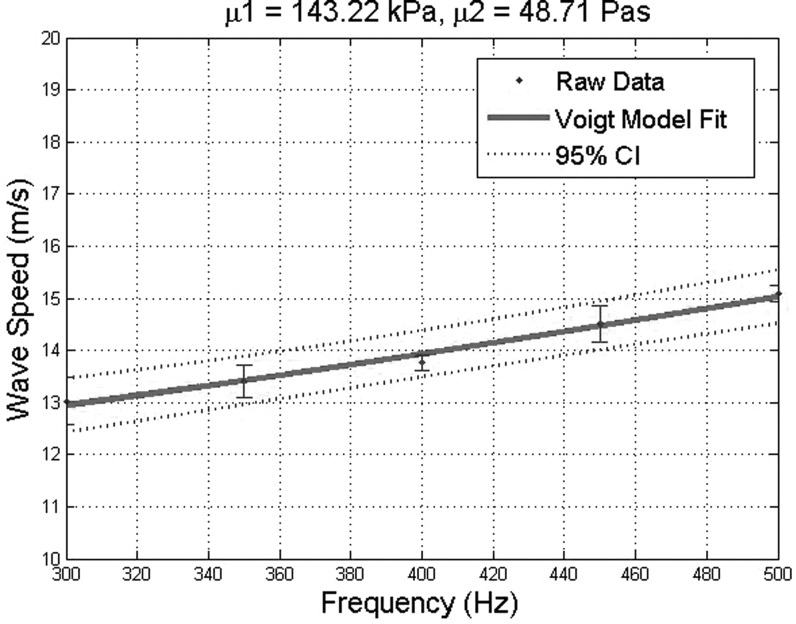
The viscoelasticity of the phantom was estimated using Eq. (3) by using wave speed dispersion curves from 300 to 500 Hz. The shear elasticity and shear viscosity are estimated in Fig. 5, respectively, in the format of mean ± standard error as 143.22 ± 20.19 kPa and 48.71 ± 4.54 Pas. A 95% confidence interval of the prediction is indicated in the figure. This estimation is in agreement to our previous result measured with the ultrasound generated surface wave technique (Zhang and Greenleaf, 2007).
FIG. 5.
(Color online) Estimation of viscoelasticity of the phantom from wave speeds at 300, 350, 400, 450, and 500 Hz.
IV. CONCLUSION
In this this Letter to the Editor, I present the concept of the start frequency of symmetric Rayleigh surface waves from the excitation. By using the surface wave speed dispersion above the start frequency, the viscoelasticity can be estimated with the SWE technique. The start frequency of surface waves can be identified by measuring the 2D surface wave propagation pattern or choosing the frequency at which the wave speed is the minimum among the tested frequencies.
ACKNOWLEDGMENTS
This study is supported by a research career development award for a non-clinician scientist by the Mayo Clinic and a Mayo Clinic NIH Relief Grant to X.Z. This study is also supported by NIH R01HL125234 from the National Heart, Lung, and Blood Institute. The author thanks Jennifer Poston for editing this manuscript. The author would also like to thank the anonymous reviewers for their constructive comments and Dr. Thomas J. Royston, Associate Editor, for his careful handling of this manuscript.
References
- 1. Clements, P. , Lachenbruch, P. , Siebold, J. , White, B. , Weiner, S. , Martin, R. , Weinstein, A. , Weisman, M. , Mayes, M. , Collier, D. , Wigley, F. , Medsger, T. , Steen, V. , Moreland, L. , Dixon, M. , Massa, M. , Lally, E. , McCloskey, D. , and Varga, J. (1995). “ Inter and intraobserver variability of total skin thickness score (modified Rodnan TSS) in systemic sclerosis,” J. Rheumatol. 22(7), 1281–1285. [PubMed] [Google Scholar]
- 2. Furst, D. E. , Clements, P. J. , Steen, V. D. , Medsger, T. A., Jr. , Masi, A. T. , D'Angelo, W. A. , Lachenbruch, P. A. , Grau, R. G. , and Seibold, J. R. (1998). “ The modified Rodnan skin score is an accurate reflection of skin biopsy thickness in systemic sclerosis,” J. Rheumatol. 25(1), 84–88. [PubMed] [Google Scholar]
- 3. Kearney, S. P. , Khan, A. , Dai, Z. , and Royston, T. J. (2015). “ Dynamic viscoelastic models of human skin using optical elastography,” Phys. Med. Biol. 60(17), 6975–6990. 10.1088/0031-9155/60/17/6975 [DOI] [PMC free article] [PubMed] [Google Scholar]
- 4. Miller, G. F. , and Pursey, H. (1954). “ The field and radiation impedence of mechanical radiators on the free surface of a semi-infinite isotropic solids,” Proc. R. Soc. London Ser. A 223, 521–541. 10.1098/rspa.1954.0134 [DOI] [Google Scholar]
- 5. Qiang, B. , Greenleaf, J. , and Zhang, X. (2010). “ Quantifying viscoelasticity of gelatin phantoms by measuring impulse response using compact optical sensors,” IEEE Trans. Ultrason. Ferroelectr. Freq. Control 57(7), 1696–1700. 10.1109/TUFFC.2010.1600 [DOI] [PubMed] [Google Scholar]
- 6. Royston, T. J. , Mansy, H. A. , and Sandler, R. H. (1999). “ Excitation and propagation of surface waves on a viscoelastic half-space with application to medical diagnosis,” J. Acoust. Soc. Am. 106(6), 3678–3686. 10.1121/1.428219 [DOI] [PubMed] [Google Scholar]
- 7. Steen, V. D. , and Medsger, T. A., Jr. (2000). “ Severe organ involvement in systemic sclerosis with diffuse scleroderma,” Arthritis Rheum. 43(11), 2437–2444. [DOI] [PubMed] [Google Scholar]
- 8. Zhang, X. , and Greenleaf, J. F. (2007). “ Estimation of tissue's elasticity with surface wave speed,” J. Acoust. Soc. Am. 122(5), 2522–2525. 10.1121/1.2785045 [DOI] [PubMed] [Google Scholar]
- 9. Zhang, X. , Osborn, T. G. , Pittelkow, M. R. , Qiang, B. , Kinnick, R. R. , and Greenleaf, J. F. (2011a). “ Quantitative assessment of scleroderma by surface wave technique,” Med. Eng. Phys. 33, 31–37. 10.1016/j.medengphy.2010.08.016 [DOI] [PubMed] [Google Scholar]
- 10. Zhang, X. , Qiang, B. , and Greenleaf, J. (2011b). “ Comparison of the surface wave method and the indentation method for measuring the elasticity of gelatin phantoms of different concentrations,” Ultrasonics 51, 157–164. 10.1016/j.ultras.2010.07.005 [DOI] [PMC free article] [PubMed] [Google Scholar]
- 11. Zhang, X. , Qiang, B. , Hubmayr, R. D. , Urban, M. W. , Kinnick, R. , and Greenleaf, J. F. (2011c). “ Noninvasive ultrasound image guided surface wave method for measuring the wave speed and estimating the elasticity of lungs: A feasibility study,” Ultrasonics 51, 289–295. 10.1016/j.ultras.2010.09.005 [DOI] [PubMed] [Google Scholar]


