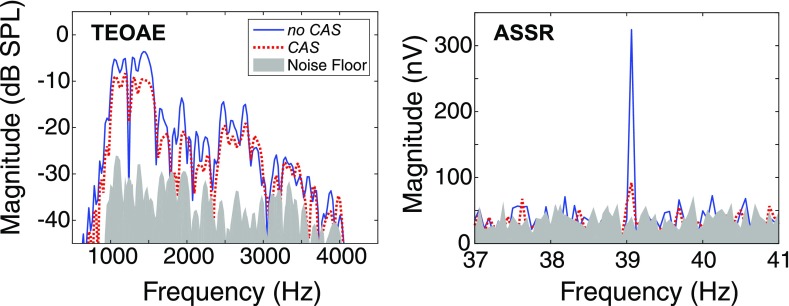
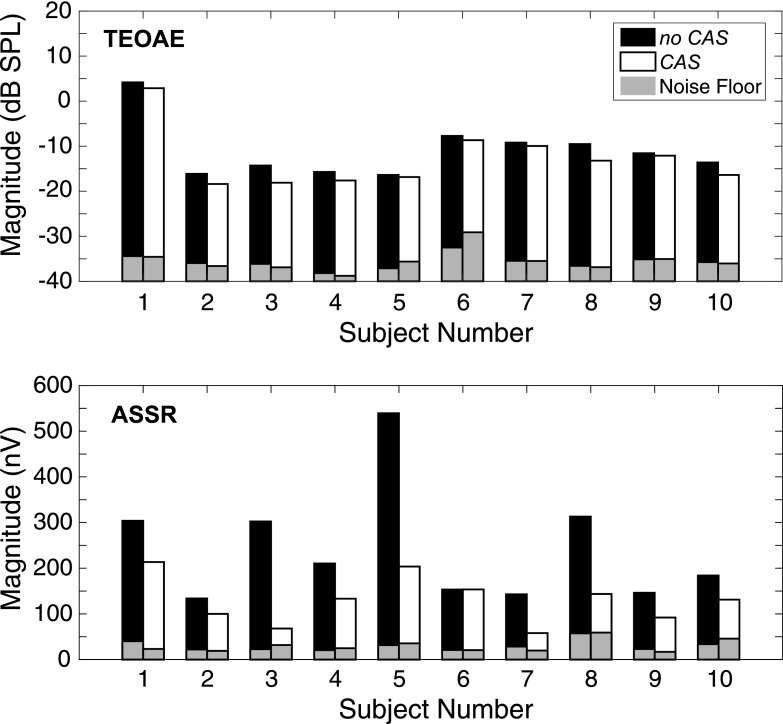
Because of an error on the part of the authors, an incorrect scaling factor was applied to the magnitudes of the fast Fourier transforms of the transient-evoked otoacoustic emission (TEOAE) waveforms. The result was that the TEOAE signal and noise floor magnitudes for the no contralateral acoustic stimulation (no CAS) and contralateral acoustic stimulation (CAS) conditions reported in Fig. 4 (left panel), Fig. 5 (top panel), and Table I of this paper were approximately 6.43 dB lower than their true values. Corrected versions (Figs. 4 and 5 and Table I) are shown below (note that the contour of the figures did not change from those in the original paper because all values were increased by the same amount). This error did not affect the signal-to-noise ratios (SNRs) or the magnitudes of TEOAE contralateral suppression reported in the original paper because these are relative values, and so the discussion and conclusions of the original paper did not change.
TABLE I.
Descriptive statistics for TEOAE group data for the parameters of signal magnitude, noise-floor magnitude, and SNR. Results are displayed to facilitate comparison between the no CAS and CAS conditions for each parameter. Means, minimums, and maximums are in dB SPL. SNRs and SDs are in dB.a
| Parameter | Condition | Mean | SD | Minimum | Maximum |
|---|---|---|---|---|---|
| Signal | no CAS | −11.0 | 6.2 | −16.4 | 4.2 |
| CAS | −12.8 | 6.5 | −18.4 | 2.9 | |
| Noise Floor | no CAS | −35.7 | 1.5 | −38.2 | −32.5 |
| CAS | −35.5 | 2.5 | −38.8 | −29.1 | |
| SNR | no CAS | 24.7 | 5.4 | 19.8 | 38.6 |
| CAS | 22.7 | 5.7 | 18.2 | 37.4 |
Sound pressure level (SPL); standard deviation (SD).
FIG. 4.
(Color online) Recorded TEOAE and auditory steady-state response (ASSR) spectra (left and right panels, respectively) for one representative subject. Solid lines represent responses obtained in the no CAS condition. Dotted lines represent responses obtained in the CAS condition. The filled gray regions represent the recording noise floors.
FIG. 5.
Magnitudes of TEOAEs and ASSRs (top and bottom panels, respectively) for each individual subject. Responses in the no CAS and CAS conditions are represented by black and white bars, respectively. The recording noise floors are represented by gray bars; noise floors in the no CAS and CAS conditions are on the left and right side, respectively, for each individual subject. The magnitudes displayed here represent the mean computed across the two replicate measurements obtained from each subject.


