Abstract
Acoustic speech is marked by time-varying changes in the amplitude envelope that may pose difficulties for hearing-impaired listeners. Removal of these variations (e.g., by the Hilbert transform) could improve speech reception for such listeners, particularly in fluctuating interference. Léger, Reed, Desloge, Swaminathan, and Braida [(2015b). J. Acoust. Soc. Am. 138, 389–403] observed that a normalized measure of masking release obtained for hearing-impaired listeners using speech processed to preserve temporal fine-structure (TFS) cues was larger than that for unprocessed or envelope-based speech. This study measured masking release for two other speech signals in which level variations were minimal: peak clipping and TFS processing of an envelope signal. Consonant identification was measured for hearing-impaired listeners in backgrounds of continuous and fluctuating speech-shaped noise. The normalized masking release obtained using speech with normal variations in overall level was substantially less than that observed using speech processed to achieve highly restricted level variations. These results suggest that the performance of hearing-impaired listeners in fluctuating noise may be improved by signal processing that leads to a decrease in stimulus level variations.
I. INTRODUCTION
Hearing-impaired (HI) listeners often experience greater difficulties understanding speech in noise than do normal-hearing (NH) listeners. In continuous noise, HI listeners typically require a higher speech-to-noise ratio (SNR) to achieve the same level of performance as NH listeners (e.g., Festen and Plomp, 1990). Furthermore, HI listeners do not show as great an improvement as NH listeners in fluctuating compared to continuous noise (Festen and Plomp, 1990; Moore et al., 1999; Bernstein and Grant, 2009; Desloge et al., 2010).
In NH listeners, masking release (MR) (i.e., better performance in a fluctuating compared to a continuous background noise) has been suggested to arise from the ability to “glimpse” portions of speech that are present during momentary dips in the noise (Cooke, 2006). The lower MR observed in HI listeners has been attributed to a variety of factors. One source may be related in part to the elevated auditory thresholds of HI listeners which lead to lower audibility of speech (e.g., see Zurek and Delhorne; 1987; Bacon et al., 1998; Desloge et al., 2010; Phatak and Grant, 2014) or to their reduced cochlear compression (Gregan et al., 2013). The role of SNR in the size of MR may be another contributing factor: MR has been shown to decrease with an increase in SNR and HI listeners typically require a higher SNR than NH listeners for equivalent levels of performance (Bernstein and Grant, 2009; Desloge et al., 2010). Another hypothesis regarding the ability to make use of speech information present in the gaps is concerned with the ability to use temporal fine-structure (TFS) cues. Hopkins and Moore (2009), for example, observed an increase in MR with an increase in the number of spectral channels in which TFS cues were present. However, other studies have found no direct link between TFS cues and MR (e.g., Oxenham and Simonson, 2009; Bernstein and Brungart, 2011; Freyman et al., 2012). Recently, it has been suggested that MR arises in NH listeners due to a release from the random modulations present in nominally steady noise (e.g., Stone et al., 2012). According to this hypothesis, HI listeners fail to manifest MR because of spectral smearing that reduces this type of modulation masking (Oxenham and Kreft, 2014) and not because of elevated thresholds that reduce audibility in the gaps of temporally modulated noises.
Léger et al. (2015b) examined MR for three different types of speech:1 unprocessed speech, speech processed to convey TFS cues, and speech processed to convey envelope cues.
Results from three of their speech conditions [Unprocessed (U), broadband TFS (T1), and 40-band envelope (E)] are the basis for the current study. The two processed conditions were generated using the Hilbert transform to decompose the signals into envelope (i.e., the magnitude of the Hilbert analytic signal) and fine-structure (i.e., the cosine of the Hilbert analytic signal) components. For the T1 condition, the signal was passed through a broadband filter spanning the range of 80 to 8020 Hz, the envelope component was discarded, and only the fine-structure component was retained. For the E condition, the signal was filtered into 40 bands of equal bandwidth on a logarithmic scale spanning the range of 80–8020 Hz, the envelope component of each band was used to modulate tone carriers with frequencies equal to the center frequency of each band, and the bands were then recombined to form the new signal.
The consonant-identification ability of NH and HI listeners for each type of speech was examined in backgrounds of continuous and square-wave modulated noise. A normalized measure of masking release (NMR) was calculated as follows:
| (1) |
NMR may be interpreted as the fraction of baseline performance “lost” due to continuous noise that can be recovered in the presence of an interrupted noise. By using baseline performance as a reference, this metric highlights the differences due to interrupted versus continuous noise and minimizes the differences due to factors such as the hearing impairment of the listener or the distorting effects of the processing on the speech itself.
In the study of Léger et al. (2015b), the NH listeners demonstrated large amounts of NMR for all three types of speech (0.78, 0.86, and 0.65 for U, T1, and E speech, respectively). For the HI listeners, NMR was substantially larger for T1 (0.67) compared to the values observed for U (0.23) and E (0.13) speech. The source of the greater NMR observed in HI listeners for T1 compared to U and E speech was not clear from these experiments. It was hypothesized to arise as a by-product of the removal of amplitude variation associated with Hilbert-transform-based TFS processing, rather than to be due to more effective transmission of TFS itself using the processed stimuli.2 To understand this hypothesis, consider the effect of Hilbert-transform TFS processing, which maintains zero crossings while removing global amplitude variation, on stimuli presented in continuous versus square-wave interrupted noise at negative values of SNR (i.e., when the noise dominates the speech). In this case, with continuous background noise, both the amplitude and average short-term SNR of the speech-plus-noise stimulus amplitude are roughly constant and so removal of amplitude variation has little effect upon the stimulus and, consequently, on the overall stimulus SNR. For modulated background noise at negative values of SNR, however, the stimulus amplitude and short-term SNR alternate between higher-noise, lower-SNR intervals, and lower-noise, higher-SNR intervals. In this case, removal of amplitude variation has the effect of amplifying intervals of the second type (i.e., the noise “gaps”) relative to intervals of the first type thus raising the overall stimulus SNR. The resulting increase in audibility of the higher-SNR gaps in the modulated noise may have contributed in part to the greater observed NMR.
The current study investigated this hypothesis in greater depth by comparing the intelligibility of TFS-processed speech to that of two additional types of processed speech that were intended to remove amplitude variation in a similar manner but without the associated goal of preserving the original signal TFS. In particular, the role of amplitude variations was examined based on the hypothesis that reduced variations in amplitude would lead to greater speech audibility in the gaps of fluctuating background noise and in turn to greater MR.
The first processing condition used peak clipping of the U speech to remove variations in amplitude. Although zero-crossings (and thus fine-structure cues) are maintained in the peak-clipped signals, the waveforms of peak-clipped and TFS speech differ, with peak clipping introducing distortion products that are not present with TFS processing. The second processing condition began with the same 40-band envelope processing as tested by Léger et al. (2015b), which used the Hilbert transform to remove the original TFS cues while maintaining variations in amplitude. This signal was then reprocessed by the Hilbert transform to remove the amplitude variation. By comparing the performance of envelope-processed to envelope-then-TFS-processed speech, we were able to explore the effect of removing amplitude variation on a signal that contained no TFS cues (see justification of this claim in Sec. II C).
Although some of the stimuli in the current study were derived using the Hilbert transform, the focus of this paper is not on the role of TFS or envelope cues on MR but rather on the manipulation of overall amplitude variation (that can be accomplished using the Hilbert transform) and its role in providing HI listeners with MR in fluctuating backgrounds.
II. METHODS
The methods generally follow those employed by Léger et al. (2015b) with the addition of two new speech conditions.
A. Participants
The experimental protocol for testing human subjects was approved by the internal review board of the Massachusetts Institute of Technology. All testing was conducted in compliance with regulations and ethical guidelines on experimentation with human subjects. All listeners provided informed consent and were paid for their participation in the experiments.
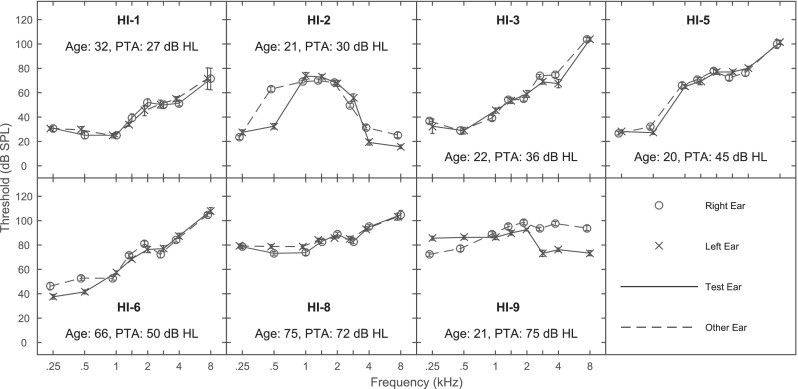
Seven of the HI listeners tested by Léger et al. (2015b) (HI-1, HI-2, HI-3, HI-5, HI-6, HI-8, and HI-9) returned for additional testing under the conditions listed below. These listeners were all native speakers of American English, exhibited stable, bilateral, symmetric sensorineural hearing loss, and ranged in age from 21 to 75 yrs. They are numbered according to their five-frequency (0.25, 0.5, 1, 2, and 4 kHz) pure-tone average (PTA), which increased from 25 dB hearing level (HL) (for HI-1) to 77 dB HL (for HI-9). Detection thresholds for each HI listener are shown in Fig. 1. Thresholds, plotted in dB sound pressure level (SPL), were measured using 500-msec tones in a three-alternative forced-choice procedure. The panels also provide the age and PTA in dB HL for each listener. A more complete audiological description of these listeners is available in Table I of Léger et al. (2015b).
FIG. 1.
(Color online) Detection thresholds in dB SPL as a function of frequency in kHz for 7 HI listeners. Thresholds were measured using 500-msec tones in a three-alternative, forced-choice, adaptive procedure. Age in years and PTA in dB HL (averaged over the 5 octave frequencies between 0.25 and 4.0 kHz) are provided in the panel for each HI listener.
The HI listeners returned to complete the new test conditions anywhere from 7 to 17 months following their participation in the original study. To verify the stability of the hearing losses, the audiometric thresholds obtained at the time of the original testing were compared with those obtained at a date closer in time to that of the new test conditions and with at least 1 year between sets of measures. A comparison of the five-frequency PTA between these two sets of measurements indicated an average change of +2.98 dB across the 7 HI listeners with a range of −0.3 dB to +5.6 dB.
B. Speech materials
The speech stimuli were taken from the corpus of Shannon et al. (1999) and included recordings by four male (M) and four female (F) talkers of /ɑ/-C-/ɑ/ disyllables with C=/p t k b d g f s ʃ v z dʒ m n r l/. The training set consisted of 64 Vowel-Consonant-Vowel (VCV) tokens (one utterance of each of the 16 disyllables by 2 M and 2 F talkers) and the test set consisted of a separate set of 64 VCVs (1 utterance of each of the 16 disyllables by 2 different M and 2 different F talkers). The recordings were digitized with 16-bit precision at a sampling rate of 32 kHz.
C. Processing conditions
Two new conditions, described below, were created which resulted in a reduction in the amplitude variations that occur in normally produced speech. Results from these conditions were compared to results from three of the test conditions studied previously by Léger et al. (2015b): unprocessed speech (U), broadband TFS condition (T1), and 40-band envelope condition (E). Note that all processing conditions were applied to a mixture of speech and noise as described in Sec. II D.
The T1 speech was generated by band limiting the original speech to 80–8020 Hz, taking the Hilbert transform, preserving the cosine of the Hilbert analytic phase, and normalizing the energy to equal that of the original stimulus. The 40-band envelope speech (E) was generated by bandpass filtering the input into 40 bands of equal bandwidth on a logarithmic frequency scale that spanned the range of 80–8020 Hz, taking the Hilbert transform of each band, low-pass filtering the Hilbert analytic magnitude at 64 Hz, using these envelopes to modulate corresponding tones (with random starting phase) at the centers of each band, summing the modulated tones, and equalizing the energy to that of the original stimulus. For additional details on this processing, please consult Gilbert and Lorenzi (2006) and Léger et al. (2015b).
For the first new test condition, the signal was processed with an algorithm to produce infinite peak clipping (P) (Licklider and Pollack, 1948). The signal was first band limited to 80–8020 Hz. An infinitely peak-clipped signal, ipc(t), was generated from the sign of the input signal, s(t), as follows:
| (2) |
This result was then normalized to have an average energy equal to that of the original s(t) over its entire duration. Compared to T1 speech tested by Léger et al. (2015b), P speech has a different waveform (due to different types of distortions introduced by the two types of processing) but has identical zero-crossing points and a similar reduction in amplitude variation.
For the second new test condition, the signal was processed in two stages: first to remove the TFS information and second to reduce the amplitude variation. The first stage of processing generates the 40-band E signal described above, which consists of 40 amplitude-modulated sine waves with random starting phases. Randomizing the starting phases of the 40 tones that are modulated to generate the E signal yields random TFS cues that are unrelated to those of the original stimulus (as confirmed by Swaminathan et al., 2014).3 For the second stage of processing, the E speech was reprocessed with broadband Hilbert transform TFS (i.e., T1) processing to remove amplitude variation yielding E/T1 speech. As with the other speech types, the E/T1 condition was bandpass filtered to span the range of 80–8020 Hz. Speech processed in this way conveys minimal TFS information, but at the same time exhibits the removal of amplitude variation that arises as a by-product of T1 processing. The cues that are likely available for speech reception in the E/T1 condition arise from the narrowband envelopes that may still be recovered by the auditory system even after broadband Hilbert TFS processing (Drullman, 1995; Ghitza, 2001). Note that both E and E/T1 were normalized to have the same overall stimulus energy as the original unprocessed stimulus.
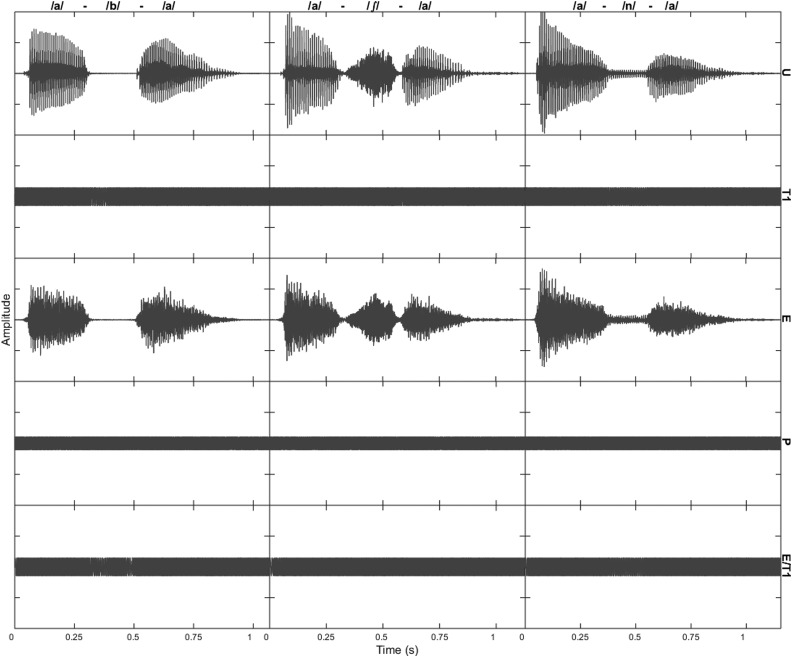
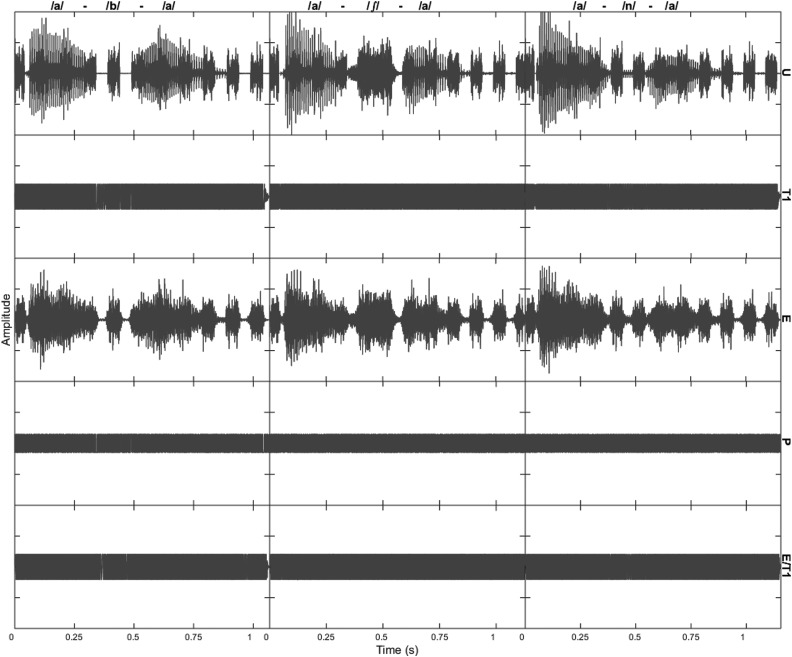
Examples of these five types of processing are shown in Fig. 2. Waveforms of /ɑ/-/b/-/ɑ/, /ɑ/-/ʃ/-/ɑ/, and /ɑ/-/n/-/ɑ/ produced by a M talker are shown for U, T1, E, P, and E/T1. These signals, which were equated for energy, are shown for 70-dB SPL speech in a low-level continuous background noise of 30 dB SPL (Baseline condition—see Sec. II D). The variations in the broadband amplitude envelope observed for U and E speech are greatly reduced (or absent) for the remaining three types of speech, which exhibit largely flat envelopes. The extent of amplitude variation for each processing type can be quantified using the crest factor [the ratio of the peak value to the root-mean-square (rms) value of a given waveform]. For the speech waveforms shown in Fig. 2 for the syllable /ɑ/-/b/-/ɑ/, for example, crest factors increased from 0 dB for P to 3.0 dB for T1 and E/T1, and finally to 14 dB for U and E processing. These values were typical of those across the set of 64 speech tokens used in the test conditions (representing 16 consonants in /ɑ/-C-/ɑ/ syllables produced by 2 M and 2 F talkers). Over this set of utterances, the means (and standard deviations) of the crest factors were 0 dB (0 dB) for P, 3.0 dB (0.06 dB) for T1, 3.0 dB (0.02 dB) for E/T1, 14.1 dB (1.5 dB) for E, and 15.1 (2.0 dB) for U.
FIG. 2.
(Color online) Stimulus waveforms are shown for five types of signal processing (U, T1, E, P, and E/T1) in the five rows, respectively. The three columns show waveforms for three different utterances (/ɑ/-b/-/ɑ/, /ɑ/-/ʃ/-/ɑ/, and /ɑ/-/n/-/ɑ/, respectively) produced by a M talker. The stimuli are shown at a level of 70 dB SPL presented in a continuous noise background of 30 dB SPL (i.e., an SNR of +40 dB). The same “frozen” noise sample was added to each stimulus for ease of visual comparisons across stimuli.
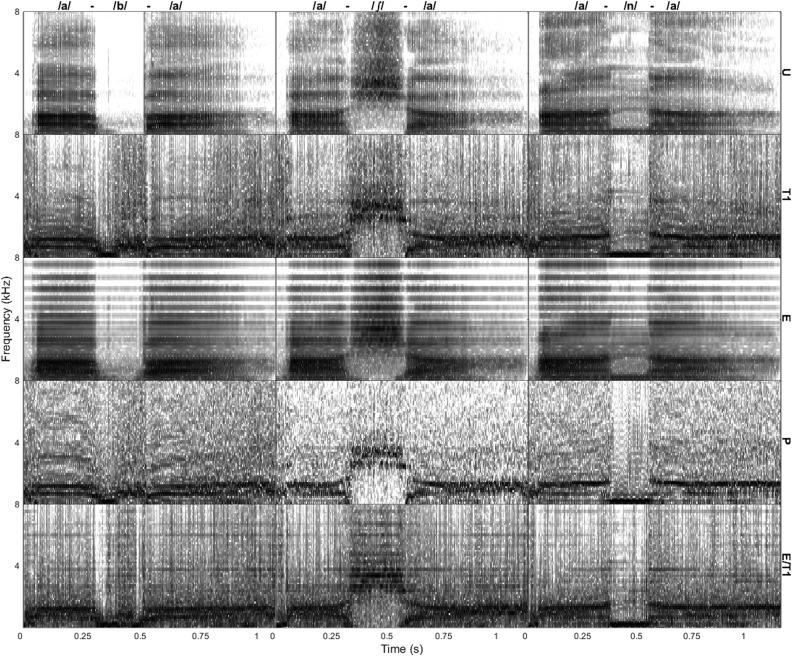
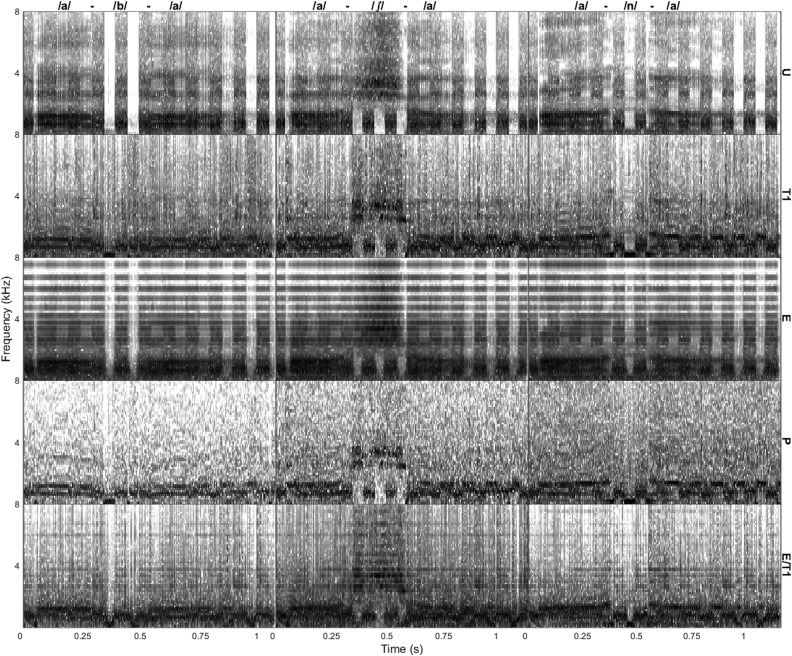
The spectro-temporal properties of these same signals are depicted in the spectrograms shown in Fig. 3. In each plot, the consonant is clearly evident between the two /ɑ/ segments. Comparing the various processing schemes leads to the following observations. For U versus E processing, the tone vocoding of E processing is evident in the form of stripes in the spectrograms that occur at the 40 frequencies used to synthesize the stimulus while leaving the consonant energy largely unchanged. For T1, P, and E/T1 versus U and E processing there is a clear effect of amplifying /b/ and /n/ relative to /ɑ/ (leftmost and rightmost columns). This effect is less clear for /ʃ/ (center column) due to the fact that this consonant has substantial energy in its original (U) production. For T1 versus P processing, the spectrograms are clearly different with much more “noise” evident for P. Although both P and U processing preserve the same zero crossings as the original signals, P introduces distortions that render it substantially different from T1. For E/T1 versus E processing, some traces of the tone vocoding remain (suggesting that the T1 processing preserves some of the spectral structure of the E stimuli) while the consonant tends to be amplified relative to the vowel. For E/T1 versus T1, it is clear that the spectra of the stimuli are very similar even though the E/T1 processing has removed the TFS.
FIG. 3.
Spectrograms of sample stimuli for five types of signal processing (U, T1, E, P, and E/T1) in the five rows, respectively. The three columns show waveforms for three different utterances (/ɑ/-b/-/ɑ/, /ɑ/-/ʃ/-/ɑ/, and /ɑ/-/n/-/ɑ/, respectively) produced by a M talker. The stimuli are shown at a level of 70 dB SPL presented in a continuous noise background of 30 dB SPL (i.e., an SNR of +40 dB). The same “frozen” noise sample was added to each stimulus for ease of visual comparisons across stimuli.
D. Noise conditions
The reception of P and E/T1 speech was studied in the same three background noise conditions as employed for U, T1, and E speech by Léger et al. (2015b). Specifically, speech was adjusted to a comfortable listening level for U speech. A speech-shaped noise at 30 dB SPL was then added to all speech signals before further processing. In the Baseline condition, no further noise was added. In the Continuous condition, an additional speech-shaped continuous noise was added to the Baseline at a level chosen to yield roughly 50%-correct consonant identification on U speech for each individual listener. In the Interrupted condition, an additional square-wave speech-shaped noise interrupted at a rate of 10 Hz and a duty cycle of 50% was added to the Baseline condition. The overall rms level of the Interrupted noise was adjusted to be equal to that of the Continuous noise to achieve the same SNR with both types of noise.
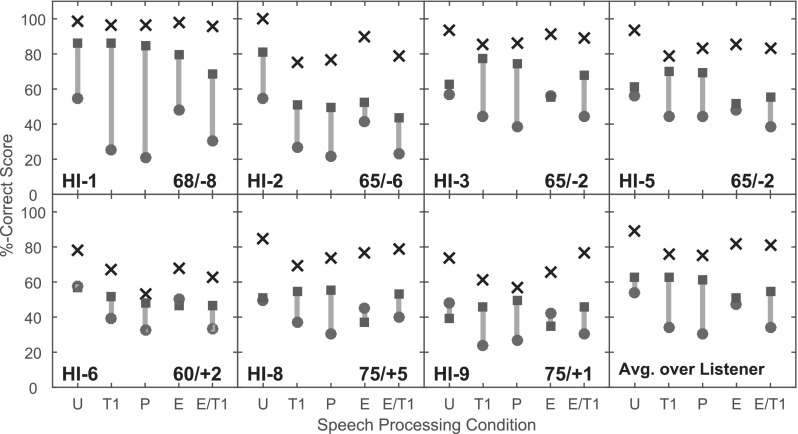
All speech levels and SNRs used in testing individual listeners in the current study were identical to those used by Léger et al. (2015b) and are provided in Fig. 6 below. Amplification was applied to the speech-plus-noise stimuli using the NAL-RP formula (Dillon, 2001).
FIG. 6.
(Color online) Consonant identification scores in %-Correct for each of five types of speech (U, T1, P, E, and E/T1) in three types of noise (Baseline—X, Interrupted—filled squares, and Continuous—filled circles). Seven panels show results of individual HI listeners and one panel shows averages across listeners. The speech level in dB SPL prior to NAL amplification and the SNR in dB are provided for each HI listener (e.g., 68/-8). The gray bars connecting the Continuous and Interrupted data points are provided for visual guidance and represent MR in percentage points.
Examples of waveforms of each of the five types of processing for speech in the Interrupted noise background at an SNR of 0 dB (selected as the mean value of the SNRs employed across the HI listeners) are shown in Fig. 4 for three VCVs produced by a M talker (/ɑ/-/b/-/ɑ/, /ɑ/-/ʃ/-/ɑ/, and /ɑ/-/n/-/ɑ/). For the U and E processing conditions, elements of both the speech and the interrupted-noise amplitude fluctuations are evident. The stimulus alternates between segments of high and low SNR (where the speech dominates the noise and vice versa) with many of the high-SNR segments seen to be comparatively low in energy relative to the low-SNR segments. For the T1, P, and E/T1 conditions, on the other hand, all fluctuations have been removed and the relative energies of the high- and low-SNR segments have been equalized. The crest factors for the signals shown here in backgrounds of Continuous and Interrupted noise are quite similar to those reported above for the Baseline condition. In fact, calculations of crest factors as a function of SNR over the set of 64 test syllables indicate virtually no change over a range of +40 to −40 dB SNR for the T1, P, and E/T1 conditions and a decrease of roughly 3 dB over this range for the U and E conditions.
FIG. 4.
(Color online) As in Fig. 2, but for stimuli in a background of square-wave interrupted noise (at a rate of 10 Hz) with a speech level of 70 dB SPL and SNR of 0 dB.
The spectro-temporal properties of these signals are depicted in the spectrograms plotted in Fig. 5. The pulses of the interrupted noise are evident in these plots with glimpses of the VCV stimuli visible between the pulses. Many of the trends described previously for Fig. 3 are evident in these plots as well. Most interestingly, comparing T1, P, and E/T1 to U and E processing reveals that the former processing schemes tend to amplify the speech in the gaps relative to the speech-plus-noise present in the noise pulses for all three consonants.
FIG. 5.
As in Fig. 3, but for stimuli in a background of square-wave interrupted noise (at a rate of 10 Hz) with a speech level of 70 dB SPL and SNR of 0 dB.
E. Test procedure
Consonant identification was tested using a one-interval, 16-alternative, forced-choice procedure without correct-answer feedback. For each of the two speech conditions (P and E/T1), testing was conducted in the Baseline noise condition first followed by the Continuous and Interrupted noises in a randomly selected order. Eight 64-trial runs were presented at each condition. The first three runs used the tokens from the training set and the final five runs used the tokens from the test set. On each trial of a run, one of the 64 processed tokens (from either the training or test set) was selected randomly without replacement. Depending upon the noise condition, a randomly-selected noise segment of duration equal to that of the speech token was scaled to achieve the desired SNR and then added to the speech token. The resulting stimulus was processed and then presented to the listener for identification. Trial-by-trial correct-answer feedback was not provided. Further procedural details are available in Léger et al. (2015b). The length of time between the current sessions and original data collection of the U, T1, and E conditions as reported by Léger et al. (2015b) ranged from 7 to 17 months across the listeners. After the experiment had been carried out on the P conditions, the E/T1 processing was then developed as a means of eliminating TFS cues in addition to minimizing variations in level. Thus, the P conditions were tested before the E/T1 conditions.
The three training runs and the first test run were considered as practice. The final four test runs were retained for analysis. For each listener, a 16 × 16 stimulus-response confusion matrix was generated for each 64-trial run and added across the final 4 runs (for a total of 256 trials). The percent-correct score was calculated for each of the three noise conditions (where chance performance was 6.25%-correct). NMR was calculated from these percent-correct scores as defined in Eq. (1) above.
III. RESULTS
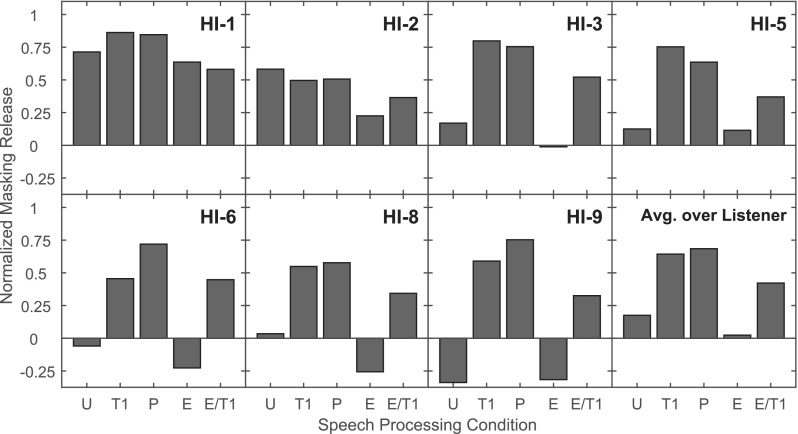
Percent-correct scores (where chance performance= 6.25%-correct) are shown for individual listeners and means across listeners in Fig. 6. The speech levels and SNRs used in the testing are provided in the panels for each individual listener. Scores are provided for each of the five speech types under each of the three noise conditions. The shaded bars depict the difference between the Interrupted and Continuous noise scores (representing MR in percentage points). Mean scores averaged across listeners indicate that higher scores were obtained for U speech compared to the other four speech types in the Baseline and Continuous noise conditions. For Interrupted noise, U scores were similar to those of T1 and P but somewhat higher than those of E and E/T1. MR was small for U and E speech (speech with the original amplitude modulations) compared to that seen for T1, P, and E/T1 speech (speech with reduced amplitude modulations).
Further comparisons were examined within each of two groups. Group 1, consisting of U, T1, and P, contains the processing conditions that preserve TFS information. Group 2, consisting of E and E/T1, contains the processing conditions that do not preserve TFS information. By comparing performance within these groups separately, the analysis could focus on the role of amplitude variation regardless of the availability of TFS cues.
The results of a two-way repeated measures analysis of variance (ANOVA) on rationalized arcsine units (RAU)-transformed percent-correct scores (Studebaker, 1985) for Group 1 conditions indicated a significant effect of speech type [F(2,48) = 11.53, p = 0.0001] and noise condition [F(2,48) = 88.67, p < 0.0001] as well as their interaction [F(4,48) = 2.62, p = 0.046]. Post hoc multiple comparisons tests (Tukey-Kramer at the 0.05 level of significance) indicated that U speech scores were significantly higher than T1 and P scores, which were not significantly different from each other, and that scores with the Baseline noise were significantly higher than those with Interrupted noise, which in turn were significantly higher than those with Continuous noise. The post hoc comparison on the interaction between speech type and noise condition indicated no significant differences between the T1 and P scores on any of the noise conditions; T1 and P had significantly lower scores than U in the Baseline and Continuous noise conditions.
A two-way repeated-measures ANOVA conducted on RAU scores for Group 2 indicated a significant effect of noise condition [F(2,30) = 95.31, p < 0.0001] but not of speech type [F(1,30) = 2.29, p = 0.14]. Although a tendency was observed for lower Continuous noise scores and higher Interrupted noise scores for E/T1 compared to E speech, the interaction of speech type by noise condition did not reach significance [F(2,30) = 3.01, p = 0.06].
The data were also examined in terms of NMR, shown in Fig. 7. Comparing Group 1 conditions, average results (shown in the bottom-right panel) indicate lower values of NMR for U (0.17) than for T1 and P speech (0.64 and 0.68, respectively). A one-way ANOVA indicated a significant effect of speech type [F(2,12) = 11.99, p = 0.001)], and a Tukey-Kramer post hoc test indicated significantly higher values of NMR for T1 and P compared to U speech. Comparing Group 2 results, average scores indicated higher NMR for E/T1 (0.42) compared to E (0.02) speech, as confirmed by a one-way ANOVA [F(1,6) = 13.69, p = 0.01)].
FIG. 7.
(Color online) Normalized masking release (NMR) for each of the five types of speech (U, T1, P, E, and E/T1). Seven panels show results for individual HI listeners and one panel shows averages across listeners.
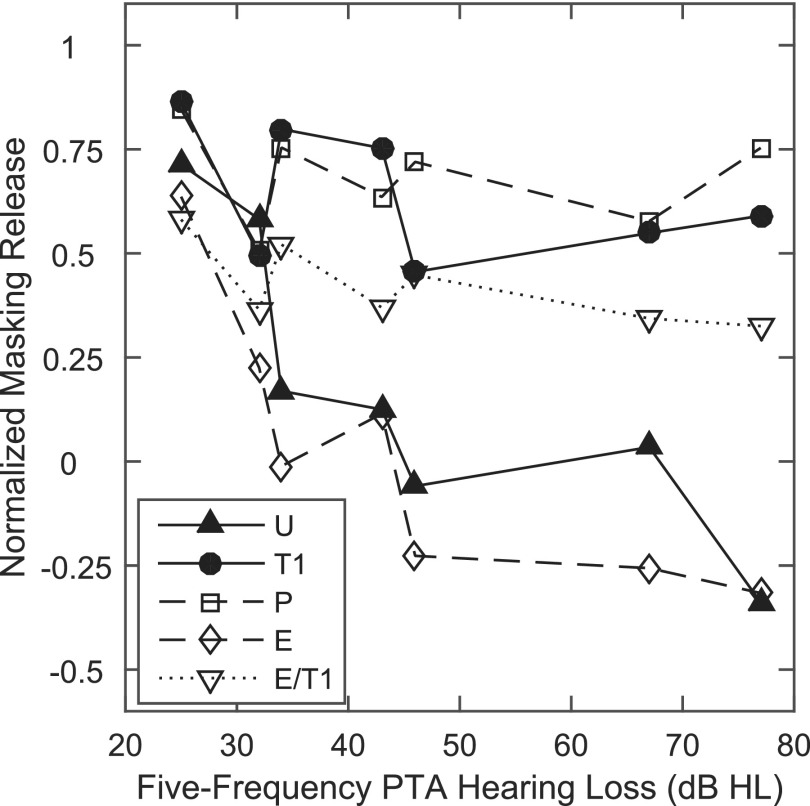
The relation between NMR for all five types of speech and degree of hearing loss is shown in Fig. 8 where NMR is plotted as a function of the five-frequency PTA. Although the listening conditions varied across HI individuals (e.g., in terms of speech and noise levels and NAL gain), it is nonetheless reasonable to compare NMR values across listeners. The SNR was chosen for each listener to yield roughly 50%-correct performance for U speech in Continuous noise, and the NMR was computed using the Baseline, Continuous, and Interrupted scores within a given listener [see Eq. (1)]. For both U and E speech, there was a significant, strong, negative correlation between NMR and PTA (ρ = −0.85, for U and ρ = −0.83 for E, both p < 0.05), indicating that NMR decreased with an increase in hearing loss. The correlations of PTA with NMR did not reach significance for T1 (ρ = −0.45, p = 0.30), P (ρ = −0.13, p = 0.79), or E/T1 (ρ = −0.73, p = 0.06) speech.
FIG. 8.
NMR for each of the five types of speech (U, T1, P, E, and E/T1) plotted as a function of the five-frequency PTA in dB HL (defined in text) for each of the seven HI listeners. For each speech condition, symbols are linked by lines for visual guidance.
IV. DISCUSSION
Performance on T1 and P speech (which remove or highly restrict amplitude variation) was highly similar and both showed substantial NMR, greater than that observed on U speech. However, both T1 and P retain TFS cues, making it difficult to ascertain the source of the increased NMR. Thus, we included conditions (E and E/T1) which eliminated zero-crossing information but contrasted the extent of amplitude variation. Moderate NMR was observed for E/T1, while NMR was close to zero for E. These results clearly indicate that the removal of amplitude variation resulted in a significant increase in NMR. This finding supports our hypothesis that the NMR observed by Léger et al. (2015b) for T1 speech arises due to the removal of global amplitude variation (see Figs. 3 and 5) rather than due to more effective transmission of TFS using Hilbert-transform TFS processed stimuli.
The increase in NMR for the T1, P, and E/T1 conditions relative to U and E arises due to a combination of effects. Continuous noise scores for T1, P, and E/T1 were substantially lower than those for U and E (by 17 percentage points on average), and Interrupted noise scores were slightly higher (by 3 percentage points on average). The decrease in Continuous noise performance may be related to the degradation of speech cues arising from the various processing schemes or from modulation masking (and release from it) for certain processing conditions but not others. The performance in Interrupted noise exceeded that in Continuous noise for the three conditions with reduced level variability which may suggest greater audibility in the gaps of the Interrupted noise for these conditions. This argument is weakened, however, by the similarity of these Interrupted scores to those obtained for U speech.
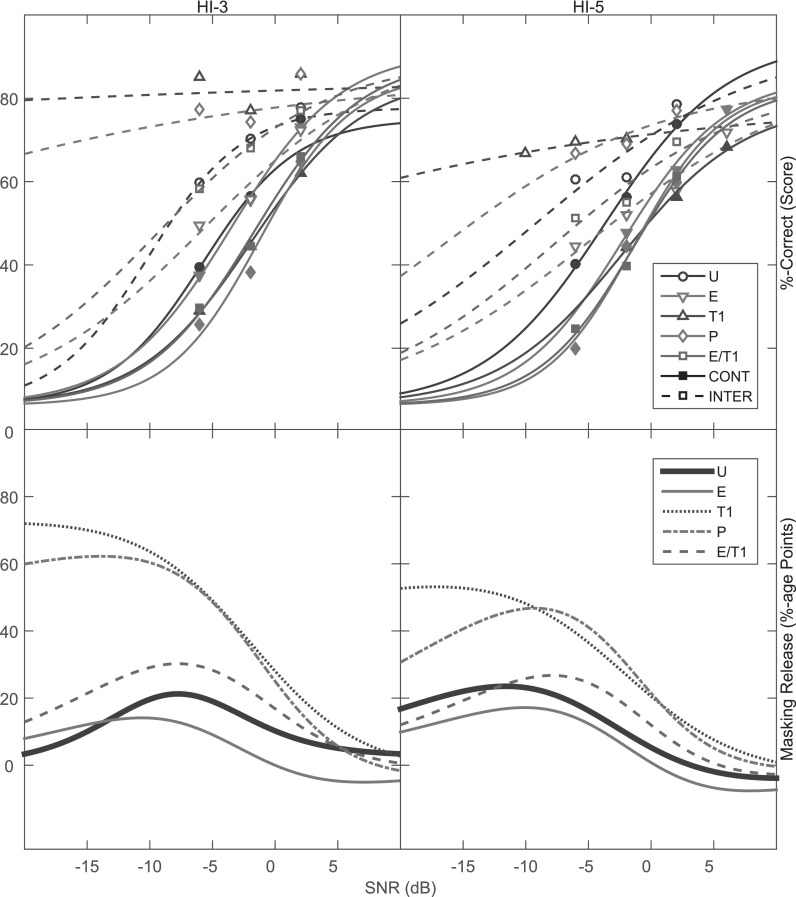
In the experimental design used here, NMR values were obtained at an SNR selected for each individual HI to yield scores of roughly 50%-correct for U speech in Continuous noise. Previous research (e.g., Bernstein and Grant, 2009; Oxenham and Simonson, 2009; Desloge et al., 2010) has shown a tendency for an increase in MR as SNR decreases and for MR to disappear at SNR >0 dB. To examine the role of the specific SNRs employed here on MR for the different types of speech processing, performance was measured on two of the HI listeners (HI-3 and HI-5) at several additional values of SNR. These results are shown in Fig. 9 (top panels) where the %-correct scores for each of the five speech types in Continuous or Interrupted noise have been fit with sigmoidal functions. These data indicate that the shapes of the functions were similar for all speech types in the Continuous noise but showed differences among speech types in the Interrupted noise. For HI-3, for example, the functions for T1 and P processing in Interrupted noise were more shallow (i.e., more resistant to noise) than those for the three other speech types. The difference between the sigmoidal fits for Interrupted versus Continuous noise is shown in the bottom panels of Fig. 9, where MR in percentage points is plotted as a function of SNR. These plots indicate higher MR for T1 and P compared to U as well as higher MR for E/T1 compared to E across a wide range of SNR. Furthermore, the maximum MR observed on the U curve is roughly 20 percentage points at SNRs in the vicinity of −12 to −7 dB across both listeners while similar levels of MR occurred at SNRs that were roughly 6 to 10 dB higher for T1, P, and E/T1. Thus, our conclusions regarding the effects of the different processing types generally would not have been affected either by testing at more adverse SNRs than were employed in the main experiment or by adjusting SNR to yield equivalent performance in Continuous noise for each speech type.
FIG. 9.
(Color online) Psychometric functions (top panels) and MR (bottom panels) for the five types of speech (U, T1, P, E, and E/T1). Percent-correct consonant identification scores are plotted as a function of SNR in dB in Continuous and Interrupted noise in the two upper panels for listeners HI-3 and HI-5. Also shown are sigmoidal fits to the data for each speech/noise combination. The lower end of the sigmoidal function was limited by chance performance of 6.25%-correct and the asymptote was derived from scores in the Baseline conditions. MR, defined as the difference in percentage points between the sigmoidal fits for Interrupted and Continuous noise for each speech type, is shown in the two lower panels.
Further evidence for a dependence of NMR on the degree of level variability in the speech stimulus comes from the correlations observed in Fig. 8 between PTA and NMR. When amplitude modulations are present (as in U and E speech), NMR is correlated with hearing loss. For both of these types of speech, NMR is substantial for listeners with NH and mild hearing loss (Léger et al., 2015b), but decreases to minimal (and even negative) values with moderate-to-severe levels of loss. When amplitude modulations are largely removed (as in T1, P, and E/T1 speech), on the other hand, NMR is not correlated with hearing loss. In these cases, amplification of speech present in the gaps helps HI listeners (regardless of the degree of hearing loss) to make better use of the speech signal. These results suggest that the NMR observed in the current study is not related to the presence of TFS cues versus envelope cues. Instead, it appears to be related to a decrease in the range of stimulus levels regardless of the TFS cues conveyed by the speech signal. Even with the greater NMR observed here for T1, P, and E/T1 speech, however, there is still room for improvement in the performance of HI listeners in noise (i.e., NMR does not approach 1.0 as it does for NH listeners).
Effects of age may also be considered here, as 5 of the HI listeners were between the ages of 20 and 32 yrs while HI-6 and HI-8 were 66 and 75 yrs old, respectively. There is some indication that the older HI listeners required a higher SNR to achieve 50%-correct scores for U speech in continuous noise. For example, the PTA of HI-6 was similar to that of HI-5 (22 yrs old); however, HI-6 required an SNR of +2 dB to achieve this criterion performance while HI-5 required an SNR of −2 dB. Similarly, HI-8 may be compared to HI-9 (22 yrs old). Again, these two listeners had similar values of PTA but HI-8 required an SNR (+5 dB) that was 4 dB higher than that of HI-9 (+1 dB) to achieve the criterion. The higher SNRs required for older listeners are consistent with the results of Füllgrabe et al. (2015) who reported lower consonant-identification scores for older compared to younger NH listeners in both modulated and unmodulated noises over a wide range of SNR; these authors, however, did not find any differences in the size of modulation MR as a function of age. Our results are also consistent with a lack of effect of age on MR. As can be observed in Fig. 7, the patterns of NMR across different speech types were similar for pairs of older and younger HI listeners with similar PTA.
At first glance, the removal of amplitude variation from the T1, P, and E/T1 speech types may appear similar to the processing employed in amplitude compression (e.g., Lippmann et al., 1981; De Gennaro et al., 1986), which aims to fit speech into the reduced dynamic range of a listener with sensorineural hearing loss. Specifically, compression amplifies weaker sounds more than intense sounds. This differs from the signals studied here with reduced variations in overall amplitude regardless of absolute level. Furthermore, compression aids have not been shown to produce substantial benefits for HI listeners for speech reception in noise compared to non-compressive aids. A detailed study by Houben (2006) of a wide range of parameters associated with compression (e.g., number of frequency bands to which compression is applied, attack and release times, and knee of compression) did not show any improvement for HI listeners in fluctuating versus continuous noise backgrounds.
While the tendency of the T1, P, and E/T1 techniques (that remove amplitude variation) to decrease consonant recognition in Continuous noise renders these techniques impractical for real-world applications, the associated NMR achieved with these techniques indicates a genuine benefit for listening in interrupted noise and suggests that further research in this area is merited.
V. CONCLUSIONS
-
•
MR was observed in HI listeners for T1, P, and E/T1 speech (which were processed to remove amplitude variation while retaining the same overall signal energy), while little or no MR was observed for U and E speech (which exhibited amplitude variation).
-
•
The MR observed for E/T1 speech (which retains no original TFS or broadband envelope cues, but does contain narrowband envelope cues that can be recovered by the auditory system) provides evidence that MR arises primarily due to the removal of amplitude variation and not to the presence of residual TFS cues.
ACKNOWLEDGMENTS
This research was supported by the National Institute on Deafness and Other Communication Disorders of the National Institutes of Health under Award No. R01DC000117. The authors wish to thank Laura D'Aquila for the development of Matlab code for calculating the crest factors. The content is solely the responsibility of the authors and does not necessarily represent the official views of the National Institutes of Health.
Portions of this research were presented at the 42nd Annual Scientific & Technology Conference of the American Auditory Society, Scottsdale, AZ, March 5–7, 2015.
Footnotes
The signal processing is described as if it were applied to the speech component alone. It was applied to the sum of the speech and the noise components.
In fact, perceptual studies suggest that the reception of TFS speech created using the Hilbert transform depends strongly on the use of “recovered envelopes” that are available within narrow filter bands for both NH (Swaminathan et al., 2014) and HI (Léger et al., 2015a, 2015b) listeners. As explained by Ghitza (2001), when Hilbert-transform TFS speech is passed through sufficiently narrow filters, envelope cues (which reflect the spectro-temporal structure of the original speech) re-emerge. Speech reception for recovered envelope speech—generated using these envelopes—is highly similar to that for the TFS speech itself.
Swaminathan et al. (2014) used neural metrics developed by Heinz and Swaminathan (2009) to determine whether fine-structure cues were present in a 40-band envelope signal recovered from a 16-band TFS signal. The cross-correlation in TFS between these two signals was minimal (approximately 0.1) across all frequencies, indicating that TFS cues were absent in the recovered envelope signal. The results of this analysis can be extended to apply to the 40-band envelope signal studied here.
References
- 1. Bacon, S. P. , Opie, J. M. , and Montoya, D. Y. (1998). “ The effects of hearing loss and noise masking on the masking release in temporally complex backgrounds,” J. Speech Hear. Res. 41, 549–563. 10.1044/jslhr.4103.549 [DOI] [PubMed] [Google Scholar]
- 2. Bernstein, J. G. W. , and Brungart, D. S. (2011). “ Effects of spectral smearing and temporal fine-structure distortion on the fluctuating-masker benefit for speech at a fixed signal-to-noise ratio,” J. Acoust. Soc. Am. 130, 473–488. 10.1121/1.3589440 [DOI] [PMC free article] [PubMed] [Google Scholar]
- 3. Bernstein, J. G. W. , and Grant, K. W. (2009). “ Auditory and auditory-visual intelligibility of speech in fluctuating maskers for normal-hearing and hearing-impaired listeners,” J. Acoust. Soc. Am. 125, 3358–3372. 10.1121/1.3110132 [DOI] [PubMed] [Google Scholar]
- 4. Cooke, M. (2006). “ A glimpsing model of speech perception in noise,” J. Acoust. Soc. Am. 119, 1562–1573. 10.1121/1.2166600 [DOI] [PubMed] [Google Scholar]
- 5. De Gennaro, S. , Braida, L. D. , and Durlach, N. I. (1986). “ Multichannel syllabic compression for severely impaired listeners,” J. Rehab. Res. Devel. 23, 17–24. [PubMed] [Google Scholar]
- 6. Desloge, J. G. , Reed, C. M. , Braida, L. D. , Perez, Z. D. , and Delhorne, L. A. (2010). “ Speech reception by listeners with real and simulated hearing impairment: Effects of continuous and interrupted noise,” J. Acoust. Soc. Am. 128, 342–359. 10.1121/1.3436522 [DOI] [PMC free article] [PubMed] [Google Scholar]
- 7. Dillon, H. (2001). Hearing Aids ( Thieme, New York), pp. 239–247. [Google Scholar]
- 8. Drullman, R. (1995). “ Temporal envelope and fine structure cues for speech intelligibility,” J. Acoust. Soc. Am. 97, 585–592. 10.1121/1.413112 [DOI] [PubMed] [Google Scholar]
- 9. Festen, J. M. , and Plomp, R. (1990). “ Effects of fluctuating noise and interfering speech on the speech-reception threshold for impaired and normal hearing,” J. Acoust. Soc. Am. 88, 1725–1736. 10.1121/1.400247 [DOI] [PubMed] [Google Scholar]
- 10. Freyman, R. L. , Griffin, A. M. , and Oxenham, A. J. (2012). “ Intelligibility of whispered speech in stationary and modulated noise maskers,” J. Acoust. Soc. Am. 132, 2514–2523. 10.1121/1.4747614 [DOI] [PMC free article] [PubMed] [Google Scholar]
- 11. Füllgrabe, C. , Moore, B. C. J. , and Stone, M. A. (2015). “ Age-group differences in speech identification despite matched audiometrically normal hearing: Contributions from auditory temporal processing and cognition,” Front. Aging Neurosci. 6, 347. 10.3389/fnagi.2014.00347 [DOI] [PMC free article] [PubMed] [Google Scholar]
- 12. Ghitza, O. (2001). “ On the upper cutoff frequency of the auditory critical-band envelope detectors in the context of speech perception,” J. Acoust. Soc. Am. 110, 1628–1640. 10.1121/1.1396325 [DOI] [PubMed] [Google Scholar]
- 13. Gilbert, G. , and Lorenzi, C. (2006). “ The ability of listeners to use recovered envelope cues from speech fine structure,” J. Acoust. Soc. Am. 119, 2438–2444. 10.1121/1.2173522 [DOI] [PubMed] [Google Scholar]
- 14. Gregan, M. J. , Nelson, P. B. , and Oxenham, A. J. (2013). “ Behavioral measures of cochlear compression and temporal resolution as predictors of speech masking release in hearing-impaired listeners,” J. Acoust. Soc. Am. 134, 2895–2912. 10.1121/1.4818773 [DOI] [PMC free article] [PubMed] [Google Scholar]
- 15. Heinz, M. G. , and Swaminathan, J. (2009). “ Quantifying envelope and fine-structure coding in auditory nerve responses to chimaeric speech,” J. Assoc. Res. Otolaryngol. 10, 407–423. 10.1007/s10162-009-0169-8 [DOI] [PMC free article] [PubMed] [Google Scholar]
- 16. Hopkins, K. , and Moore, B. C. J. (2009). “ The contribution of temporal fine structure to the intelligibility of speech in steady and modulated noise,” J. Acoust. Soc. Am. 125, 442–446. 10.1121/1.3037233 [DOI] [PubMed] [Google Scholar]
- 17. Houben, R. (2006). “ The effect of amplitude compression on the perception of speech in noise by the hearing impaired,” Doctoral Dissertation, Utrecht University, The Netherlands. [Google Scholar]
- 18. Léger, A. C. , Desloge, J. G. , Braida, L. D. , and Swaminathan, J. (2015a). “ The role of recovered envelope cues in the identification of temporal-fine-structure speech for hearing-impaired listeners,” J. Acoust. Soc. Am. 137, 505–508. 10.1121/1.4904540 [DOI] [PMC free article] [PubMed] [Google Scholar]
- 19. Léger, A. C. , Reed, C. M. , Desloge, J. G. , Swaminathan, J. , and Braida, L. D. (2015b). “ Consonant identification in noise using Hilbert-transform temporal fine-structure speech and recovered-envelope speech for listeners with normal and impaired hearing,” J. Acoust. Soc. Am. 138, 389–403. 10.1121/1.4922949 [DOI] [PMC free article] [PubMed] [Google Scholar]
- 20. Licklider, J. C. R. , and Pollack, I. (1948). “ Effects of differentiation, integration, and infinite peak clipping upon the intelligibility of speech,” J. Acoust. Soc. Am. 20, 42–51. 10.1121/1.1906346 [DOI] [Google Scholar]
- 21. Lippman, R. P. , Braida, L. D. , and Durlach, N. I. (1981). “ Study of multichannel amplitude compression and linear amplification for persons with sensorineural hearing loss,” J. Acoust. Soc. Am. 69, 524–534. 10.1121/1.385375 [DOI] [PubMed] [Google Scholar]
- 22. Moore, B. C. J. , Peters, R. W. , and Stone, M. A. (1999). “ Benefits of linear amplification and multichannel compression for speech comprehension in backgrounds with spectral and temporal dips,” J. Acoust. Soc. Am. 105, 400–411. 10.1121/1.424571 [DOI] [PubMed] [Google Scholar]
- 23. Oxenham, A. J. , and Kreft, H. A. (2014). “ Speech perception in tones and noise via cochlear implants reveals influence of spectral resolution on temporal processing,” Trends Hear. 18, 1–14. 10.1177/2331216514553783 [DOI] [PMC free article] [PubMed] [Google Scholar]
- 24. Oxenham, A. J. , and Simonson, A. M. (2009). “ Masking release for low- and high-pass-filtered speech in the presence of noise and single-talker interference,” J. Acoust. Soc. Am. 125, 457–468. 10.1121/1.3021299 [DOI] [PMC free article] [PubMed] [Google Scholar]
- 25. Phatak, S. , and Grant, K. W. (2014). “ Phoneme recognition in vocoded maskers by normal-hearing and aided hearing-impaired listeners,” J. Acoust. Soc. Am. 136, 859–866. 10.1121/1.4889863 [DOI] [PubMed] [Google Scholar]
- 26. Shannon, R. V. , Jensvold, A. , Padilla, M. , Robert, M. E. , and Wang, X. (1999). “ Consonant recordings for speech testing,” J. Acoust. Soc. Am. 106, L71–L74. 10.1121/1.428150 [DOI] [PubMed] [Google Scholar]
- 27. Stone, M. A. , Füllgrabe, C. , and Moore, B. C. J. (2012). “ Notionally steady background noise acts primarily as a modulation masker of speech,” J. Acoust. Soc. Am. 132, 317–326. 10.1121/1.4725766 [DOI] [PubMed] [Google Scholar]
- 28. Studebaker, G. A. (1985). “ A ‘rationalized' arcsine transform,” J. Speech Lang. Hear. Res. 28, 455–462. 10.1044/jshr.2803.455 [DOI] [PubMed] [Google Scholar]
- 29. Swaminathan, J. , Reed, C. M. , Desloge, J. G. , Braida, L. D. , and Delhorne, L. A. (2014). “ Consonant identification using temporal fine structure and recovered envelope cues,” J. Acoust. Soc. Am. 135, 2078–2090. 10.1121/1.4865920 [DOI] [PMC free article] [PubMed] [Google Scholar]
- 30. Zurek, P. M. , and Delhorne, L. A. (1987). “ Consonant reception in noise by listeners with mild and moderate hearing impairment,” J. Acoust. Soc. Am. 82, 1548–1559. 10.1121/1.395145 [DOI] [PubMed] [Google Scholar]


