

Abstract
Osteoclasts are multinucleated giant cells that resorb bone, ensuring development and continuous remodelling of the skeleton and the bone marrow haematopoietic niche. Defective osteoclast activity leads to osteopetrosis and bone marrow failure1–9, whereas excess activity can contribute to bone loss and osteoporosis10. Osteopetrosis can be partially treated by bone marrow transplantation in humans and mice11–18, consistent with a haematopoietic origin of osteoclasts13,16,19 and studies suggesting that they develop by fusion of monocytic precursors derived from haematopoietic stem cells in the presence of CSF1 and RANK ligand1,20. However, the developmental origin and lifespan of osteoclasts, and the mechanisms that ensure maintenance of osteoclast function throughout life in vivo remain largely unexplored. Here we report that osteoclasts that colonize fetal ossification centres originate from embryonic erythro-myeloid progenitors21,22. These erythro-myeloid progenitor-derived osteoclasts are required for normal bone development and tooth eruption. Yet, timely transfusion of haematopoietic stem cells derived monocytic cells in newborn mice is sufficient to rescue bone development in early-onset autosomal recessive osteopetrosis. We also found that the postnatal maintenance of osteoclasts, bone mass and the bone marrow cavity involve iterative fusion of circulating blood monocytic cells with long-lived osteoclast syncytia. As a consequence, parabiosis or transfusion of monocytic cells results in long-term gene transfer in osteoclasts in the absence of haematopoietic stem cell chimerism, and can rescue an adult-onset osteopetrotic phenotype caused by cathepsin K deficiency23,24. In sum, our results identify the developmental origin of osteoclasts and a mechanism that controls their maintenance in bones after birth. These data suggest new strategies to rescue osteoclast deficiency in osteopetrosis and to modulate osteoclast activity in vivo.
In vitro, osteoclasts arise by fusion of haematopoietic stem cell (HSC)-derived precursors and require expression of Csf1r and Tnfrsf11a (also known as Rank). To probe the origin of osteoclasts in vivo we first generated Csf1rCre;Csf1rfl/fl and Csf1rCre;Tnfrsf11afl/fl mice. These mice presented with an osteopetrotic phenotype similar to Csf1op/op (ref. 5), Csf1r6 and Tnfrsf11a3 mutants, characterized in young mice by lack of teeth eruption, skull and skeletal deformities with shortness of long bones, increased bone density, and lack of osteoclasts and haematopoietic cells (Fig. 1a, Extended Data Fig. 1). To confirm that osteoclast differentiation requires expression of Tnfrsf11a and Csf1r in HSC-derived precursors, we generated Flt3Cre;Tnfrsf11afl/fl, Flt3Cre;Csf1rfl/fl and Vav1Cre;Csf1rfl/fl mice. Surprisingly, the young mutant mice had normal teeth, bone morphology, bone marrow cellularity and osteoclast numbers in comparison to control littermates (Fig. 1b–d, Extended Data Fig. 2). However, Flt3Cre;Tnfrsf11afl/fl, Flt3Cre;Csf1rfl/fl and VavCre;Csf1rfl/fl mice lost their osteoclasts over time (Fig. 1d), and by 22–60 weeks of age had increased trabecular bone density (Fig. 1e) and decreased haematopoietic cell numbers in the long bones (Fig. 1c, Extended Data Fig. 2), and 3D X-ray imaging by micro-computed tomography (micro-CT) confirmed the increased bone mass, whereas bone formation—measured by calcein incorporation—was similar to that in control mice (Fig. 1f, Extended Data Fig. 3). In addition, tartrate resistant acid phosphatase-positive (TRAP+) multinucleated cells that appear at embryonic day (E)15 in ossification centres25 in Csf1rCre;Rosa26LSL-YFP mice were labelled with YFP, and osteoclasts remained YFP-positive throughout life (Fig. 1g, Extended Data Fig. 4), but gained expression of YFP after birth in Flt3Cre;Rosa26LSL-YFP mice despite colonization of the fetal bone marrow by Flt3Cre+ YFP+ haematopoietic cells (Fig. 1h, Extended Data Fig. 4).
Fig. 1 |. HSC-derived precursors are dispensable for osteoclasts and bone development.

a, Representative photographs of teeth of three-to-four-week-old Csf1rCre;Csf1rfl/fl mice (top left), Csf1rCre;Tnfrsf11afl/fl mice (top middle) and control littermates. Bottom left, representative photographs of leg bones from controls and Csf1rCre;Tnfrsf11afl/fl mice; white arrowhead highlights the lack of blood cells. Bottom middle, osteoclast numbers in E18.5, P7, and four-week-old Csf1rCre;Tnfrsf11afl/fl mice (n = 3) and control littermates (n = 3), and representative haematoxylin and TRAP staining of femur sections; the arrow indicates an osteoclast. b, Representative photographs of teeth of three-to-four-week-old Flt3Cre;Tnfrsf11afl/fl, Flt3Cre;Csf1rfl/fl, VavCre;Csf1rfl/fl mice and littermates. c, Bone marrow CD45+ cell numbers in Flt3Cre;Tnfrsf11afl/fl and control littermates at 4 (top left, n = 4 Flt3Cre;Tnfrsf11afl/fl, n = 3 control) and 22 weeks of age (top right; n = 4 Flt3Cre;Tnfrsf11afl/fl, n = 5 control) and VavCre;Csf1rfl/fl and control littermates at 4 (bottom left; n = 8 VavCre;Csf1rfl/fl, n = 8 control) and 62 weeks of age (bottom right; n = 5 VavCre;Csf1rfl/fl, n = 8 control), Cre- black Cre+ white. d, Osteoclast counts in femurs from Flt3Cre;Tnfrsf11afl/fl (left), Flt3Cre;Csf1rfl/fl (middle) and VavCre;Csf1rfl/fl (right) mice and control littermates of the indicated ages, n numbers indicated on individual bars. e, Representative haematoxylin and TRAP staining of femur sections from 22-week-old Flt3Cre;Tnfrsf11afl/fl mice (top), 62-week-old VavDD/Cre;Csf1rfl/fl mice (bottom) and control littermates. The white arrowhead points to trabecular bone. f, Quantitative analysis of bone volume/total volume of humerus or femurs from Flt3Cre;Tnfrsf11afl/fl (n = 4), Flt3Cre;Csf1rfl/fl (n = 5) and control littermates (n = 8), and VavCre;Csf1rfl/fl (n = 5) mice and control littermates (n = 5) as determined by micro-CT. P values were determined by ANOVA. g, Expression and mean fluorescence intensity (MFI) of YFP in TRAP+ multinucleated cells from Csf1rCre;Rosa26LSL-YFP mice at E16.5, E18.5, P7 and six months (n = 3 per time point). For MFI and percentages, at least 100 osteoclasts were quantified per time point and genotype. Box plots show the median, box edges show the first and third quartiles and whiskers show the minimum and maximum. h, Similar analysis as in g, for Flt3Cre;Rosa26LSL-YFP mice at E16.5, E18.5, P7, 4 weeks (4 wk), 3 months (3 m) and 6 months (6 m). Data are mean ± s.d.; dots in graphs represent individual independent biological replicates; n indicates the number of mice per group. Statistical significance was analysed with GraphPad Prism using unpaired two-tailed t-tests unless otherwise indicated. *P < 0.05, **P < 0.01, ***P < 0.001 and ****P < 0.0001.
These data suggested that although postnatal contribution of HSC-derived cells is important for optimal osteoclast maintenance and function in adults and ageing mice, osteoclast development, tooth eruption and the development of bone and the bone marrow cavity require precursors that are independent from the HSC lineage. These precursors may originate from the embryonic erythro-myeloid progenitor (EMP) lineage of resident macrophages22,26,27, because Csf1rCre mice enable deletion of target genes in both the embryonic EMP lineage and in the HSC lineage, whereas Flt3Cre and VavCre (Extended Data Fig. 5) are not expressed in the EMP lineage. In support of this hypothesis, we found that TRAP+ multinucleated cells develop in ossification centres from Myb-deficient embryos around E15; at this stage the embryos lack HSCs but still support the development of EMP-derived macrophages26 (Fig. 2a, b). In addition, TRAP+ multinucleated cells are labelled with YFP in tamoxifen-inducible Csf1rMer-iCre-Mer;Rosa26LSL-YFP mice pulsed at E8.5 with a single dose of hydroxytamoxifen (4-OHT), which labels EMPs but not HSCs22,26,27 (Fig. 2c, d, Extended Data Fig. 4). Together, these results indicate that fetal osteoclasts arise from EMPs in ossification centres.
Fig. 2 |. EMP-derived osteoclasts are required for bone development.

a, MGC number in femur anlage ossification centres from E15.5–16.5 Myb−/− (n = 6) and littermate controls (n = 3). b, Representative confocal microscopy of frozen sections from the ossification centres in a, stained for TRAP and with TO-PRO-3 nuclear stain. c, Percentage of TRAP+ cells expressing YFP in femur anlage from E15.5 Csf1rMer-iCre-Mer;Rosa26LSL-YFP mice (n = 8) and Cre-negative controls (n = 5), pulsed at E8.5 with 4-OHT. d, Representative confocal microscopy of a sample from c. e, Representative teeth of cre+ Tnfrsf11aKoba-Cre;Csf1rfl/fl (top) and Tnfrsf11aWask-Cre;Csf1rfl/fl mice (bottom) and cre− control littermates. f, Leg bones from Tnfrsf11aCre;Csf1rfl/fl mice (cre+, n = 6) and control littermates (cre−, n = 6) at P7 and 4 weeks of age. Arrowhead highlights the colour of an area of bone. g, Representative micro-CT scans of long bones from mice in e (n = 6 per genotype). h, Skull length from three-week-old Csf1r−/− (n = 6) control littermates (n = 12) and Tnfrsf11aWask-Cre;Csf1rfl/fl mice (n = 4), as determined by micro-CT. i, Osteoclast counts in bone sections from E18.5, P7 and three-to-four-week old Tnfrsf11aCre;Csf1rfl/fl mice and littermate controls. j, Number of bone marrow CD45+ cells determined by flow cytometry of cells from four-week-old control (cre−) littermates, Tnfrsf11aKoba-Cre;Csf1rfl/fl (n = 9; n = 13 control) and Tnfrsf11aWask-Cre;Csf1rfl/fl (n = 23, n = 27 control) mice (cre+). Data are mean ± s.d.; dots in graphs represent individual mice; n indicates the number of mice per group; unpaired two-tailed t-tests. *P < 0.05, **P < 0.01, ***P < 0.001 and ****P < 0.0001.
We therefore investigated whether EMPs are required for bone development. Tnfrsf11a is expressed by osteoclasts, but its expression is also a hallmark of EMP-derived macrophage precursors that colonize the developing embryo27. In two independent lines of Tnfrsf11aCre knock-in mice, referred to as ‘Koba’ and ‘Wask’(Fig. 2e–j), Cre-mediated expression of a Rosa26LSL-YFP fluorescent reporter occurs with high efficiency in fetal macrophages but with low efficiency27 or not at all28 in HSCs and their progeny in blood and tissues27,28 (Extended Data Fig. 5). We therefore hypothesized that conditional deletion of Csf1r in Tnfrsf11aCre mice would recapitulate the macrophage deficiency observed in Csf1r-deficient mice6, while leaving the HSC lineage unaffected. To test osteoclast and bone development in this model, we generated Tnfrsf11aCre;Csf1rfl/fl mice (Fig. 2e–j). Tnfrsf11aCre;Csf1rfl/fl mice lacked tissue macrophages such as brain microglia and epidermal Langerhans cells at birth, whereas development of HSCs and blood cells was preserved (Extended Data Fig. 2). They exhibited a severe osteopetrotic phenotype, including a lack of tooth eruption (Fig. 2e), misshaped skulls and shorter long bones (Fig. 2f–h, Extended Data Fig. 1) with few osteoclasts (Fig. 2i) and increased bone density, and initially lacked a bone marrow cavity (Fig. 2f, Extended Data Fig. 2). In contrast to Csf1r-deficient mice, however, osteoclasts and haematopoietic cells progressively colonized the long bones of Tnfrsf11aCre;Csf1rfl/fl mice during the first month of life (Fig. 2i, Extended Data Figs. 1, 2), although the mice remained toothless and skull and long-bone deformity persisted (Fig. 2e–h, Extended Data Fig. 1). Calcein incorporation was similar in Tnfrsf11aCre;Csf1rfl/fl mice and their littermate controls (Extended Data Fig. 6). In a complementary approach, ablation of Csf1r expression in E10.5 embryos using a single dose of tamoxifen in Rosa26-creERT2+;Csf1rfl/− mice resulted in defective tooth eruption in three out of four pups at 21 days of age (Extended Data Fig. 5). Together, these analyses support a model in which EMP-derived embryonic osteoclasts are needed for teeth eruption, normal skull shape, optimal formation of long bones and the timely colonization of long bones by haematopoietic progenitors, whereas HSC-derived osteoclasts are important for the maintenance of bone mass after birth and later in life, although they may partially rescue bone development in the absence of EMP-derived osteoclasts in Tnfrsf11aCre;Csf1rfl/fl mice.
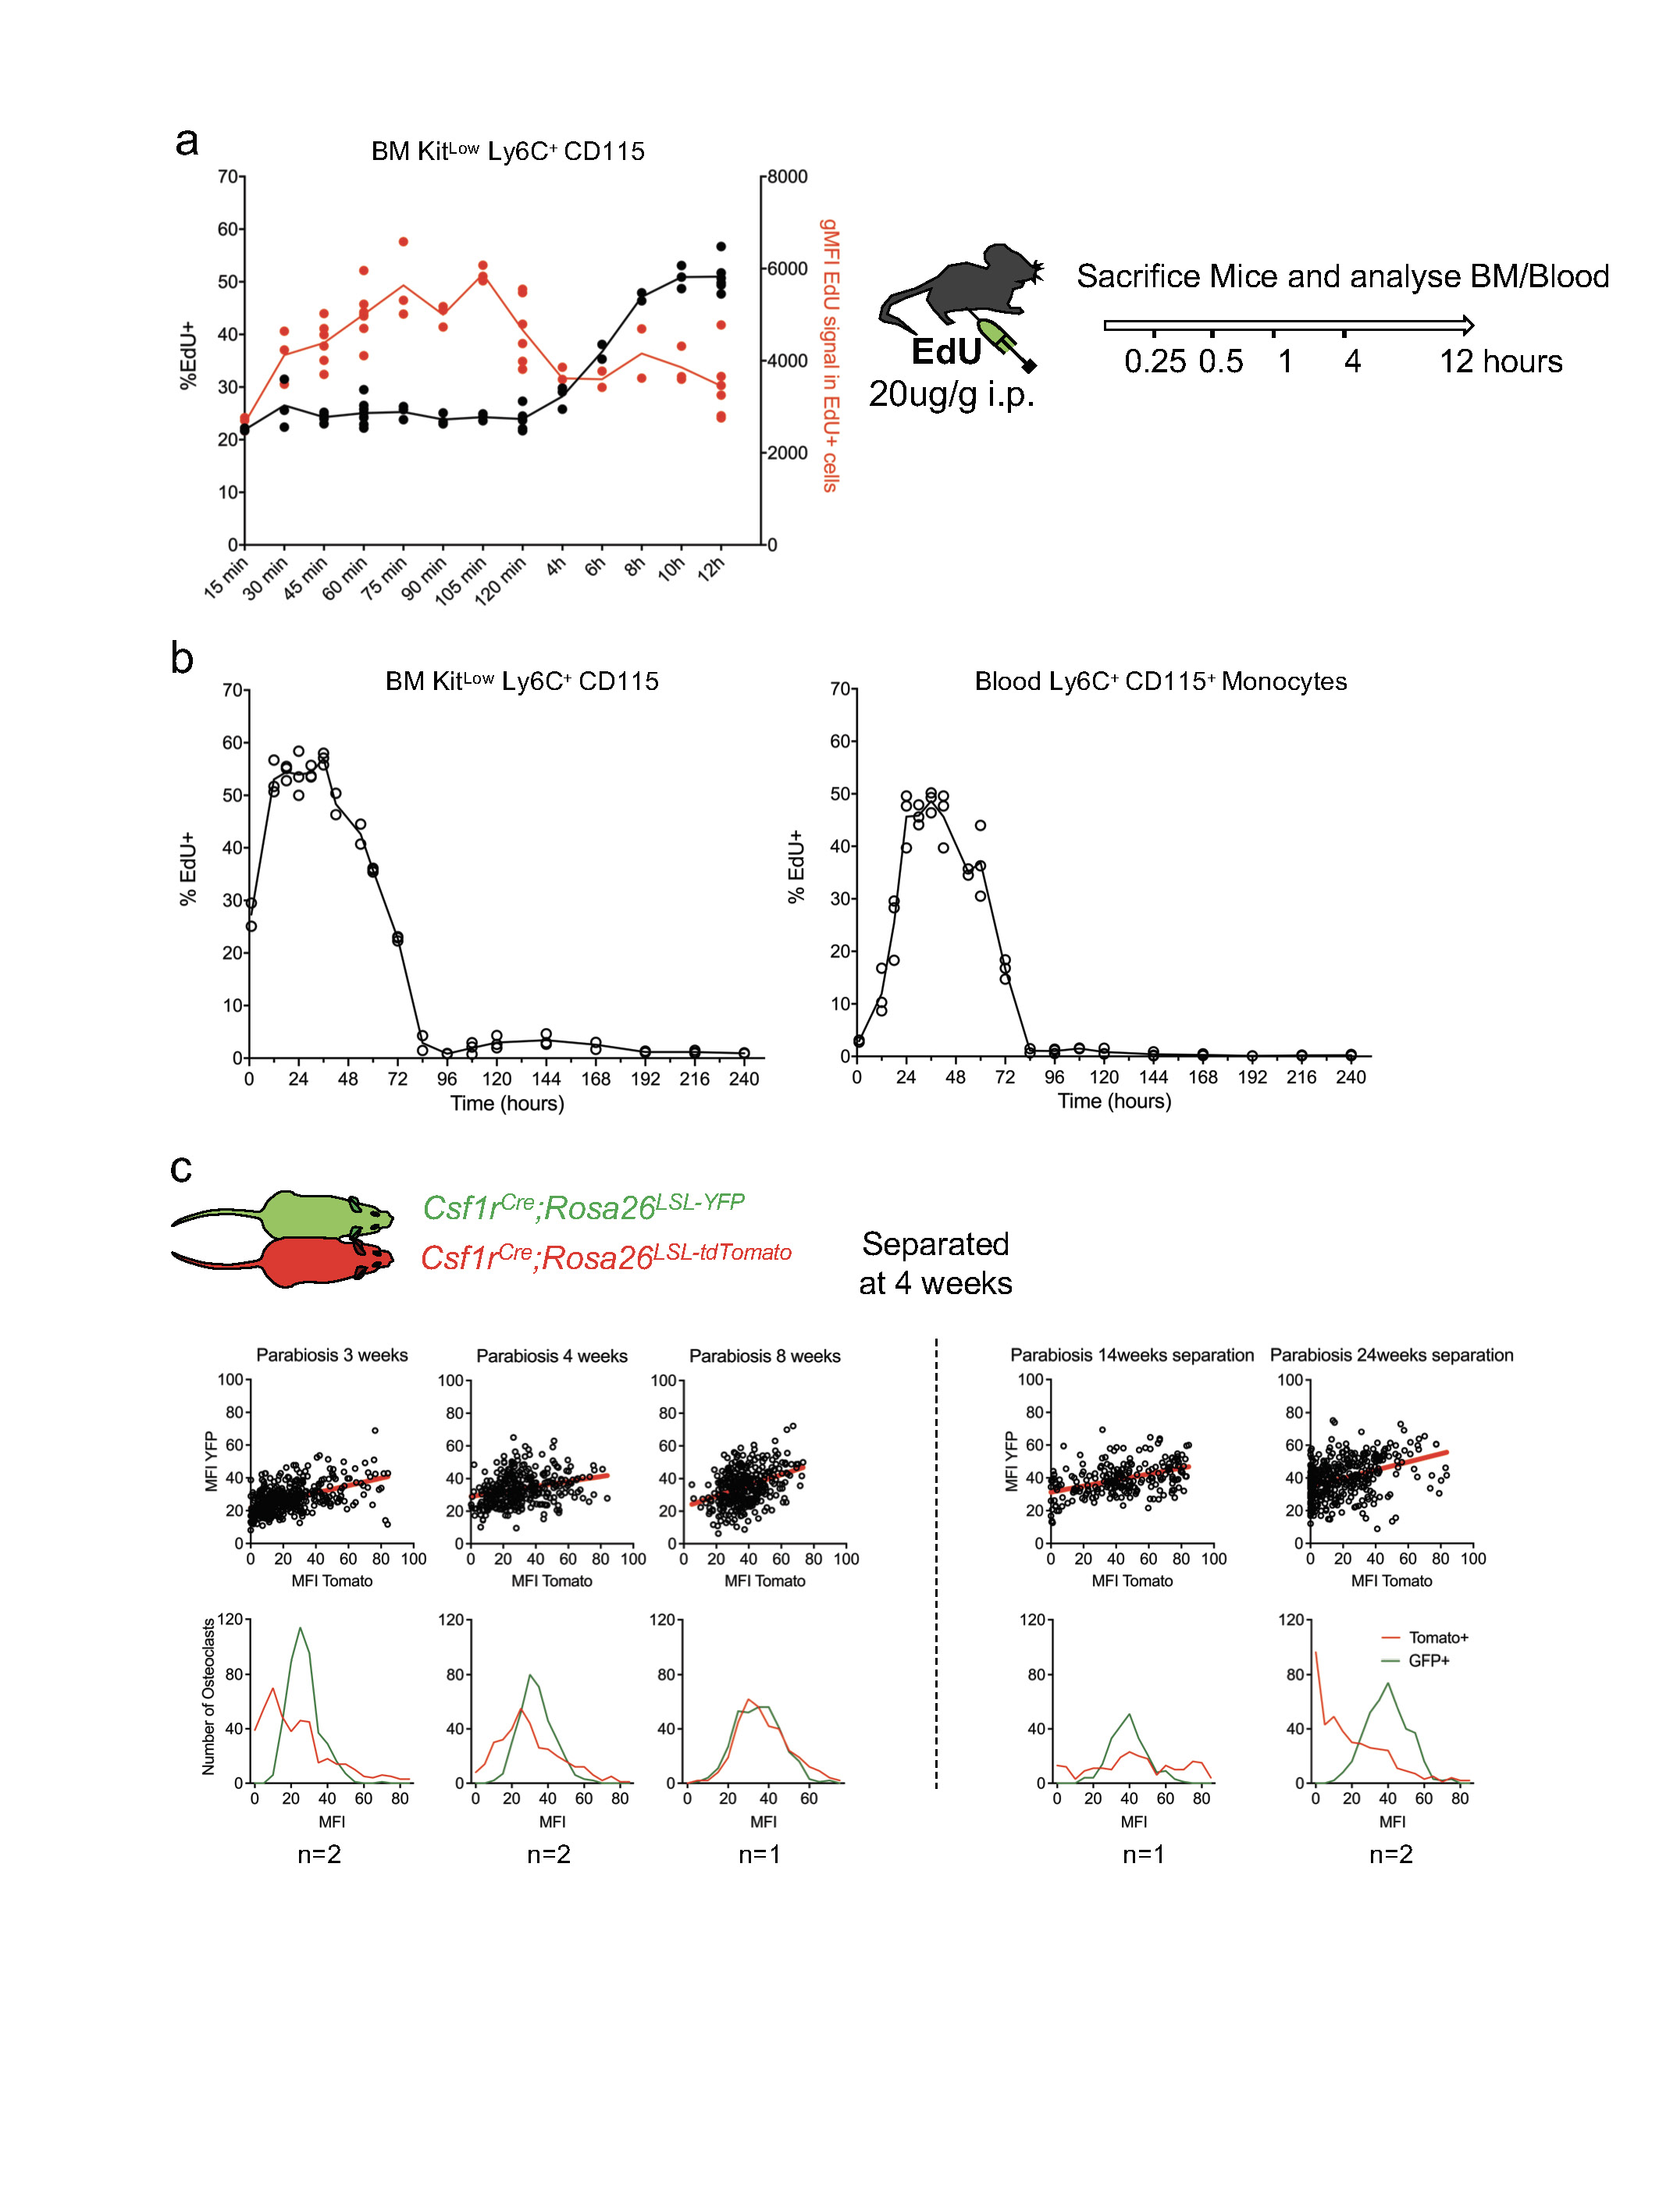
To probe the mechanisms that underlie the contribution of HSC-derived blood cells to osteoclast maintenance as well as the lifespan and dynamics of osteoclasts in vivo, we performed time-course parabiosis experiments (Fig. 3a). After four to eight weeks of shared blood circulation between Csf1rCre;Rosa26LSL-YFP and Csf1rCre;Rosa26LSL-tdTomato parabionts, all osteoclasts, defined as TRAP+ multinucleated cells lining the bone surface, expressed both YFP and tdTomato (Fig. 3a, b). No other cell type was found to co-express YFP and tdTomato in bones (Fig. 3b). This is consistent with the presence of nuclei from both partners in individual osteoclasts. Moreover, when parabionts were separated after four weeks (Fig. 3c), most recipient YFP+ osteoclasts retained tdTomato staining 14 weeks after separation, and two thirds of osteoclasts from former parabionts still expressed both YFP and tdTomato 24 weeks after separation (Fig. 3c). TdTomato signal intensity per YFP osteoclast increased during the eight-week period of shared blood circulation, and decreased after separation (Extended Data Fig. 7). Most mouse osteoclasts contained around five (range from three to seven) nuclei, with a modest increase of nuclei number per cell between one and six months of age (Fig. 3d). These data therefore suggest that individual osteoclast syncytia are long lived, but acquire new nuclei one at a time every four to eight weeks, from circulating blood cells; it therefore takes more than six months to renew all five nuclei in an individual osteoclast.
Fig. 3 |. In vivo dynamics of osteoclasts.

a, Parabiosis of Csf1rCre;Rosa26LSL-YFP mouse surgically paired with a Csf1rCre;Rosa26LSL-tdTomato partner for four-to-eight weeks. Representative confocal microscopy of frozen sections from the femur of a Csf1rCre;Rosa26LSL-YFP partner stained with antibodies for tdTomato (red) and YFP (green), ELF 97 (blue) and TOPRO-3 (grey). n = 3. b, Pie graphs showing the percentage of tdTomato+ (red), YFP+ (green) and tdTomato+YFP+ cells (yellow) among bone marrow mononuclear cells (MNC), megakaryocytes and multinuclear giant cells (MGC) from parabionts paired for the indicated time (n = 8). c, Similar analysis as in b for parabionts separated after four weeks and analysed 14 and 24 weeks after separation (n = 3). d, Bar graph showing number of nuclei per TRAP+ MGC in femurs from wild-type mice at one, three and six months of age (n = 3 mice per time point). e, Representative confocal microscopy of an EdU-labelled nucleus in a TRAP+ osteoclast (left) and histogram showing the percentage of TRAP+ osteoclasts with EdU-labelled nuclei and the number of labelled nuclei per cell 72 h after intravenous pulse-labelling with EdU (n = 5 mice). f, A model for development and maintenance of osteoclast syncytia. Data are mean ± s.d.; dots in graphs represent individual mice; n indicates the number of mice per group; two-way ANOVA with Tukey’s multiple comparisons test *P ≤ 0.05 and **P ≤ 0.005.
We calculated the number and fusion rate of HSC-derived nuclei acquired by osteoclasts in short-term 5-ethynyl-2′-deoxyuridine (EdU)-incorporation studies. A single intravenous pulse of EdU (20 μg g−1) labelled mitotic nuclei and was bioavailable in the bone marrow for around 90 min; approximately 50% of bone marrow and blood monocytic cells were EdU+ for around 48 h (Extended Data Fig. 7). We observed that approximately 1–2% of osteoclasts were labelled after 72 h, with only one EdU+ nucleus per osteoclast in 90% of EdU+ cells (Fig. 3e), suggesting that osteoclasts acquire a single post-mitotic nucleus at a time. In this model, 0.5–2% of osteoclasts per day acquire a new nucleus, compatible with individual nuclei being replaced about every two months. Together, these studies suggest a model (Fig. 3f) in which osteoclasts that control skeletal development mature in ossification centres from EMPs, whereas their post-natal maintenance is mediated by the serial acquisition by long-lived syncytia of new nuclei from HSC-derived blood leukocytes, rather than by de novo renewal by lateral fusion or proliferation of osteoclast precursors.
A prediction from this model, consistent with an early observation29, is that osteopetrosis due to a recessive mutation affecting osteoclast function may be rescued or prevented through parabiosis with a wild-type partner. Parabiosis experiments between four-week-old cathepsin K-deficient mice, which develop an adult-onset form of osteopetrosis known as pycnodysostosis23,24, and cathepsin K+/− or cathepsin K−/− littermates, and between wild-type mice as control, showed a reduction of bone volume in ten-week-old cathepsin K−/− mice paired with cathepsin K+/− littermates (Fig. 4a), suggesting that circulating blood cells carrying a wild-type cathepsin K allele are sufficient to reduce bone density. To confirm that expression of a donor-derived gene by recipient osteoclasts results from fusion with monocytic cells circulating in the blood, we performed intravenous injections of KIT−LY6C+ cells from the bone marrow of Csf1rCre;Rosa26LSL-tdTomato mice into Csf1rCre;Rosa26LSL-YFP recipients (Fig. 4b, Extended Data Fig. 8). This resulted in stable expression of tdTomato in 20–40% of osteoclasts one week and eight weeks after transfusion, in the absence of other donor-derived blood cells or bone marrow progenitors (Fig. 4b, c, Extended Data Fig. 8). These results suggest that parabiosis or an appropriate transfusion protocol can achieve expression of a donor-derived gene by recipient osteoclasts in the absence of HSC chimerism, and that this effect can last several months.
Fig. 4 |. Rescue of osteopetrosis.

a, Bone volume/total volume for femurs from 10-week-old cathepsin K−/− mice (n = 3) after six weeks parabiosis with cathepsin K+/− mice and from positive (n = 4) and negative (n = 4) control parabionts, analysed by von Kossa staining. b, Monocyte transfer. Histograms represent percentage of tdTomato+ cells among bone TRAP+ MGCs from Csf1rCre;Rosa26LSL-YFP recipients analysed by confocal microscopy (left) 11 days (n = 2) and 60 days (n = 5) after intravenous transfer at six weeks of age of 3 × 10⁶ Ly6C+ bone marrow cells from Csf1rCre;Rosa26LSL-tdTomato donors, and percentages of tdTomato+ cells among bone marrow precursors and blood leukocytes, analysed by flow cytometry after 60 days (n = 5, right). c, Representative high-power confocal microscopy of the femur of a recipient mouse 60 days after intravenous transfer (from b), stained with antibodies for tdTomato and YFP, ELF97 phosphatase substrate and TOPRO-3. d, Representative photographs of teeth (top) and CT scan of leg bones from Csf1rcre;Csf1rfl/fl mice (n = 3) transferred with monocytic cells from Csf1rCre;Rosa26LSL-YFP donors at P5, P8 and P11, and from wild-type and non-transferred Csf1rcre;Csf1rfl/fl controls. Arrows indicate the presence of teeth eruption (top panels) and bone marrow cavity (bottom panels). e, Representative confocal microscopy of a femur from mouse no. 3 in d, stained with YFP antibody and with ELF97 and TOPRO-3. f, Number of TRAP+ osteoclasts in bone sections from mice in d and non-transferred controls (left), and percentage of YFP+ TRAP+ cells in transferred mice. The different symbols represent individual mice. Mean values for three sections per mouse. At least 100 osteoclasts were quantified per mouse. g, Percentages of YFP+ cells among bone marrow precursors and blood leukocytes in the recipient mice (from d) at the time of analysis. Data are mean ± s.d.; dots in graphs represent individual mice; n indicates the number of mice per group; ANOVA with Tukey’s multiple comparisons test. ***P < 0.001 and ****P < 0.0001.
Partial rescue of osteopetrosis occurs postnatally in Tnfrsf11aCre;Csf1rfl/fl mice, suggesting that transfusion of monocytic cells may also be able to rescue bone development in early-onset congenital osteopetrosis in the absence of a bone marrow transplantation. Intra-peritoneal injections of KIT−LY6C+ monocytic cells from Csf1rCre;Rosa26LSL-YFP mice into Csf1rCre;Csf1rF/F neonates, starting from post-natal day (P)5, resulted in complete or partial rescue of teeth eruption (Fig. 4d) and long bone development as assessed by computerized tomography (CT) scan, with the development of a bone marrow cavity (Fig. 4d) at day 14 in infant mice from three different litters (Fig. 4d, Extended Data Fig. 9). In these mice, femur histology indicated the presence of numerous YFP+TRAP+ osteoclasts lining the bone (Fig. 4e, f). Histology and flow cytometry analyses showed the lack of YFP+ circulating blood cells or bone marrow progenitors (Fig. 4e, g), indicating the absence of HSC engraftment. These data suggest that transfusion of monocytic cells can rescue bone development in early-onset autosomal recessive osteopetrosis in infant mice, in the absence of HSC transplantation.
In sum, we have shown here that osteoclasts originating from EMPs are essential for normal bone development. Moreover, we show that osteoclasts are long-lived in adults and that their function is maintained by iterative fusion of individual HSC-derived circulating cells with existing syncytia. With absence or deficiency of EMP-derived osteoclasts however, their timely replacement by transfusion with monocytic cells can rescue bone development in early-onset osteopetrotic mice without bone marrow transplantation. This is of potential clinical relevance because bone marrow and HSC transplantation, the standard treatment for early-onset osteopetrosis in mice and humans11–18, requires irradiation or chemotherapy—which increases the risk of infections, is frequently performed in patients who already suffer severe complications, and has a six-year overall survival rate of approximately 48%17. In addition, the original mechanism that mediates osteoclast maintenance in adult mice suggests that these cells represent a unique target for gene transfer by cellular therapies based on transfusion of wild-type or engineered monocytic cells to modulate osteoclast activity and bone remodelling in adults.
Extended Data
Extended Data Table 1.
Mouse genotyping
| Mouse line | Primer 1 sequence 5' --> 3' |
Primer 2 sequence 5' --> 3' |
Denaturation | Annelaling | Elongation | Cycles | Final Enlongation | Expected bands | |
|---|---|---|---|---|---|---|---|---|---|
| Csf1riCre | Mutant allele | TCTCTGCCCAGAGTCATCCT | CTCTGACAGATGCCAGGACA | 94°C – 45sec | 60°C – 45sec | 72°C – 45sec | 30 | 72°C – 5 min | Mutant: 400 bp |
| CsflrMeriCreMer | WT allele Mutant allele |
TCGAAGCTTGCATGCCTGCA TCATTCCAGAACCAGAGC |
TCTCTGCCCAGAGTCATCCT GATCGTGTTGGGGAAGCC |
94°C – 45sec | 60°C -90sec | 72°C – 90sec | 30 | 72°C – 5 min | WT: 1Kb Mutant: 2 Kb |
| Cff1rflox | Mutant allele | GCCACCAT GTGTCCGTG CTT | ACCCAGAGCCCCCACAGATA | 94°C – 30sec | 60°C – 60sec | 72°C – 60sec | 35 | 72°C – 2 min | WT: 450 bp Floxed: 500 bp |
| Cfflr+/− | Mutant allele | GGT GGAT GT G GAAT GTGTGCG | CGTTTCTTGTGGTCAGGGTGC | 95°C – 20sec | 62°C – 20sec | 72°C – 40sec | 35 | 72°C – 5 min | Mutant: 314 |
| Flt3Cre | Mutant allele | ACGGAGTCCAGGCAACTTCC | GAAGCATGTTTAGCTGGCCC | 94°C – 30sec | 58°C – 35sec | 68°C – 60sec | 44 | 72°C – 2 min | Mutant: 400 bp |
| Myb+/− | WT allele Mutant allele | CCATGCGTCGCAAGGTGGAAC CCATGCGTCGCAAGGTGGAAC |
GTGCTTCGGCGATGTGGTAA TGGCCGCTTTTCTGGATTCATC |
94°C – 30sec | 60°C – 30sec | 72°C – 60sec | 35 | 72°C – 7 min | WT: 200 bp Mutant: 300 bp |
| Rosa.26CreERT2 | Mutant allele | GCCTGCATTACCGGTCGATGCAACGA | AATGGTGTTGCCGCGCCATCTGCCAC | 95°C – 20sec | 67°C – 20sec | 72°C – 50sec | 40 | 72°C – 2 min | Mutant: 700bp |
| Rosa26LSL-yFP | WT allele Mutant allele |
AAGTCGCTCTGAGTTGTTAT AAGTCGCTCTGAGTTGTTAT |
GGAGCGGGAGAAATGGATATG GCGAAGAGTTTGTCCTCAACC |
94°C – 40sec | 60°C – 60sec | 72°C – 60sec | 34 | 72°C – 5 min | WT: 525 bp Mutant: 300 bp |
| Rosa26LSL-tdTornato | WT alelle | AAGGGAGCTGCAGTGGAGTA | CCGAAAATCTGTGGGAAGTC | Step 1: 94°C – 20sec | 65°C – 15sec
(0.5C decrease per cycle) 60°C – 15sec |
68°C – 10sec | 10 | 72°C – 2 min | WT: 297 bp |
| Mutant allele | GGCATTAAAGCAGCGTATCC | CTGTTCCTGTACGGCATGG | Step 2: 94°C – 15sec | 60°C – 15sec | 72°C – 10sec | 28 | Mutant: 196 bp | ||
| Tnfrff11aflox | WT allele | AGTGTGCCTGGCATGTGCAGACCTT | CTGGTGGTTGTTCTCCTGGTGTCAT | 94°C – 30sec | 60°C – 30sec | 72°C – 40sec | 35 | 72°C – 5 min | WT: 256 bp |
| Mutant allele | AGTGTGCCTGGCATGTGCAGACCTT | GGCAGAACTCGGATGCACAGATTGG | Floxed: 390 bp Delta: 566 bp |
||||||
| Tnfrsf11aKoba/Cre | WT allele Mutant allele |
TGAAGGGTGACATCATCGTGGT ACTTCTCCATGGTAGCCTCC |
AATAGGGGTGGGGTGATA AATAGGGGTGGGGTGATA |
94°C – 30sec | 60°C – 30sec | 72°C – 30sec | 35 | 72°C – 5 min | WT: 530 bp Mutant: 274 bp |
| TnfrsfllaWafk/Cre | Mutant allele | AACCTGAGGATGTGAGGGACTA | GTCAAAGTCAGTGCGTTCAAAG | 95°C – 30sec | 58°C – 30sec | 68°C – 60sec | 35 | 72°C – 2 min | Mutant: 210 bp |
| VavDD/Cre | Mutant allele | GCCTGCATTACCGGTCGATGCAACGA | AATGGTGTTGCCGCGCCATCTGCCAC | 95°C – 20sec | 67°C – 20sec | 72°C – 50sec | 40 | 72°C – 2 min | Mutant: 700bp |
| CtfkCre | TTATTCCTTCCGCCAGGATG | TTGCTGTTATACTGCTTCTG | 95°C – 30sec | 55°C – 30sec | 72°C – 60sec | 35 | 72°C – 5 min | WT: 140 bp | |
| TAGTTTTTACTGCCAGACCG | Mutant: 300 bp |
Extended Data Table 2.
Antibodies for Bone Histology
| Fate-mapping models: Flt3Cre;Rosa26LSL-YFP,Cfs1rCre;Rosa26LSL-YFP Csf1rMeriCreMer;Rosa26LSL-YFP and Tnfrsf11aCre;Rosa26LSL-YFP | ||||||||
|---|---|---|---|---|---|---|---|---|
| Conjugation | Company | Catalog number | Concentration | Dilution | Staining Buffer | Incubating conditions | ||
| Primary Antibody | Goat polyclonal anti-GFP | Biotin | Abcam | ab6658 | 1mg/mL | 1::50 | PBS/0.25%BSA/0.3% triton | 4°C overnight (15hrs) |
| Secondary Antibody | Streptavidin | AlexaFluor488 | Thermo Fisher Scientific | S-11223 | 1::100 | PBS/0.25%BSA | 2hrs at room temperature | |
| Parabiosis | ||||||||
| Conjugation | Company | Catalog number | Concentration | Dilution | Staining Buffer | Incubating conditions | ||
| Primary Antibodies | Goat polyclonal anti GFP Rabbit polyclonal anti-RFP |
Biotin Unconugated |
Abcam | ab6658 ab62341 |
1mg/mL | 1::50 1::200 |
PBS/0.25%BSA/0.3% triton | 4°C overnight (15hrs) |
| Secondary Antibodies | Streptavidin Goat anti-rabbit IgG |
AlexaFluor488 AlexaFluor555 |
Thermo Fisher Scientific | S-11223 A21430 |
1mg/mL 2mg/mL |
1::100 1::200 |
PBS/0.25%BSA | 2hrs at room temperature |
| Bone marrow monocyte transfusions and transplants | ||||||||
| Conjugation | Company | Catalog number | Concentration | Dilution | Staining Buffer | Incubating conditions | ||
| Primary Antibodies | Goat polyclonal anti GFP Rabbit polyclonal anti-RFP |
Biotin Unconugated |
Abcam Rockland |
ab6658 600–401-379 |
1mg/mL | 1::50 1::200 |
PBS/0.25%BSA/0.3% triton | 4°C overnight (15hrs) |
| Secondary Antibodies | Streptavidin Goat anti-rabbit IgG |
AlexaFluor488 AlexaFluor555 |
Thermo Fisher Scientific | S-11223 A21430 |
1mg/mL 2mg/mL |
1::100 1::200 |
PBS/0.25%BSA | 2hrs at room temperature |
| EdU staining* | ||||||||
| Conjugation | Company | Catalog number | Concentration | Dilution | Staining Buffer | Incubating conditions | ||
| Primary Antibody | Rat anti-mouse Tubulin | Unconjugated | Abcam | ab6160 | 1mg/mL | 1::200 | PBS/0.25%BSA/0.3% triton | 4°C overnight (15hrs) |
| Secondary Antibody | Goat anti-rat IgG | AlexaFluor555 | Thermo Fisher Scientific | A21434 | 2mg/mL | 1::200 | PBS/0.25%BSA | 2hrs at room temperature |
After antibody staining sections were stained with the Click-it EdU Alexa Fluor 488 Imaging Assay kit, as described in methods.
Extended Data Table 3.
Antibodies for FACS
| Antibody | Clone | Fluorochrome | Company | Dilution |
|---|---|---|---|---|
| CD3 | 145–2C11 | bio | eBioscience | 1/1000 (BM, Y, FL) |
| CD3 | 145–2C11 | BV711 | BD Pharmingen | 1/100 (BM, SP, LV, K, BR) 1/400 (E) |
| CD3 | 145–2C11 | APC-Cy7 | BD Pharmingen | 1/100 (BL) |
| CD3 | 145–2C11 | PE | Bioiegend | 1/100 (BM) |
| CD3 | 17A2 | eF450 | eBioscience | 1/200 (BL) |
| CD11b | M1/70 | bio | eBioscience | 1/1000 (BM, Y, FL) |
| CD11b | M1/70 | PE-Cy7 | eBioscience | 1/200 (BL, BM, SP, LV, K, BR, LN, E) |
| CD11b | M1/70 | BV711 | Bioiegend | 1/200 (BM) |
| CD19 | 1D3 | bio | eBioscience | 1/500 (BM, Y, FL) |
| CD19 | 1D3 | BV711 | BD Pharmingen | 1/100 (BM, SP, LV, K, BR) 1/200 (BL) |
| CD19 | 1D3 | PE-Cy7 | BD Pharmingen | 1/400 (BL) |
| B220 | RA3–6B2 | bio | eBioscience | 1/400 (BM,Y, FL) |
| Gr1 | RB6–8C5 | bio | eBioscience | 1/1000 (BM,Y, FL) |
| NK1.1 | PK136 | bio | eBioscience | 1/2000 (BM, Y, FL) |
| NKp46 | 29A1.4 | BV711 | BD Pharmingen | 1/100 (BM, SP, LV, K, BR) |
| NKp46 | 29A1.4 | AlexaFluor647 | BD Pharmingen | 1/200 (BL) |
| Ter119 | Ter119 | bio | eBioscience | 1/500 (BM, Y, FL) |
| Ter119 | Ter119 | BV711 | BD biosciences | 1/200 (BM) |
| CD11b | M1/70 | PE | BD Pharmingen | 1/1600 (BM) |
| CD11b | M1/70 | APC-eF780 | eBioscience | 1/600 (SP, Y, FL, LV, LN, BR, P) |
| CD11c | N418 | APC | eBioscience | 1/150 (SP, BM,YS FL, LV, LN, BR, P) |
| CD45 | 30-F11 | PE | eBioscience | 1/150 (SP, BM, Y, FL, LV, LN, BR, P) |
| CD45 | 30-F11 | APC-eF780 | eBioscience | 1/200 (Y, FL, P) 1/50 (BM, SP, LV, K) 1/100 (BR, LN, E) |
| CD45 | 30-F11 | eF450 | eBioscience | 1/50 (BM) |
| CD48 | HM48–1 | BV421 | BD Pharmingen | 1/400 (BM,Y, FL) |
| CD48 | HM48–1 | APC | Bioiegend | 1/100 (BM) |
| CD115 | AFS98 | APC | eBioscience | 1/150 (SP, BM,Y, FL, LV, LN, BR, P) |
| CD115 | AFS98 | APC | Bioiegend | 1/100 (BM) |
| CD115 | AFS98 | BV605 | Bioiegend | 1/200 (BL, BM, SP, LV, K, BR) |
| CD115 | AFS98 | PE | eBioscience | 1/100 (SP, BM, LV, LN, BR, P) |
| CD117 | 2B8 | PE-Cy7 | eBioscience | 1/3000 (Y, FL) |
| CD117 | 2B8 | APC | eBioscience | 1/400 (BM,Y, FL) |
| CD117 | 2B8 | APC-Cy7 | Bioiegend | 1/100 (BM) |
| CD117 | 2B8 | BV605 | BD biosciences | 1/100 (BM) |
| CD150 | TC15–12F1 | PE-Cy7 | BioLegend | 1/25 (Y, FL) 1/100 (BM) |
| F4/80 | BM8 | PE-Cy5 | eBioscience | 1/300 (SP, Y, FL, LV, LN, BR, P) |
| F4/80 | BM8 | eF450 | eBioscience | 1/100 (BM, BR, LN, E) |
| Gr-1 | RB6–8C5 | PECy5.5 | eBioscience | 1/3000 (SP, BM, Y, FL, LV, LN, BR, P) |
| Gr-1 | RB6–8C5 | eF450 | eBioscience | 1/1000 (Y, FL) |
| Gr-1 | RB6–8C5 | BV711 | Bioiegend | 1/100 (BM) |
| Ly6C | HK1.4 | PerCpCy5.5 | eBioscience | 1/800 (Y, FL) |
| Ly6C | HK1.4 | BV421 | Bioiegend | 1/200 (BL) 1/400 (SP, LV, K, BR) |
| Ly6C | HK1.4 | BV510 | Bioiegend | 1/200 (BM) |
| Ly6C | HK1.4 | AlexaFluor488 | Bioiegend | 1/50 (BM) |
| Ly6G | 1A8 | BV510 | Bioiegend | 1/100 (BM) 1/200 (Bi, LN) 1/400 (SP, LV, K, BR) |
| Ly6G | 1A8 | BV711 | BD Pharmingen | 1/200 (BM) |
| MHCII | M5/114.15.2 | Alexa Fluor 700 | eBioscience | 1/150 (SP, BM,Y, FL, LV, LN, BR, P) |
| MHCII | M5/114.15.2 | AlexaFluor700 | Bioiegend | 1/100 (BM) 1/200 (BL, SP, LV, K, BR) |
| Sca1 | D7 | PercpCy5.5 | eBioscience | 1/500 (BM,Y, FL) |
| Sca-1 | D7 | BV421 | BD Pharmingen | 1/200 (BM) |
| Sca-1 | D7 | BV711 | Bioiegend | 1/100 (BM) |
| Streptavidin | V500 | BD Biosciences | 1/800 (BM, Y, FL) | |
| SigiecF | E50–2440 | AlexaFluor647 | BD Pharmingen | 1/100 (BM, LN) |
BM: Bone marrow *BM: Bone marrow *SP: Spleen
BL: Blood
Y: Yolk sac
FL: Fetal Liver
LV: Liver
LN: Lung
BR: Brain
P: PEC
E: Epidermis
K: Kidney
Supplementary Material
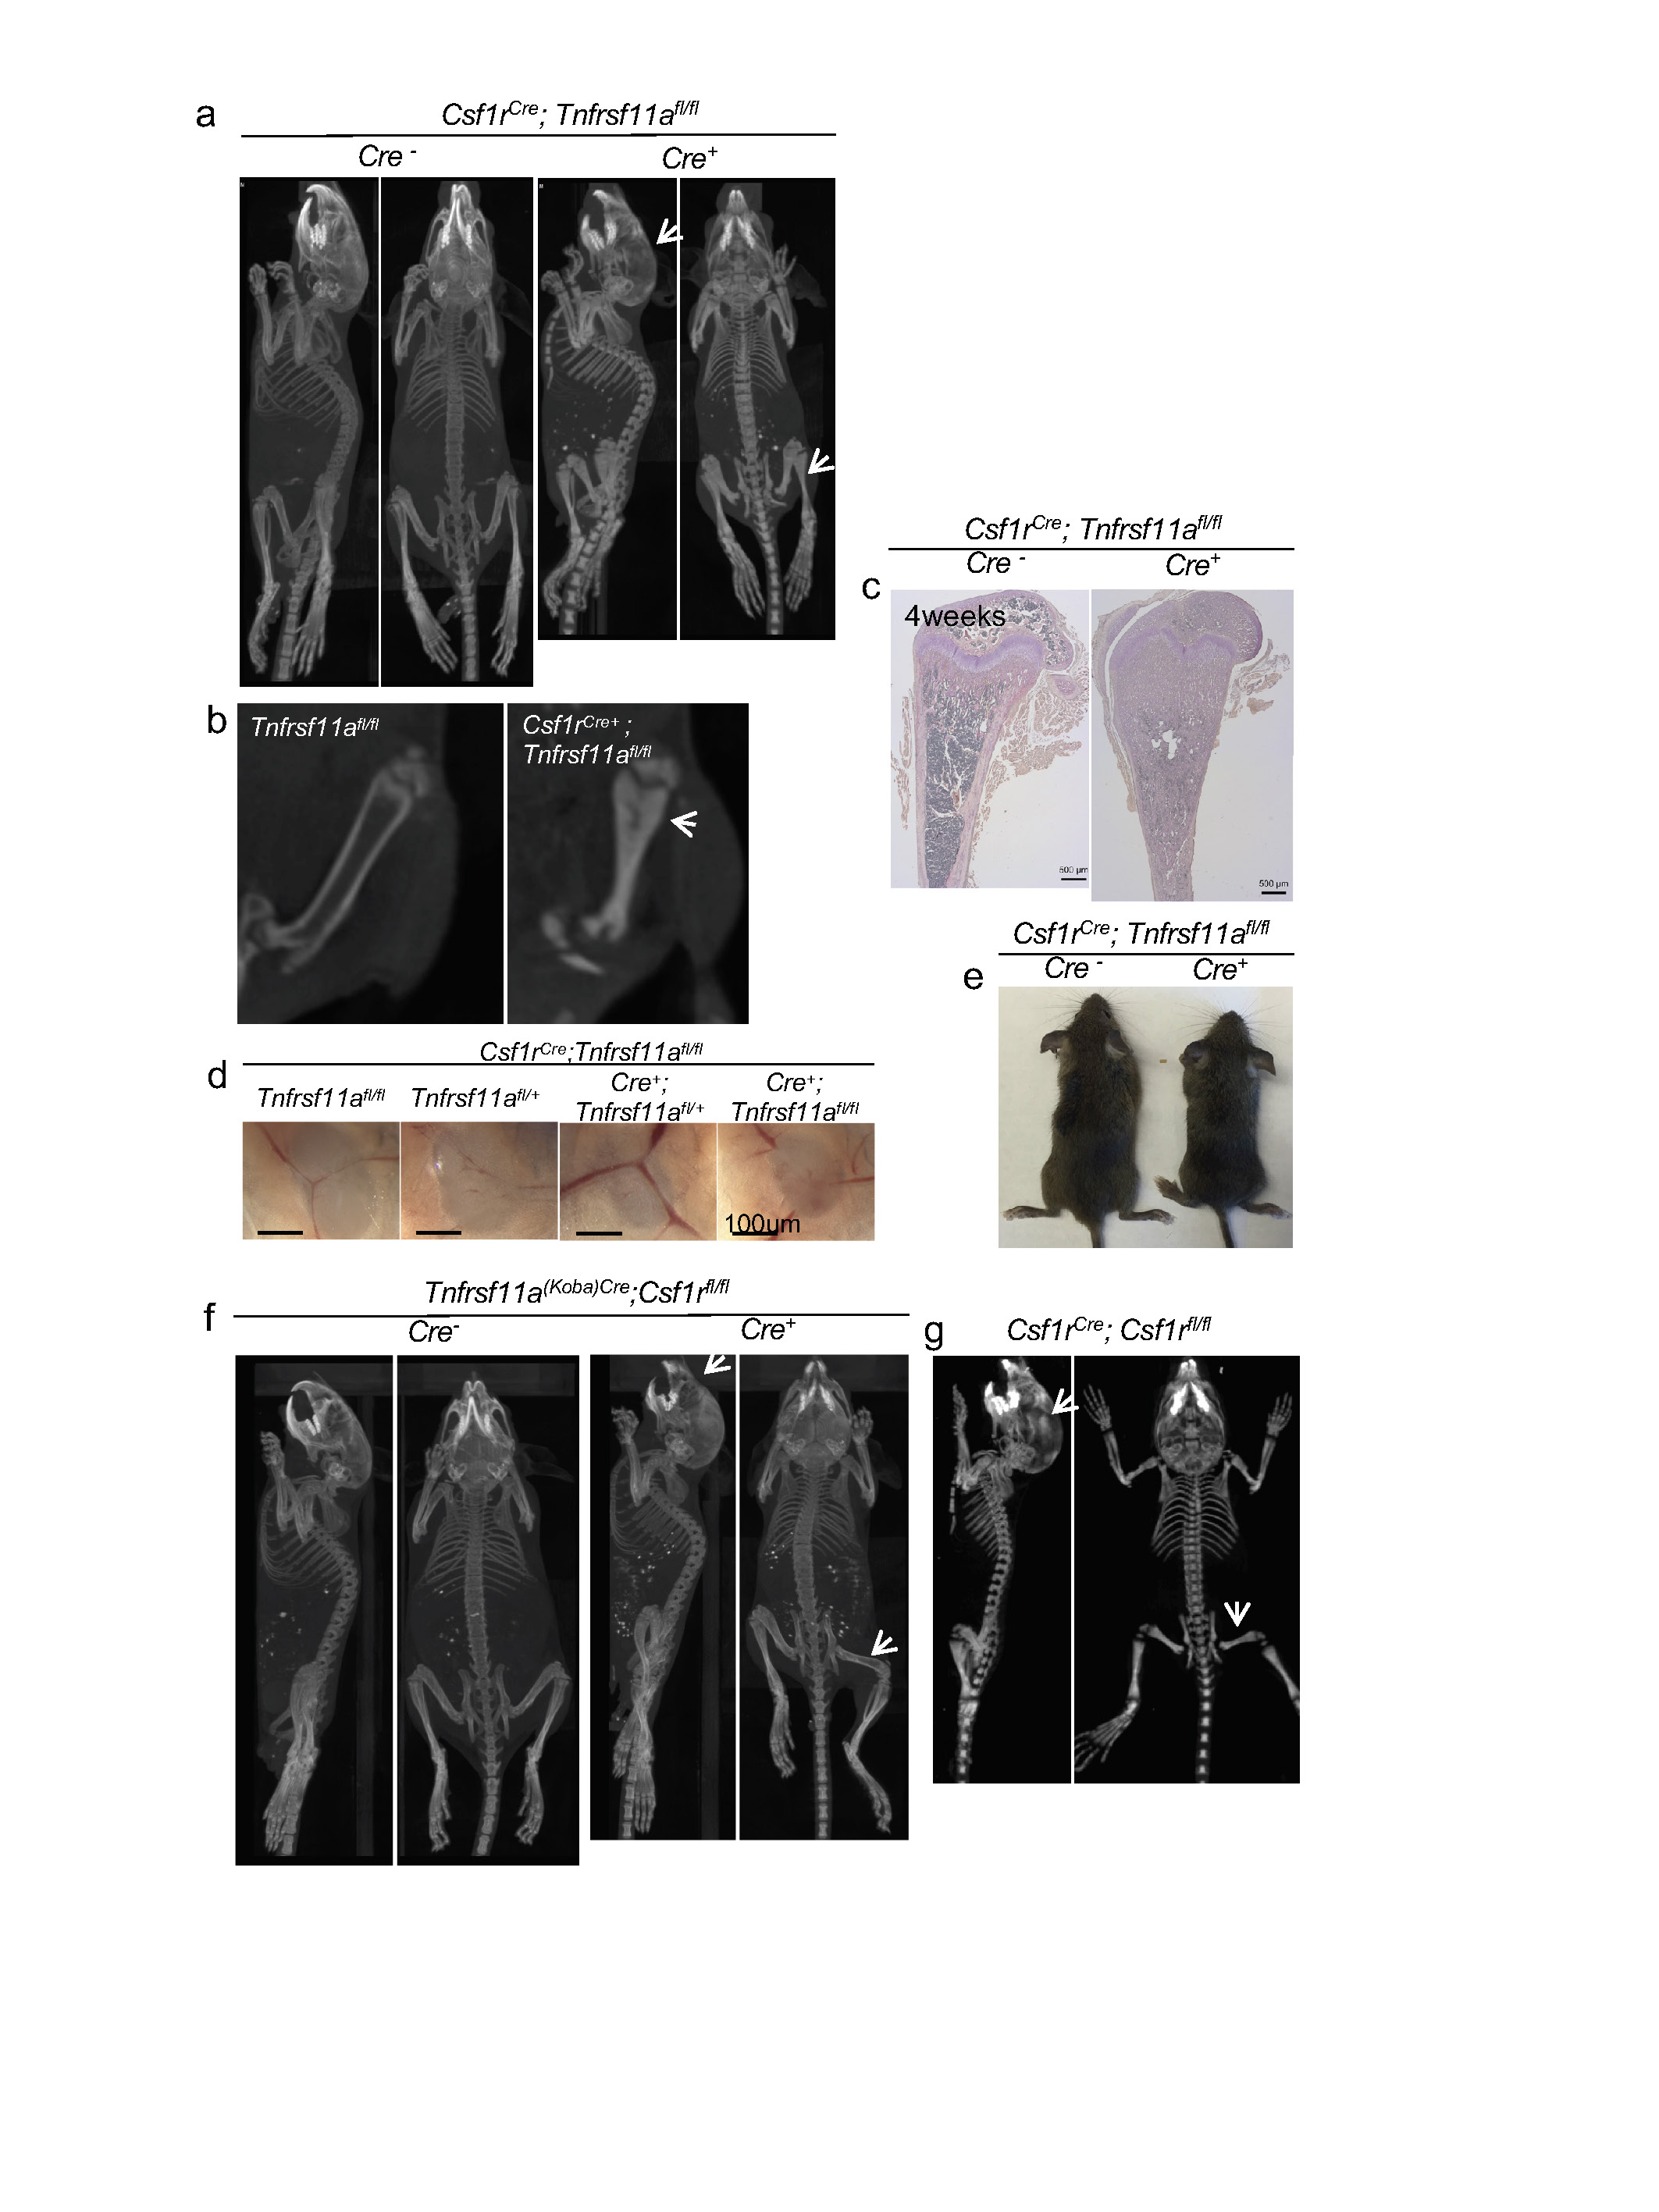
a, b, Representative CT scans (nanospect CT) of four-week-old Csf1rCre;Tnfrsf11afl/fl mice. Arrows indicate skull deformation and absence of bone marrow cavity in mutant mice. c, Haematoxylin and TRAP staining of bone sections from four-week-old Csf1rCre;Tnfrsf11afl/fl mice showing closure of the bone marrow. Histology of paraffin sections (5-μm thickness) corroborates the phenotype from mice in b. d, Inguinal lymph nodes from Csf1rCre;Tnfrsf11afl/fl mice. e, A representative Csf1rCre;Tnfrsf11afl/fl and a littermate control. f, Representative CT scan reconstructions (nanospect CT) of four-week-old Tnfrsf11aKoba-Cre;Csf1rfl/fl mice. Arrows indicate skull deformation, but with presence of a bone marrow cavity in mutant mice, in contrast to those in a and b. g, Representative CT scans of Csf1rCre;Csf1rfl/fl mice. Arrows indicate skull deformation and absence of bone marrow cavity in mutant mice as in a and b. CT scans and photographs are representative of >10 litters.
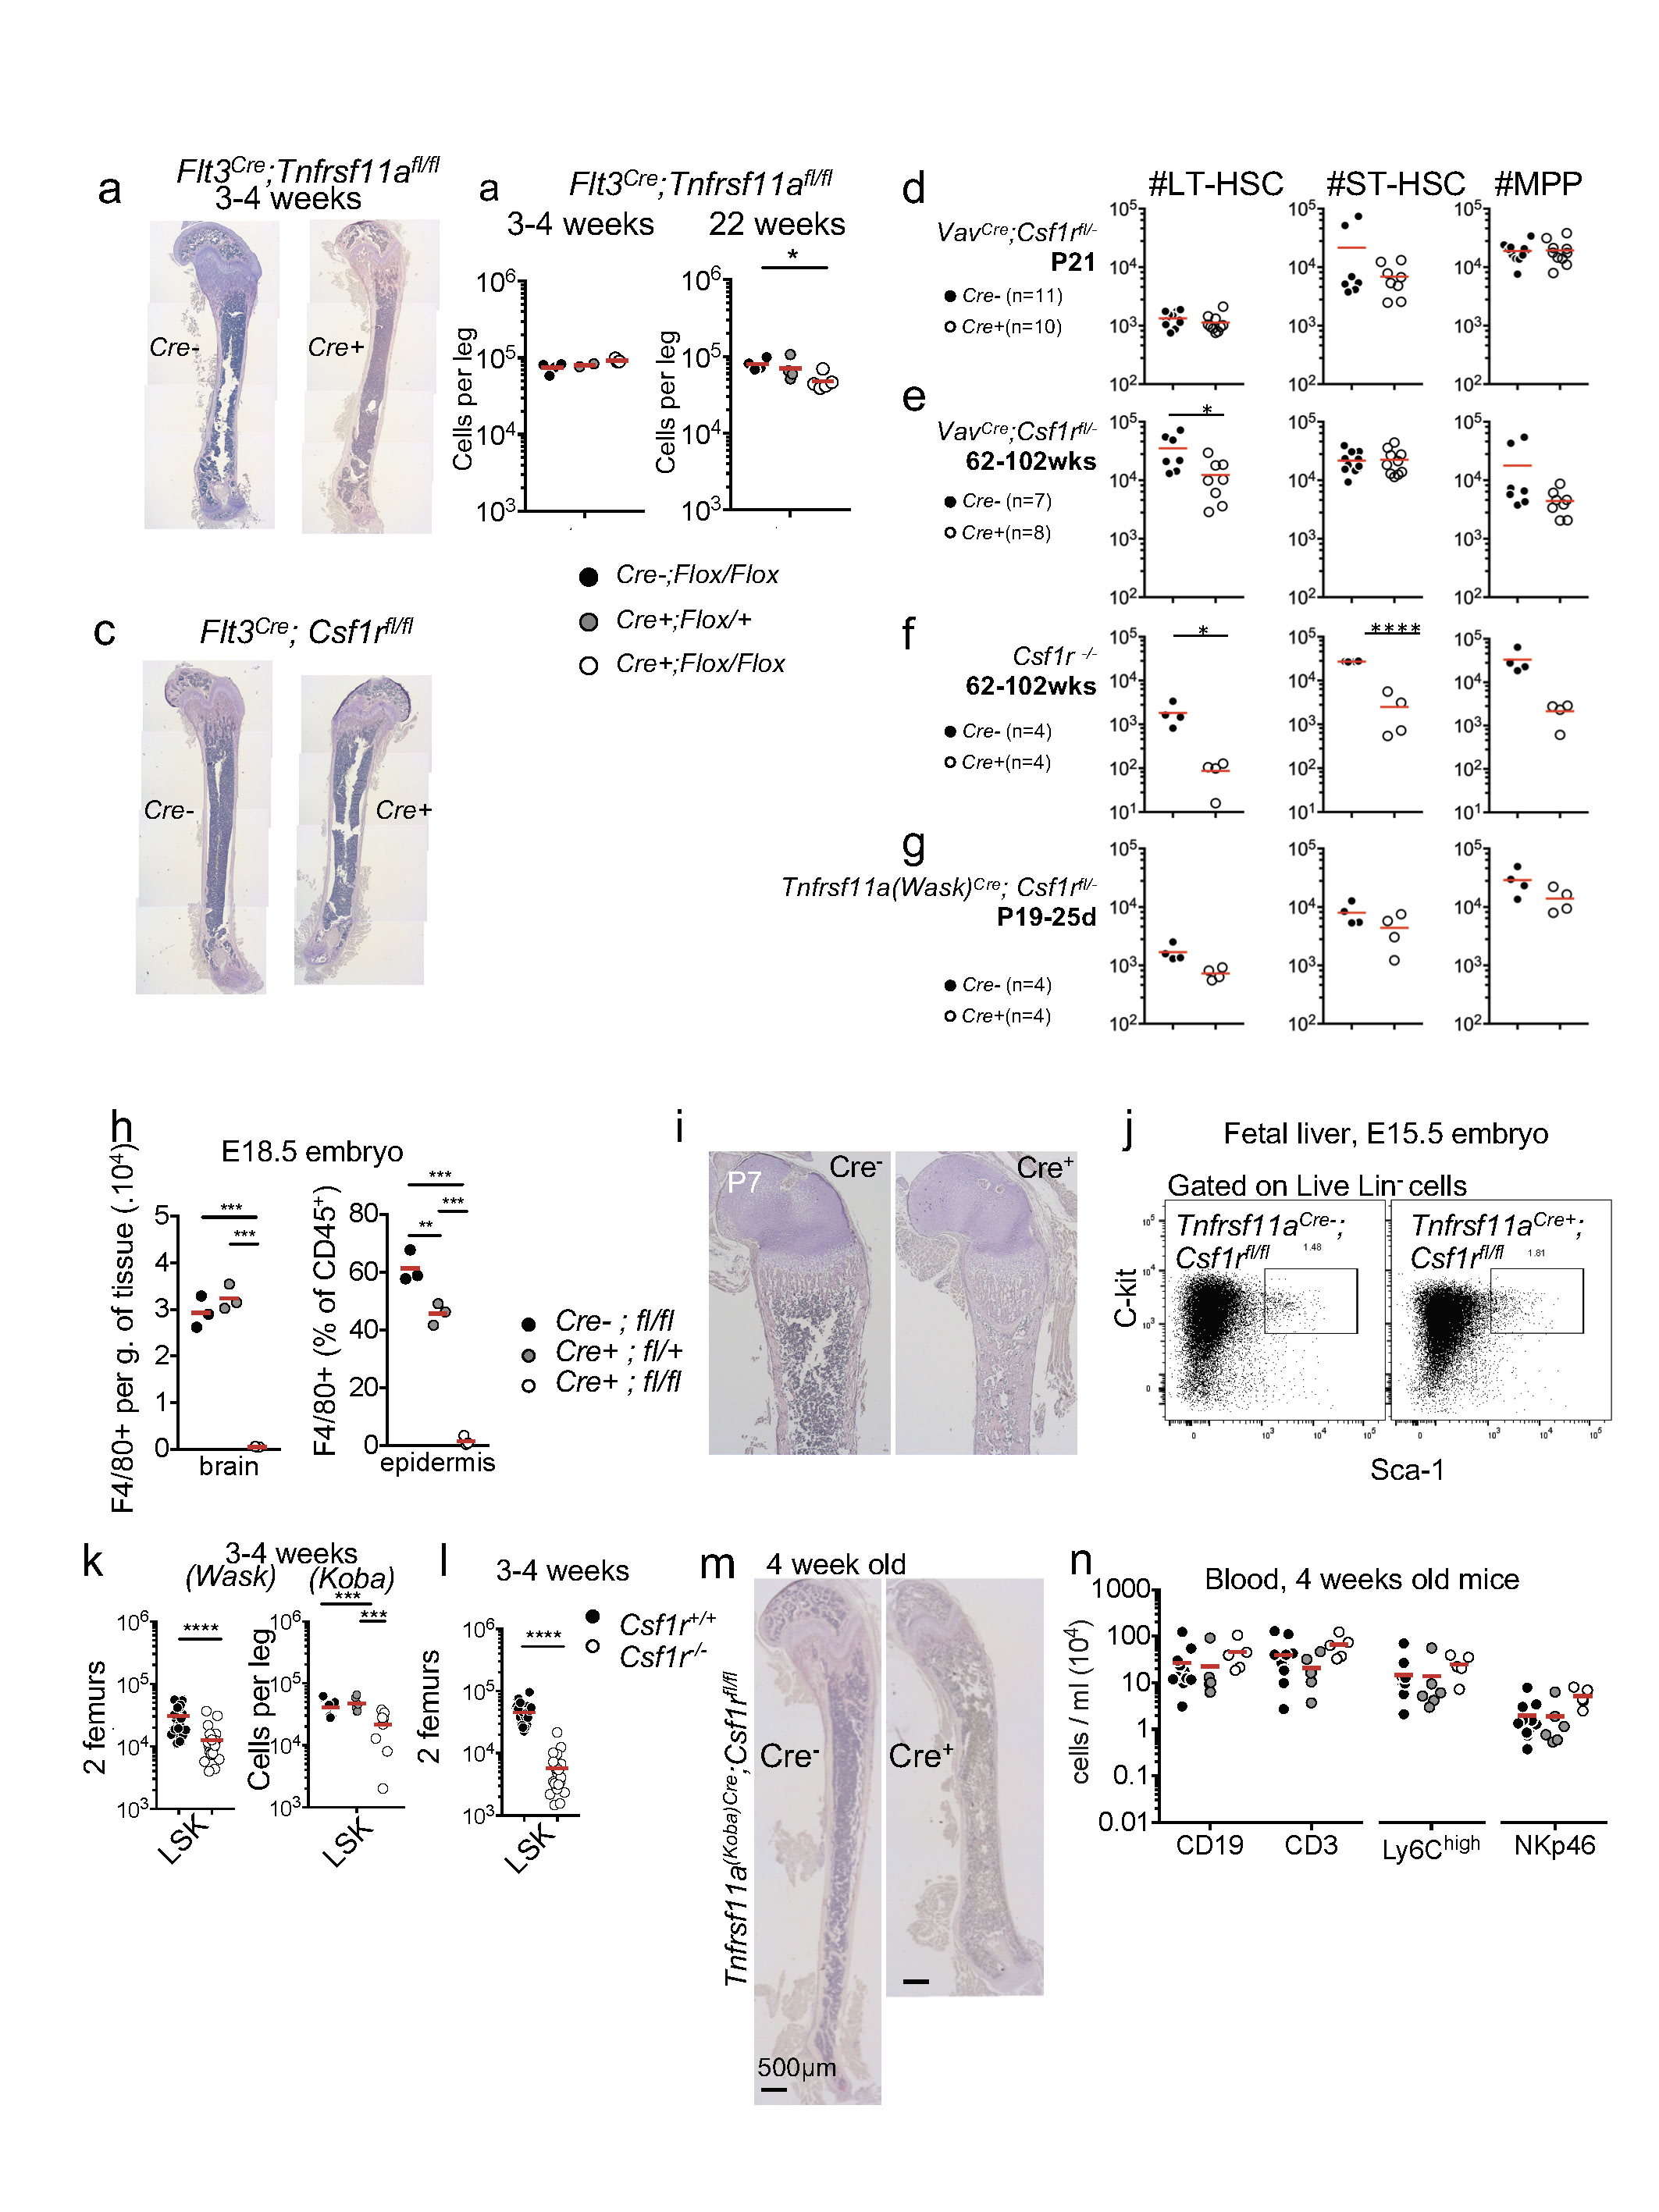
a, Young Flt3Cre;Csf1rfl/fl and Flt3Cre;Tnfrsf11afl/fl mice have normal long bones. Haematoxylin and TRAP staining of bone sections from four-week-old Flt3Cre;Tnfrsf11afl/fl mice, showing normal bone structure and bone marrow cavity. b, LSK cell numbers in bone marrow from three-to-four-week-old Flt3Cre;Tnfrsf11afl/fl (n = 3) and Flt3Cre;Tnfrsf11afl/+ mice (n = 2) and littermate controls (n = 4) and from 22-week-old Flt3Cre;Tnfrsf11afl/fl (n = 5) and Flt3Cre;Tnfrsf11afl/+ mice (n = 4) and littermate controls (n = 4). c, Haematoxylin and TRAP staining of bone sections from four-week-old Flt3Cre;Csf1rfl/fl mice showing normal bone structure and bone marrow cavity. d, e, Phenotypic long-term haematopoietic stem cells (LT-HSCs) are reduced in aged wild-type mice but not in aged VavCre;Csf1rfl/− mice. f, g, LT-HSCs are reduced in in young Csf1r−/− mice, and to a lesser extent, in young Tnfrsf11aWask-Cre;Csf1rfl/− mice. Cell counts for two femurs are shown. h, Flow cytometry analysis of F4/80+ cells in brain (microglia) and epidermis (Langerhans cells) in E18.5 Tnfrsf11aCre;Csf1rfl/fl embryos and littermate controls (n = 3 per group). i, Haematoxylin and TRAP staining of bone sections from P7 Tnfrsf11aCre;Csf1rfl/fl mice and littermate controls, showing absence of the bone marrow cavity. j, Flow cytometry of fetal liver at E15.5 (representative results of three experiments). k, LSK numbers in bone marrow of three-to-four-week-old Tnfrsf11aWask-Cre;Csf1rfl/fl mice (n = 24) and littermate controls (n = 20), and Tnfrsf11aKoba-Cre;Csf1rfl/fl (n = 7) and Tnfrsf11aKoba-Cre;Csf1rfl+l mice (n = 6) and littermate controls (n = 8). l, For comparison, LSK numbers in bone marrow of three-to-four-week-old Csf1r−/− mice (n = 22) and littermate controls (n = 21). m, Representative micrographs of femur sections from four-week-old Tnfrsf11aCre;Csf1rfl/fl mice and littermate controls, stained with haematoxylin and TRAP. n, Blood leukocytes numbers in four-week-old Tnfrsf11aCre;Csf1rfl/fl mice (n = 5), Tnfrsf11aCre;Csf1rfl/+ mice (n = 6) and littermate controls (n = 12). Points represent individual mice; results from three independent experiments. Data are mean ± s.d.; n indicates the number of mice per group; unpaired two tailed t-tests. *P < 0.05, **P < 0.005, ***P < 0.0005 and ****P < 0.0001. LT-HSC, Lin−KIT+SCA1+;Kit+SCA1+CD34−FLT3−. Phenotypic short-term haematopoietic stem cells (ST-HSC), Lin−KIT+SCA1+CD34+FLT3−. MPP, multipotent progenitors; Lin−KIT+SCA1+CD34+FLT3+. Lin, CD3+CD19+NK1.1+TER119+CD11b+GR1+B220+.
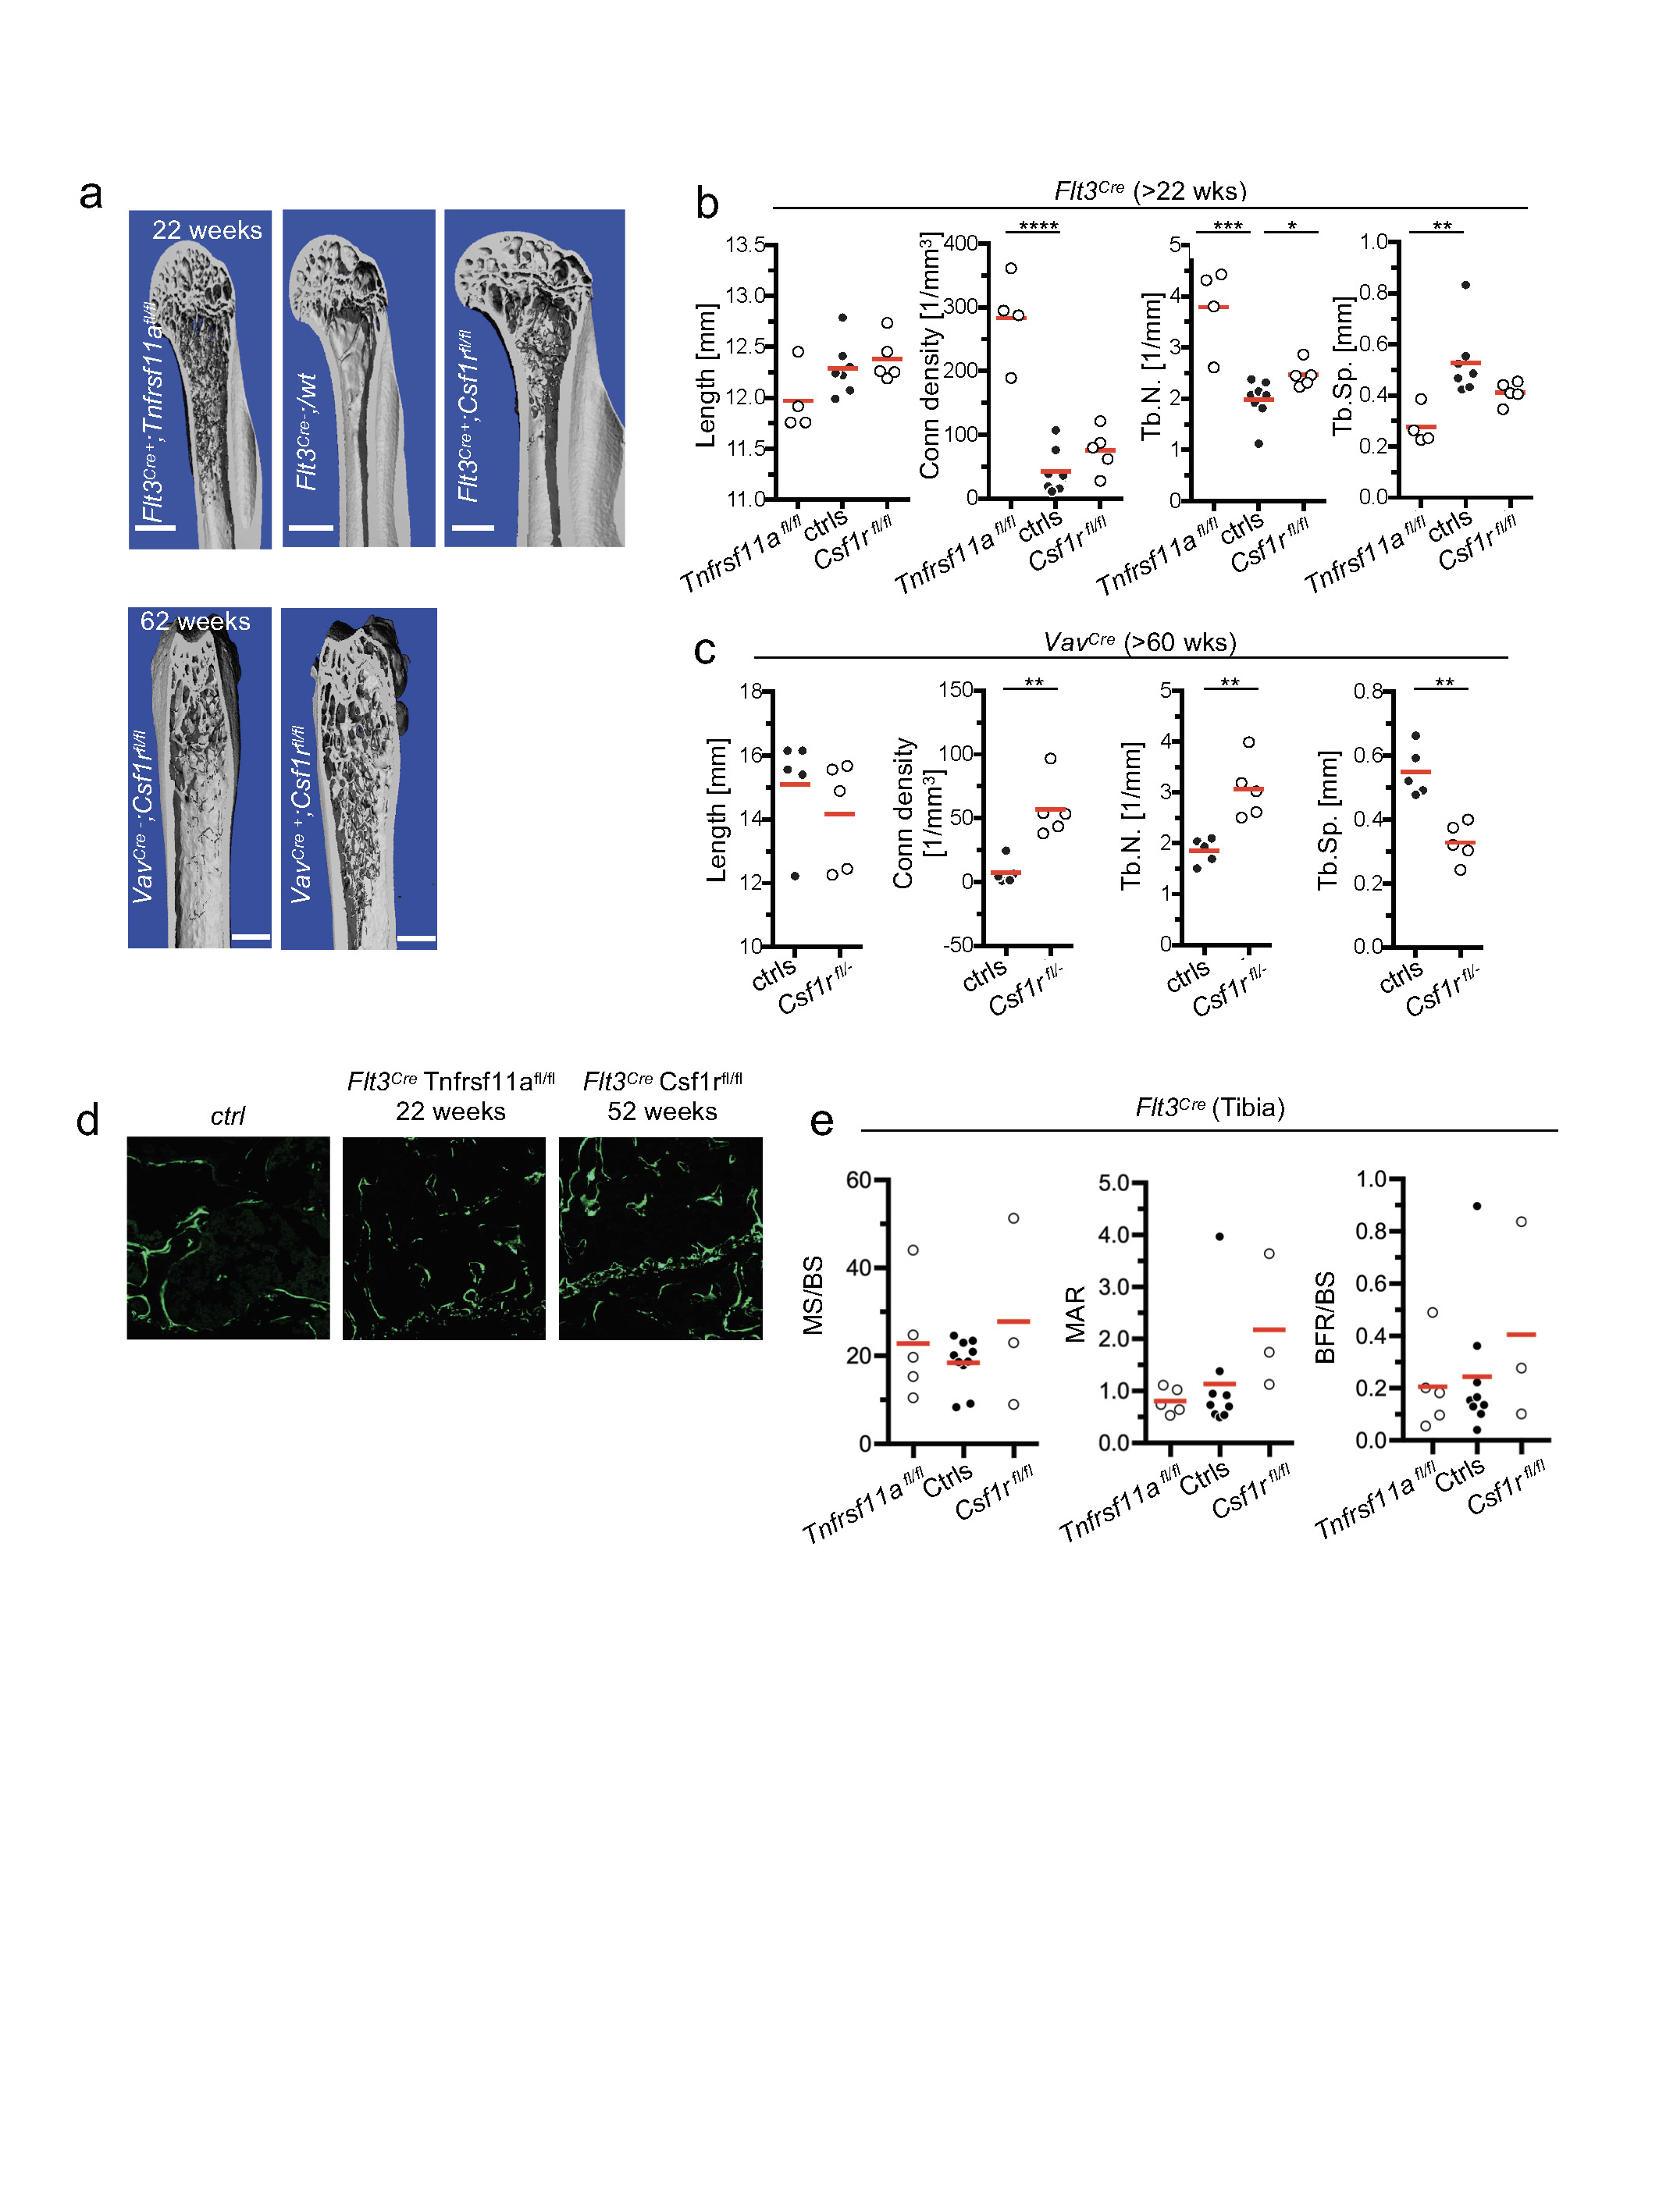
a, Representative Micro-CT of femura of mice of the indicated age and genotype. b, Bone length, connectivity density (Conn density), trabecular number (Tb.N.) and trabecular spacing (Tb.Sp.) analysed by micro-CT in aged Flt3Cre;Tnfrsf11afl/fl (n = 4) and Flt3Cre;Csf1rfl/fl (n = 4) mice and control littermates (n = 7). c, Bone histomorphometry as in b, for VavCre;Csf1rfl/fl mice and control littermates (n = 5). d, e, Dynamic bone histomorphometry in aged Flt3Cre;Tnfrsf11afl/fl and Flt3Cre;Csf1rfl/fl mice using in vivo calcein labelling. d, Representative micrographs of calcein labelling (green) of femura of mice from the indicated genotypes and ages. Scale bars: 200 μm (top); 50 μm (bottom). e, Quantification of calcein labelling by fluorescence microscopy of mineralized surface/bone surface (MS/BS), mineral apposition rate (MAR), and bone formation rate/bone surface (BFR/BS) in aged Flt3Cre;Tnfrsf11afl/fl (n = 5), Flt3Cre;Csf1rfl/fl (n = 3) and control littermates (n = 10) Data are mean ± s.d.; dots in graphs represent individual mice; n indicates the number of mice per group; unpaired two tailed t-tests. *P < 0.05, **P < 0.005, ***P < 0.0005 and ****P < 0.0001.
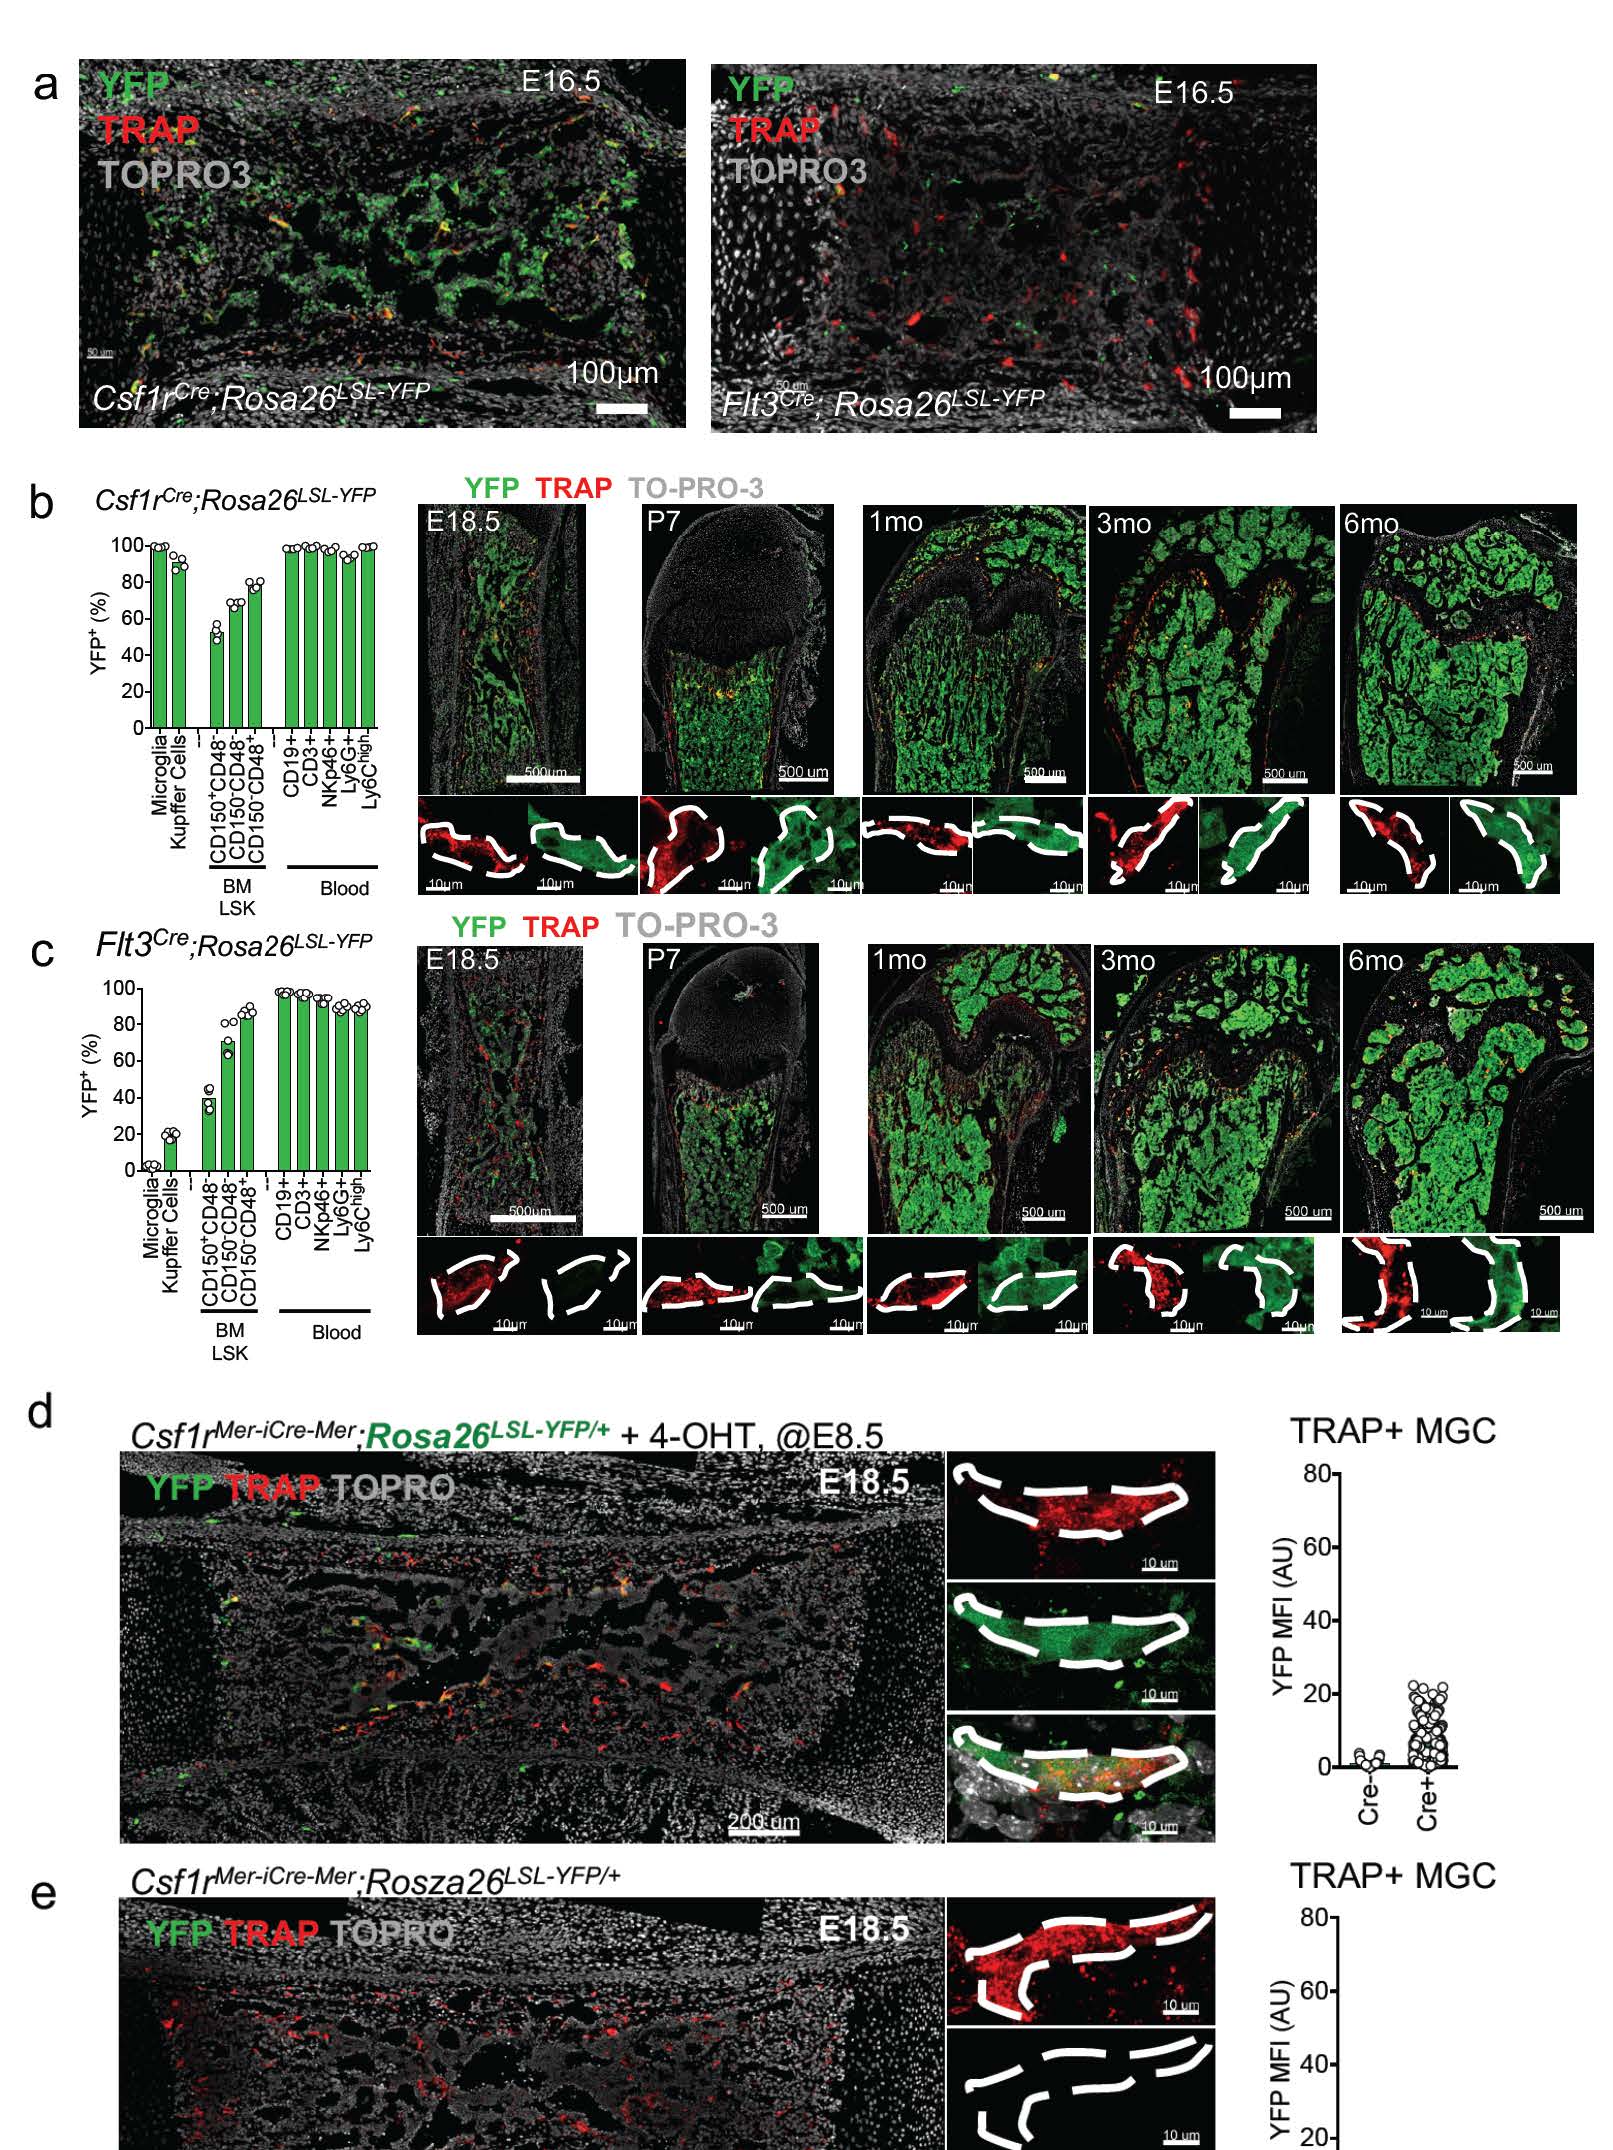
a, Representative confocal microscopy of frozen sections from Flt3Cre;Rosa26LSL-YFP and Csf1rCre;Rosa26LSL-YFPmice analysed at E16.5 (n = 3). b, YFP-labelling efficiency in Flt3Cre;Rosa26LSL-YFP mice analysed by flow cytometry in the indicated cell populations (left), and by confocal microscopy on frozen bone sections at the indicated age (right). Magnified regions (bottom right) show YFP expression in individual osteoclasts. YFP, YFP antibody; TRAP, ELF97 fluorescent substrate; TO-PRO-3, nuclear stain. c, YFP-labelling efficiency in Csf1rCre;Rosa26LSL-YFPmice analysed as in b. Data in b and c are representative of at least three experiments per time point and genotype. Points represent individual mice. d, Genetic lineage tracing of osteoclasts in ossification centres using Csf1rMer-iCre-Mer;Rosa26LSL-YFP mice. Representative high-power confocal microscopy of embryonic femurs showing MGCs in primary ossification centres from Csf1rMer-iCre-Mer;Rosa26LSL-YFP E18.5 embryos pulsed with 4-OHT at E8.5, showing YFP expression in MGCs after cre recombination (left) and quantified as MFI (right) from cre+ (n = 8) and cre− (n = 4) (d), and unpulsed controls (e), showing the lack of YFP in cre+ (n = 4) and cre− (n = 4). Sections were labelled with antibodies against YFP, TRAP (ELF97 substrate) and TO-PRO-3.
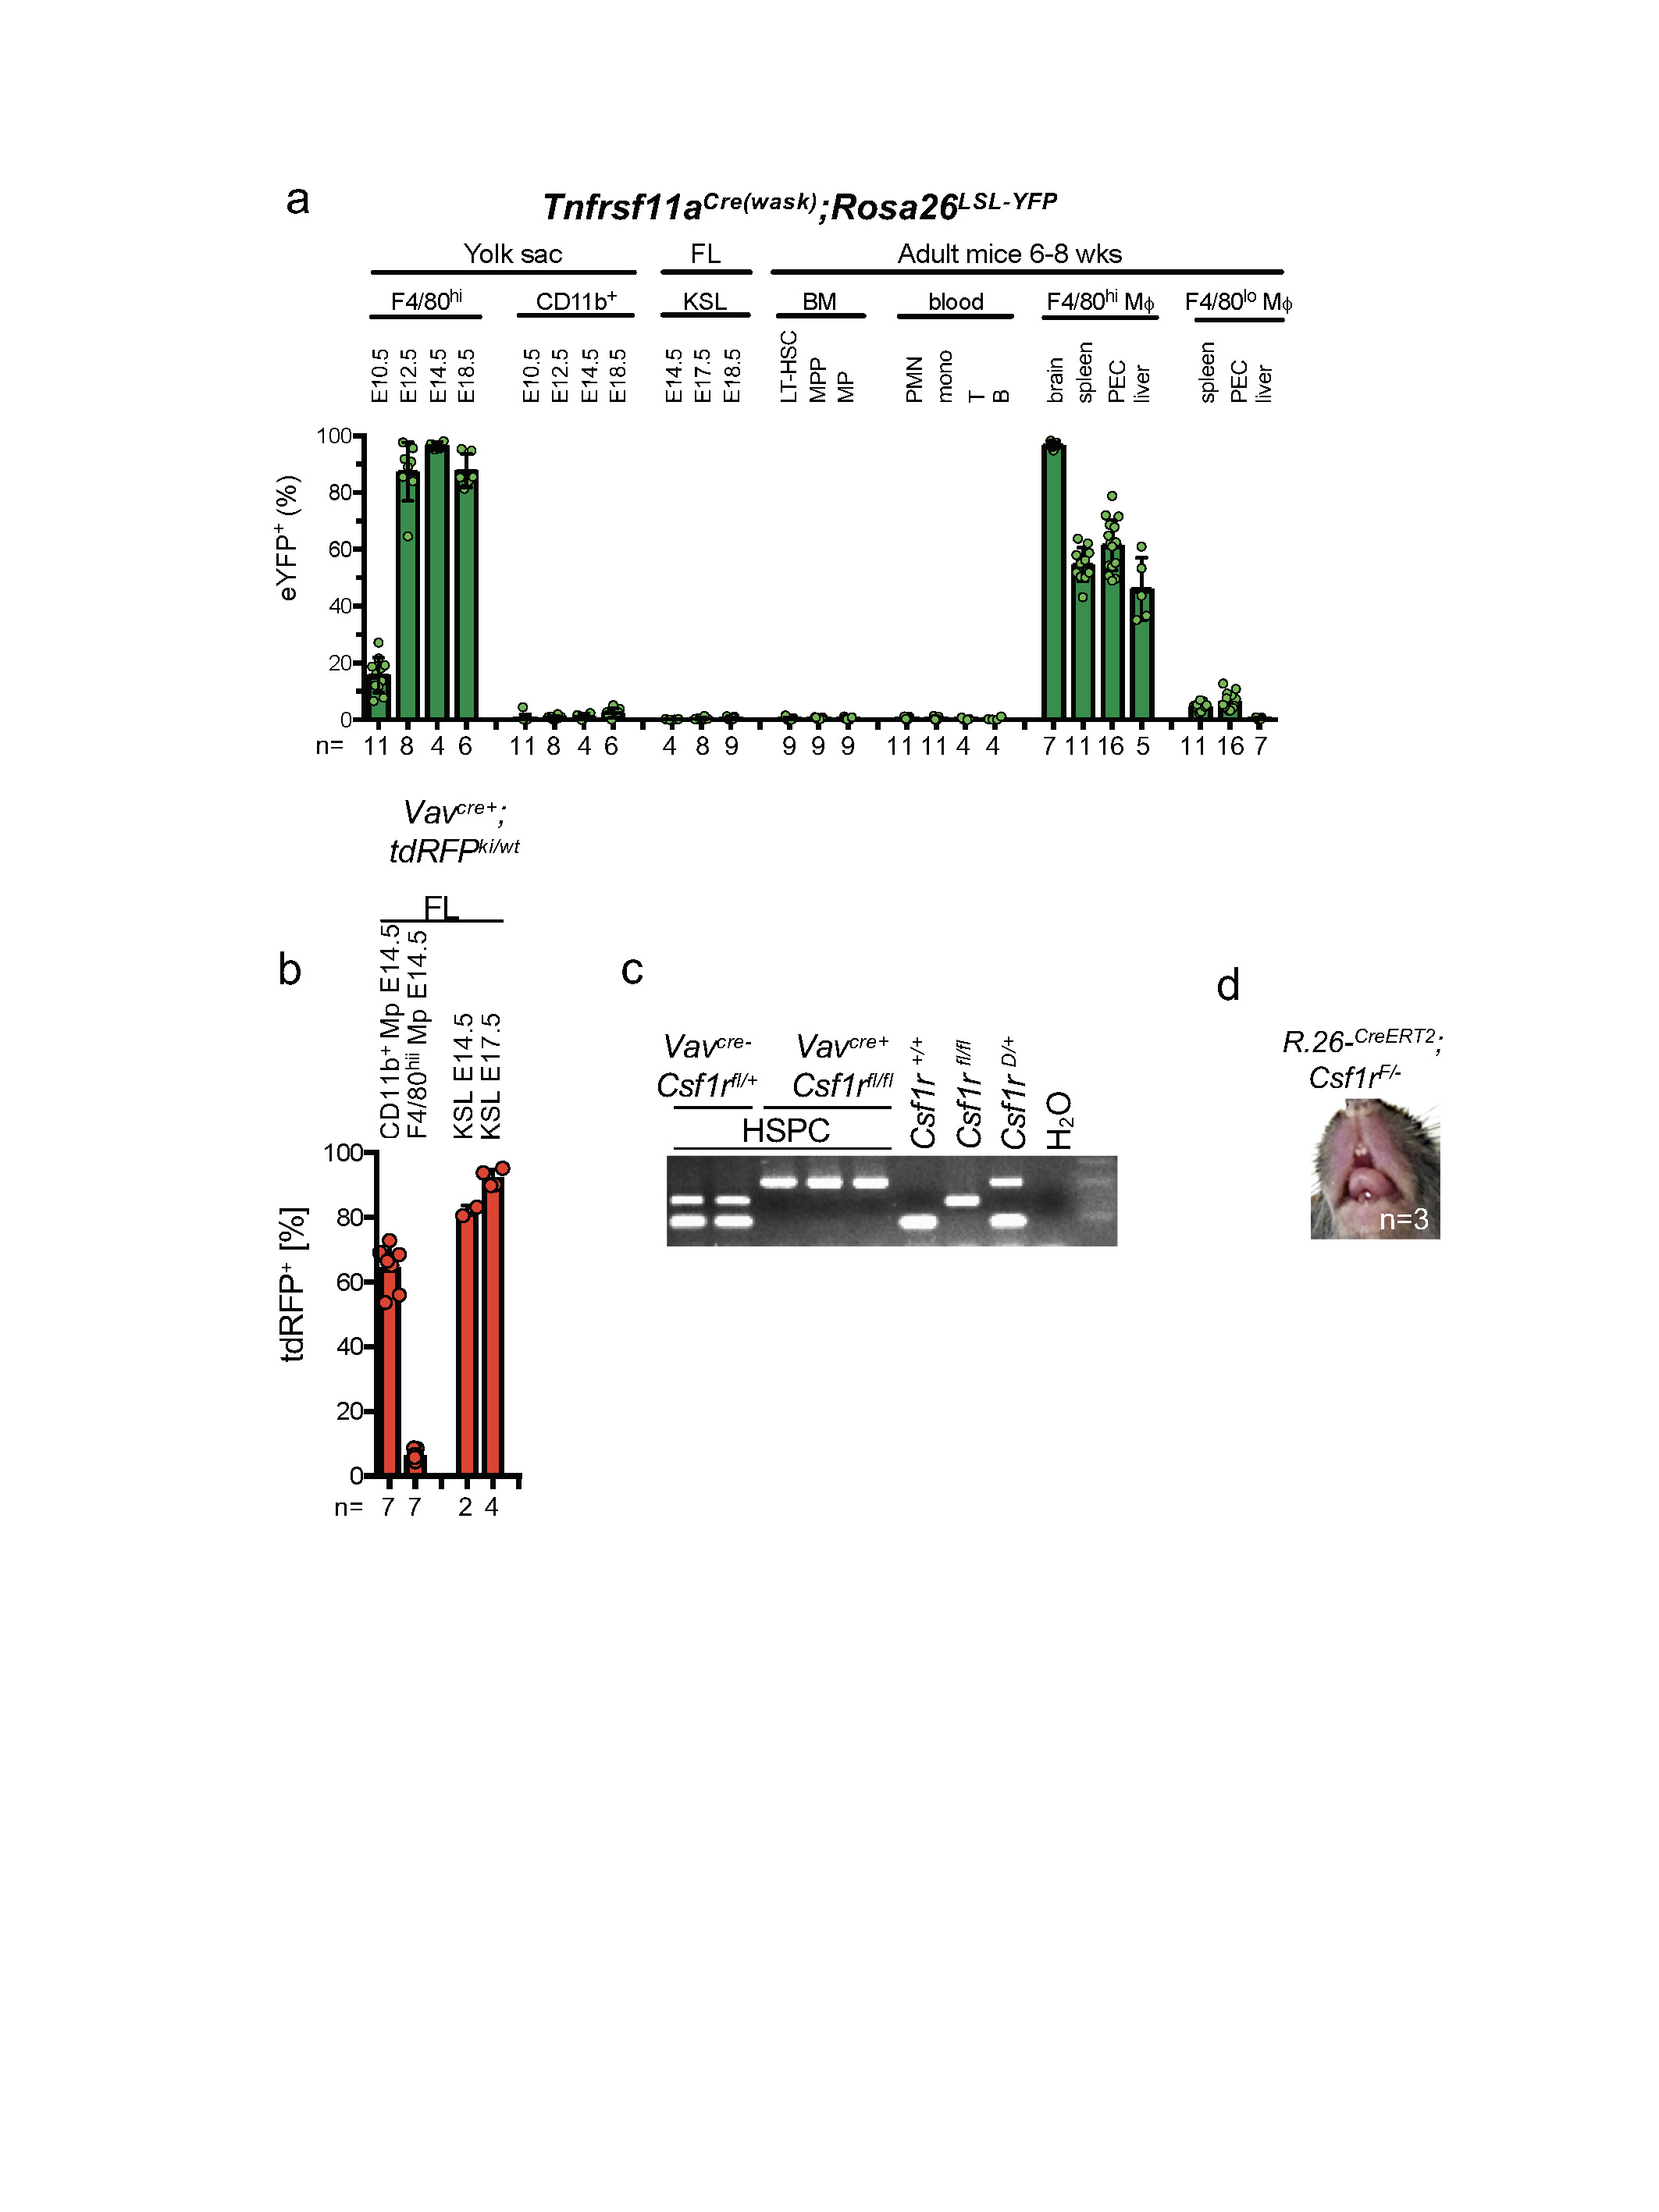
a, Bar graphs indicate percentage of cells expressing eYFP obtained by flow cytometry of Tnfrsf11aCre;Rosa26LSL-YFP cells from the indicated cell types, organs and time points. Data represent three independent experiments; n, number of mice per group indicated on x axis. b, Lineage tracing in the fetal liver of VavCre+;tdRFPwt/ki mice. n, number of mice per group indicated on x axis. c, Representive molecular analysis of Csf1r deletion in purified bone marrow haematopoietic stem and progenitor cells (HSPC) from 62-week-old VavCre;Csf1rfl/fl mice and controls (n = 5). d, Representative photograph of teeth from three-week-old Rosa26-CreERT2+;Csf1rfl/− pulsed with tamoxifen at E10.5 (n = 3 mice from three independent litters). FL, fetal liver; LT-HSC, long-term haematopoietic stem cells; MPP, multipotent progenitors; PMN, polymorphonuclear cells; mono, monocytes; T, T cells; B, B cells; PEC, peritoneal exudate cells. Data are mean ± s.d.; points represent individual mice.
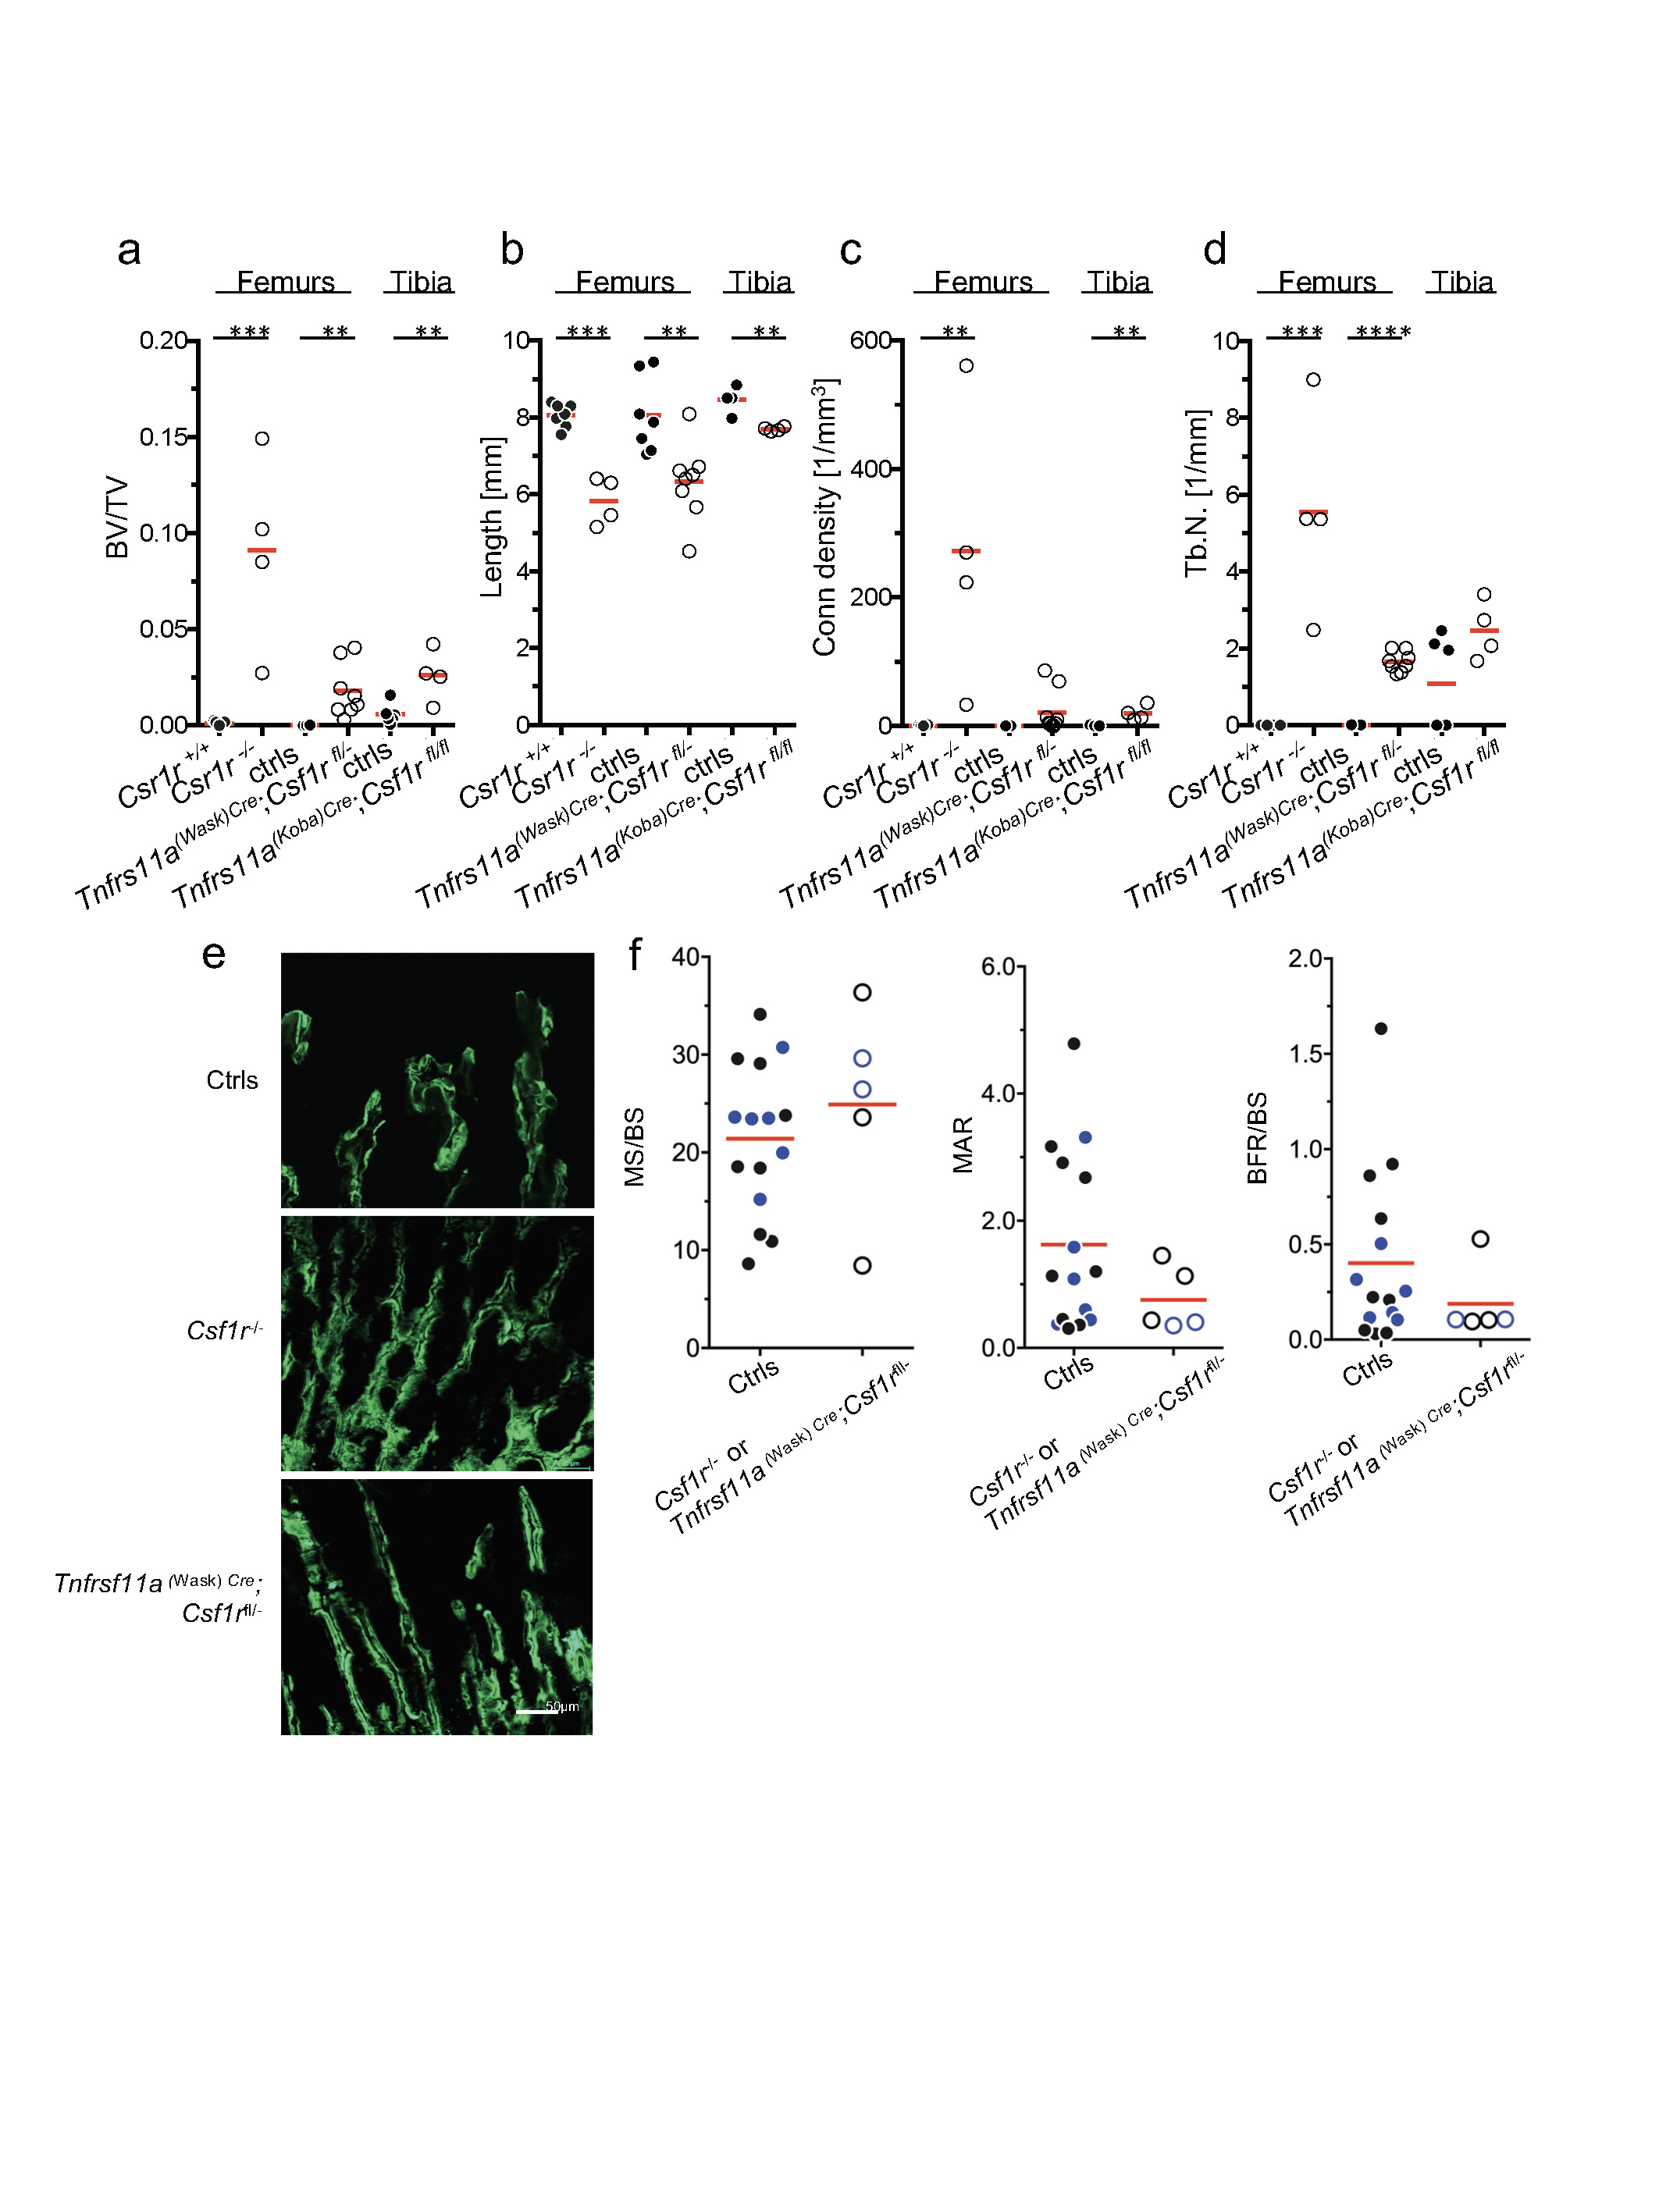
a–d, Bone volume/total volume (BV/TV, a), bone length (b), connectivity density (conn density, c), and trabecular number (Tb.N., d) were analysed by micro-CT in 21-day-old mice. Csf1r−/− (n = 4), control littermates (n = 7); Tnfrsf11aWask-Cre+;Csf1rfll−(n = 8), Tnfrsf11aWask-Cre+;Csf1rfll+(n = 7), Tnfrsf11aWask-Cre+;Csf1rfll−(n = 3) and control littermates (n = 5). e, Representative micrographs of calcein labelling (green) of femur of mice from the indicated genotypes and ages (n = 4). Scale bar, 50 μm. f, Quantification of calcein labelling by fluorescence microscopy: mineralized surface/bone surface (MS/BS), mineral apposition rate (MAR) and bone formation rate/bone surface (BFR/BS) in Tnfrsf11aWask-Cre+;Csf1rfll− Csf1r−/− (n = 4) and control littermates (n = 15). Data are mean ± s.d.; dots in graphs represent individual mice; n indicates the number of mice per group; unpaired two-tailed t-test. *P ≤ 0.05, **P ≤ 0.005, ***P ≤ 0.0005 and ****P ≤ 0.0001.
a, Short-term kinetics: EdU (20 μg g−1) was injected intraperitoneally in C57Bl6/N mice at t = 0. Mice were euthanized at the indicated time points and the percentage of EdU+ cells (blue) and the geometric MFI of EdU+ cells (red) were determined by flow cytometry, showing rapid EdU incorporation. Percentage of EdU+ cells plateaus at ~30 min, and geometric MFI plateaus at ~75 min. Following a first round of cell division, ~50% of monocytic cells are labelled after 8–12 h (n = 3–8 mice, see Source Data). b, Long-term kinetics: (1–240 h) EdU was injected as in a and percentage of EdU+ monocytic cells in bone marrow (top) and blood (bottom) was determined by flow cytometry, showing labelling of ~50% of monocytic cells for ~2 days. Labelled cells were not detectable after three days. Points represent values from individual mice; data for each time point are pooled from two to three independent experiments (see Source Data). c, Parabiosis between Csf1rCre;Rosa26LSL-YFP and Csf1rCre;Rosa26LSL-tdTomato pairs as described in (Fig. 3), paired for one-to-eight weeks, and from Csf1rCre;Rosa26LSL-YFP partners separated after four weeks of parabiosis and analysed 4 weeks, 14 weeks and 24 weeks after separation. Scatter plots represent the MFI of individual TRAP+ MGCs for YFP (y axis) and tdTomato (x axis), and histograms represent the overlaid distribution of the MFI values for YFP and tdTomato in TRAP+ MGCs at the indicated time points. Data are mean ± s.d.; dots in graphs represent individual mice; n indicates the number of mice per group.
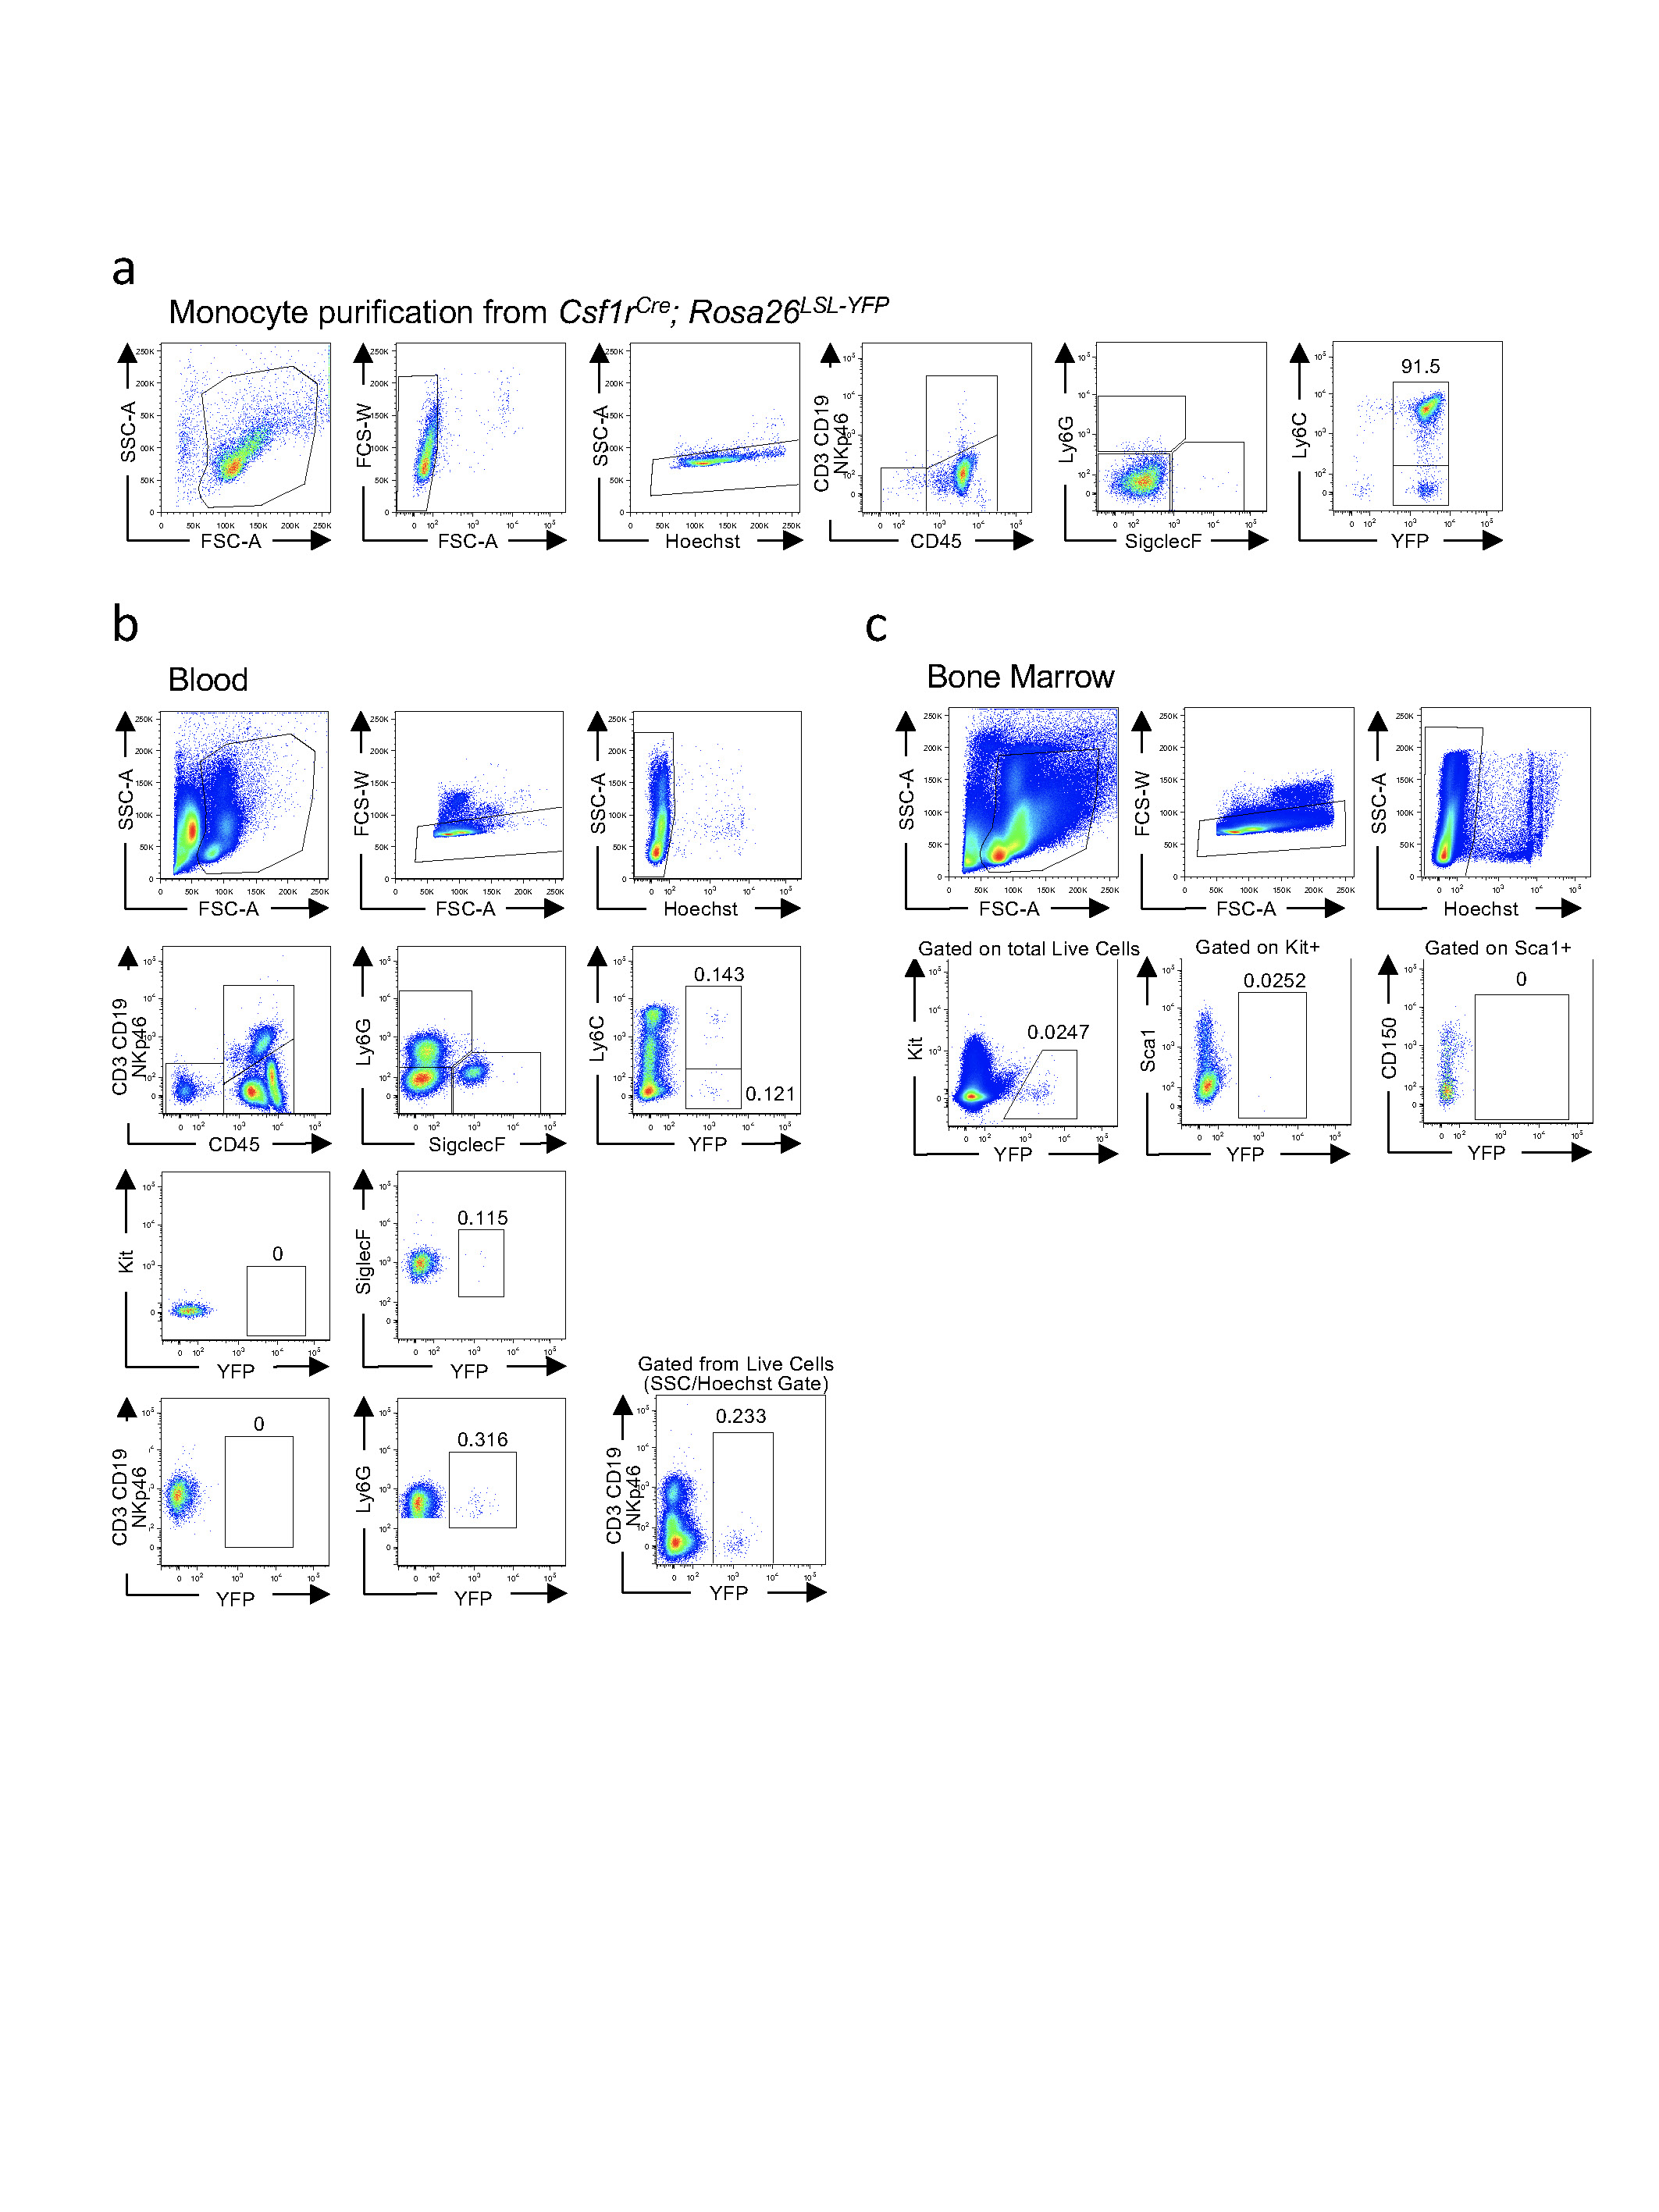
a, Representative flow cytometry plots of purified bone marrow monocytes from magnetic-bead based enrichment (MACS); percentage of live YFP+ monocytes is indicated. b, c, Representative flow cytometry plots from blood (b) and bone marrow (c) of 14-day-old mice transferred with 1 × 10⁶ YFP+ monocytes on day 5, 8 and 11, the percentage of YFP+ cells is indicated. Results shown in a–c are representative of three independent experiments.
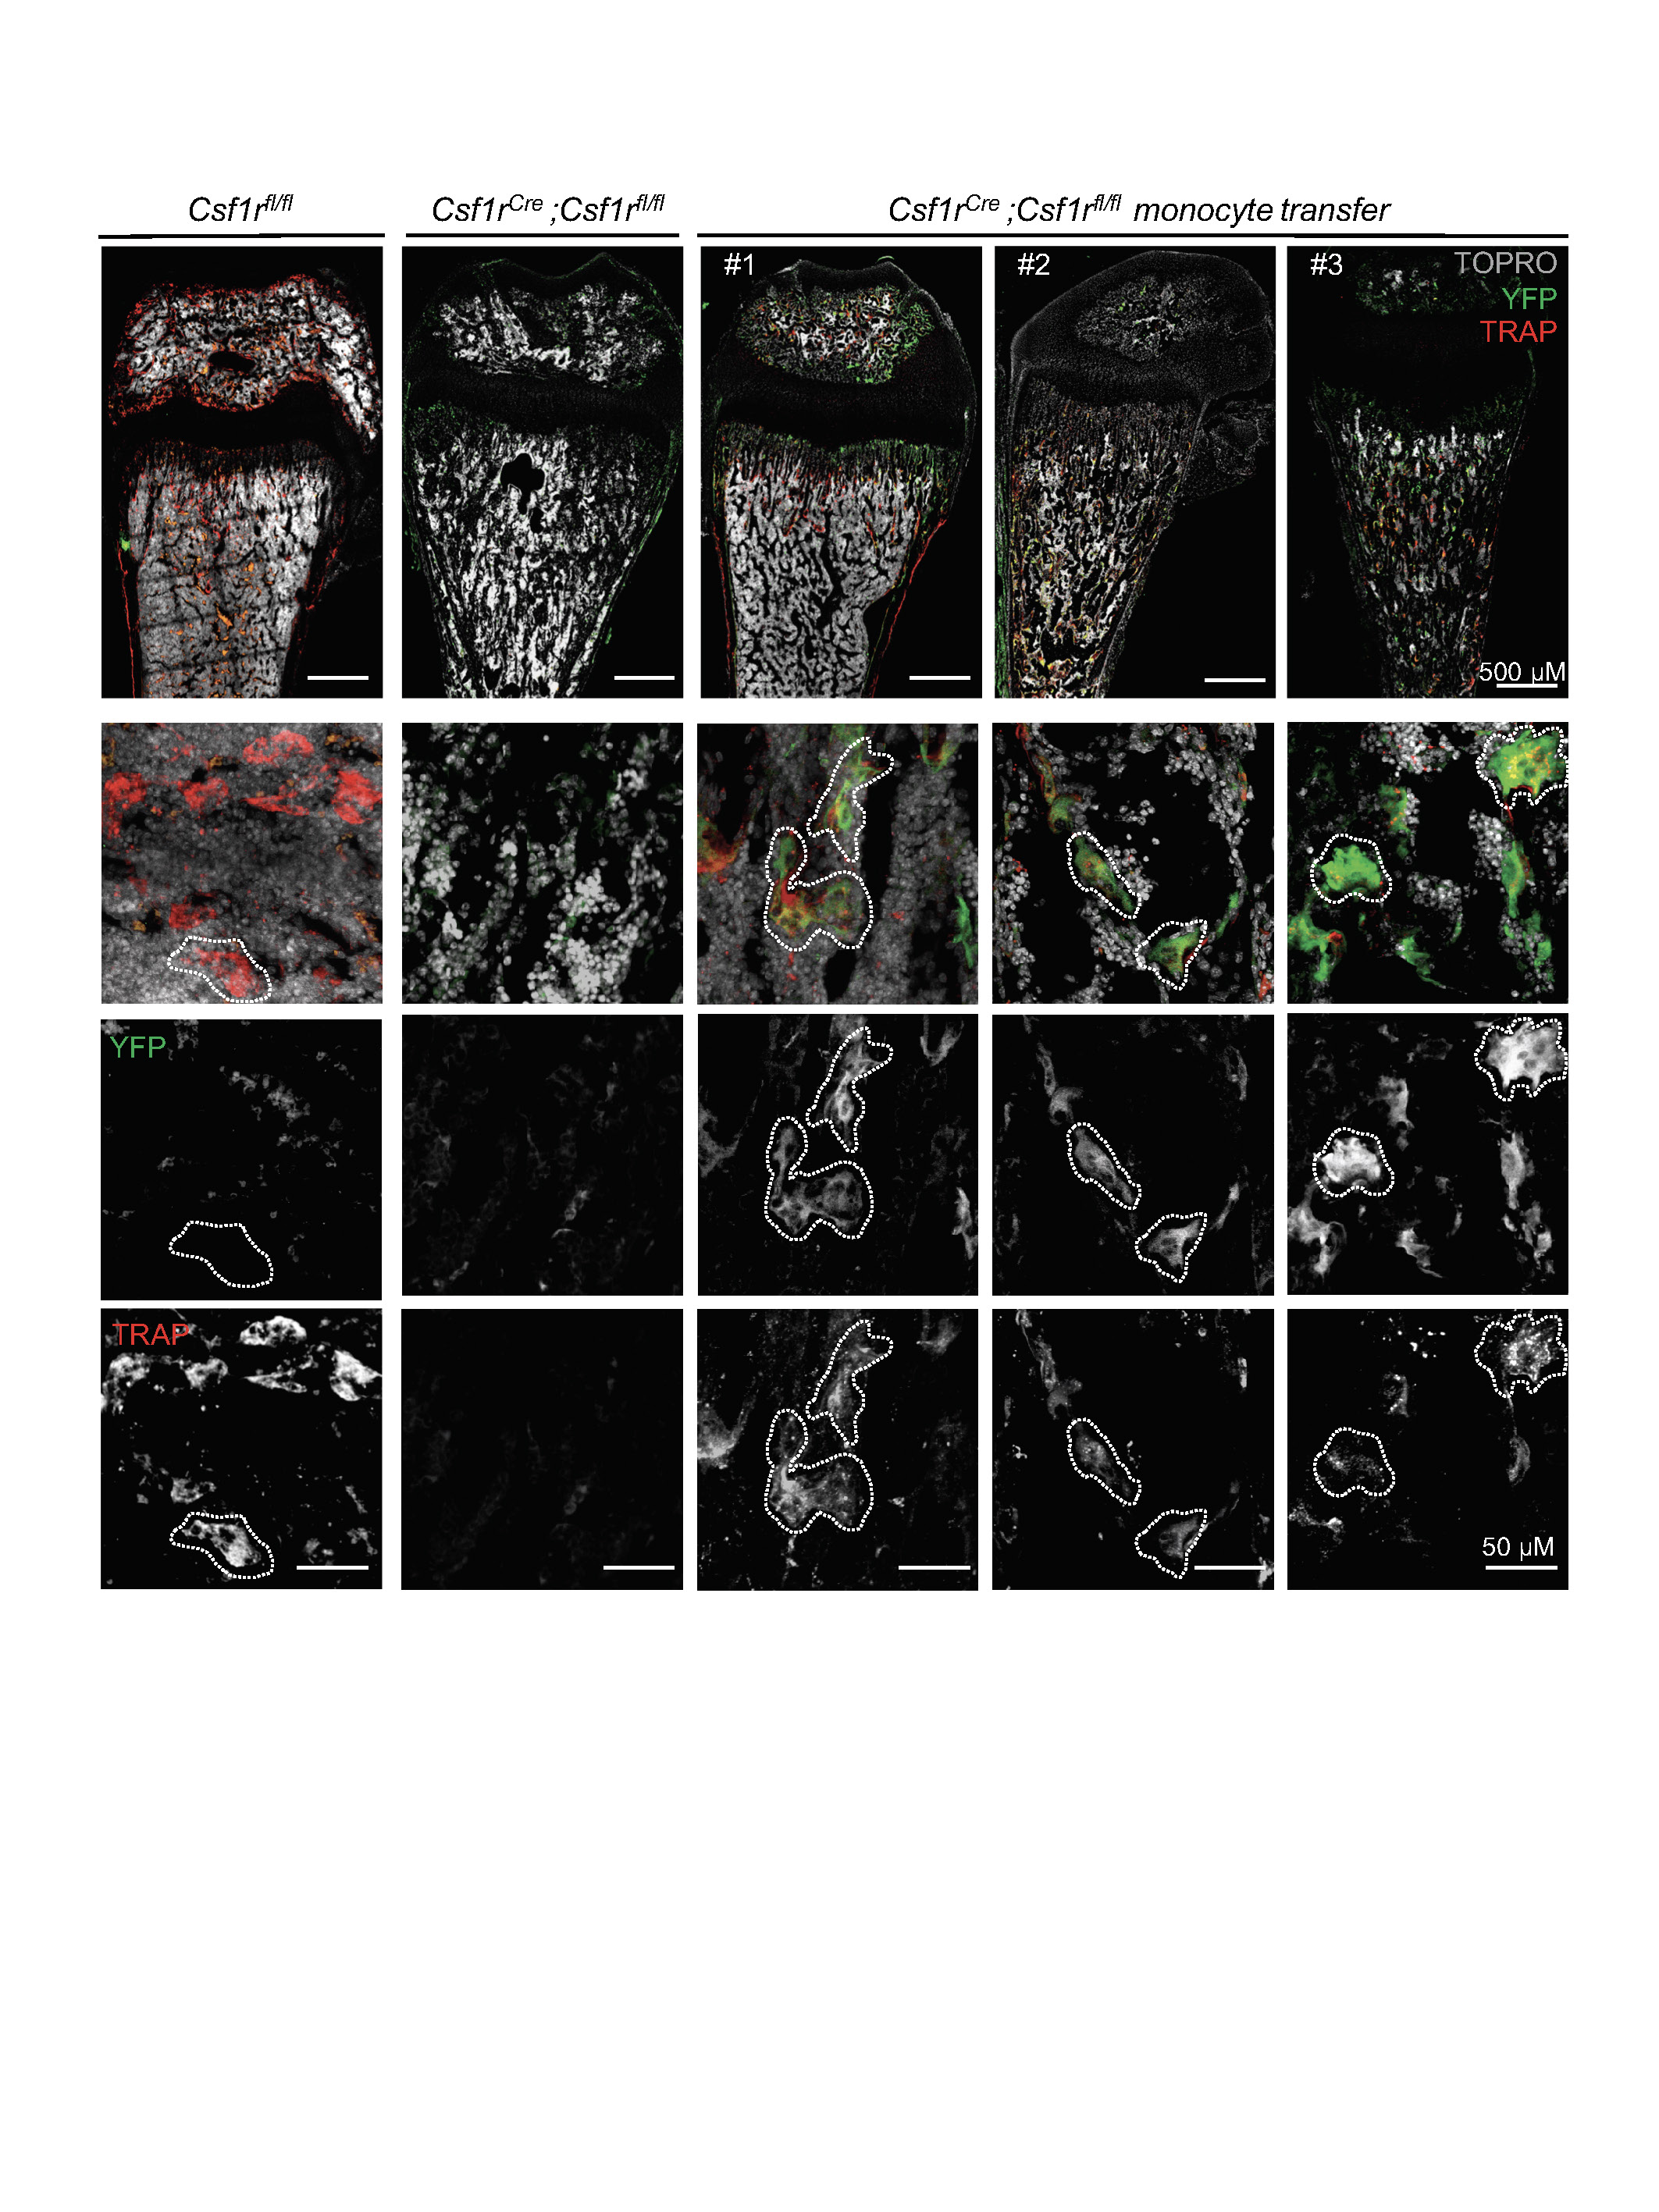
High-power confocal microscopy images of frozen sections from Csf1rCre;Csf1rfl/fl mice transferred with monocytes from Csf1rCre;Rosa26LSL-YFP and controls, stained with YFP antibody, TRAP substrate ELF97 and TOPRO-3 nuclear stain. Examples of multinucleated Trap+YFP+ cells (osteoclasts) are indicated with dotted lines. n = 3 mice from independent litters. Numbers 1–3 correspond to the mice in Fig. 4d.
Acknowledgements
This work was supported by a NIH/NCI P30CA008748 MSKCC core grant, NIH/NIAID 1R01AI130345 and NIH/NHLBI R01HL138090 to F.G. and by the German Research Foundation (DFG) through FOR2033-A03, TRR127-A5, WA2837/6–1 and WA2837/7–1 to C.W. The authors thank Y. Kobayashi, J. Pollard, T. Graf, R. Stanley, J. Frampton[Author: Are Richard Stanley John Frampton two people? If not, please correct.], T. Boehm and J. Penninger for providing mouse strains, and the MSKCC molecular cytology core for preparation of histological samples. The authors are indebted to R. O’Reilly and F. Boulad for helpful suggestions. F.G. is grateful to G. Ruth for support. This study is dedicated to the memory of Lucile Crozet.
Reviewer information Nature thanks Roland Baron, Irving L. Weissmann and Mone Zaidi for their contribution to the peer review of this work.
Footnotes
Competing Interests F.G. is a consultant and principal investigator on a Sponsored Research Agreement with Third Rock Venture (TRV). The other authors declare no competing interests.
Additional Information
Publisher’s note: Springer Nature remains neutral with regard to jurisdictional claims in published maps and institutional affiliations.
Online content
Any methods, additional references, Nature Research reporting summaries, source data, statements of data availability and associated accession codes are available at [DOI link]
References
- 1.Lacey DL et al. Osteoprotegerin ligand is a cytokine that regulates osteoclast differentiation and activation. Cell 93, 165–176 (1998). [DOI] [PubMed] [Google Scholar]
- 2.Kong YY et al. OPGL is a key regulator of osteoclastogenesis, lymphocyte development and lymph-node organogenesis. Nature 397, 315–323, doi: 10.1038/16852 (1999). [DOI] [PubMed] [Google Scholar]
- 3.Dougall WC et al. RANK is essential for osteoclast and lymph node development. Genes Dev 13, 2412–2424 (1999). [DOI] [PMC free article] [PubMed] [Google Scholar]
- 4.Hsu H et al. Tumor necrosis factor receptor family member RANK mediates osteoclast differentiation and activation induced by osteoprotegerin ligand. Proc Natl Acad Sci U S A 96, 3540–3545 (1999). [DOI] [PMC free article] [PubMed] [Google Scholar]
- 5.Yoshida H et al. The murine mutation osteopetrosis is in the coding region of the macrophage colony stimulating factor gene. Nature 345, 442–444 (1990). [DOI] [PubMed] [Google Scholar]
- 6.Dai X-M et al. Targeted disruption of the mouse colony-stimulating factor 1 receptor gene results in osteopetrosis, mononuclear phagocyte deficiency, increased primitive progenitor cell frequencies, and reproductive defects. Blood 99, 111–120, doi: 10.1182/blood.V99.1.111 (2002). [DOI] [PubMed] [Google Scholar]
- 7.Lomaga MA et al. TRAF6 deficiency results in osteopetrosis and defective interleukin-1, CD40, and LPS signaling. Genes Dev 13, 1015–1024 (1999). [DOI] [PMC free article] [PubMed] [Google Scholar]
- 8.Tondravi MM et al. Osteopetrosis in mice lacking haematopoietic transcription factor PU.1. Nature 386, 81–84, doi: 10.1038/386081a0 (1997). [DOI] [PubMed] [Google Scholar]
- 9.Takayanagi H et al. Induction and activation of the transcription factor NFATc1 (NFAT2) integrate RANKL signaling in terminal differentiation of osteoclasts. Dev Cell 3, 889–901 (2002). [DOI] [PubMed] [Google Scholar]
- 10.Lau RY & Guo X A review on current osteoporosis research: with special focus on disuse bone loss. J Osteoporos 2011, 293808, doi: 10.4061/2011/293808 (2011). [DOI] [PMC free article] [PubMed] [Google Scholar]
- 11.Coccia PF et al. Successful bone-marrow transplantation for infantile malignant osteopetrosis. N Engl J Med 302, 701–708, doi: 10.1056/NEJM198003273021301 (1980). [DOI] [PubMed] [Google Scholar]
- 12.Sorell M et al. Marrow transplantation for juvenile osteopetrosis. Am J Med 70, 1280–1287 (1981). [DOI] [PubMed] [Google Scholar]
- 13.Walker DG Bone resorption restored in osteopetrotic mice by transplants of normal bone marrow and spleen cells. Science 190, 784–785 (1975). [DOI] [PubMed] [Google Scholar]
- 14.Ballet JJ, Griscelli C, Coutris C, Milhaud G & Maroteaux P Bone-marrow transplantation in osteopetrosis. Lancet 2, 1137 (1977). [DOI] [PubMed] [Google Scholar]
- 15.Nisbet NW, Menage J & Loutit JF Bone-marrow transplantation in osteopetrosis. Lancet 2, 1236 (1977). [DOI] [PubMed] [Google Scholar]
- 16.Ash P, Loutit JF & Townsend KM Osteoclasts derived from haematopoietic stem cells. Nature 283, 669–670 (1980). [DOI] [PubMed] [Google Scholar]
- 17.Orchard PJ et al. Hematopoietic stem cell transplantation for infantile osteopetrosis. Blood 126, 270–276, doi: 10.1182/blood-2015-01-625541 (2015). [DOI] [PMC free article] [PubMed] [Google Scholar]
- 18.Frattini A et al. Rescue of ATPa3-deficient murine malignant osteopetrosis by hematopoietic stem cell transplantation in utero. Proceedings of the National Academy of Sciences of the United States of America 102, 14629–14634, doi: 10.1073/pnas.0507637102 (2005). [DOI] [PMC free article] [PubMed] [Google Scholar]
- 19.Jotereau FV & Le Douarin NM The development relationship between osteocytes and osteoclasts: a study using the quail-chick nuclear marker in endochondral ossification. Dev Biol 63, 253–265 (1978). [DOI] [PubMed] [Google Scholar]
- 20.Shalhoub V et al. Characterization of osteoclast precursors in human blood. Br J Haematol 111, 501–512 (2000). [DOI] [PubMed] [Google Scholar]
- 21.McGrath KE et al. Distinct Sources of Hematopoietic Progenitors Emerge before HSCs and Provide Functional Blood Cells in the Mammalian Embryo. Cell reports 11, 1892–1904, doi: 10.1016/j.celrep.2015.05.036 (2015). [DOI] [PMC free article] [PubMed] [Google Scholar]
- 22.Gomez Perdiguero E et al. Tissue-resident macrophages originate from yolk-sac-derived erythro-myeloid progenitors. Nature 518, 547–551, doi: 10.1038/nature13989 (2015). [DOI] [PMC free article] [PubMed] [Google Scholar]
- 23.Maroteaux P & Lamy M [Pyknodysostosis]. Presse Med 70, 999–1002 (1962). [PubMed] [Google Scholar]
- 24.Gelb BD, Shi GP, Chapman HA & Desnick RJ Pycnodysostosis, a lysosomal disease caused by cathepsin K deficiency. Science 273, 1236–1238 (1996). [DOI] [PubMed] [Google Scholar]
- 25.Taniguchi N et al. Stage-specific secretion of HMGB1 in cartilage regulates endochondral ossification. Molecular and cellular biology 27, 5650–5663, doi: 10.1128/MCB.00130-07 (2007). [DOI] [PMC free article] [PubMed] [Google Scholar]
- 26.Schulz C et al. A lineage of myeloid cells independent of Myb and hematopoietic stem cells. Science 336, 86–90, doi: 10.1126/science.1219179 (2012). [DOI] [PubMed] [Google Scholar]
- 27.Mass E et al. Specification of tissue-resident macrophages during organogenesis. Science 353, doi: 10.1126/science.aaf4238 (2016). [DOI] [PMC free article] [PubMed] [Google Scholar]
- 28.Percin GI et al. CSF1R regulates the dendritic cell pool size in adult mice via embryo-derived tissue-resident macrophages. Nature communications 9, doi: 10.1038/s41467-018-07685-x (2018). [DOI] [PMC free article] [PubMed] [Google Scholar]
- 29.Walker DG Osteopetrosis cured by temporary parabiosis. Science 180, 875 (1973). [DOI] [PubMed] [Google Scholar]
Associated Data
This section collects any data citations, data availability statements, or supplementary materials included in this article.
Supplementary Materials
a, b, Representative CT scans (nanospect CT) of four-week-old Csf1rCre;Tnfrsf11afl/fl mice. Arrows indicate skull deformation and absence of bone marrow cavity in mutant mice. c, Haematoxylin and TRAP staining of bone sections from four-week-old Csf1rCre;Tnfrsf11afl/fl mice showing closure of the bone marrow. Histology of paraffin sections (5-μm thickness) corroborates the phenotype from mice in b. d, Inguinal lymph nodes from Csf1rCre;Tnfrsf11afl/fl mice. e, A representative Csf1rCre;Tnfrsf11afl/fl and a littermate control. f, Representative CT scan reconstructions (nanospect CT) of four-week-old Tnfrsf11aKoba-Cre;Csf1rfl/fl mice. Arrows indicate skull deformation, but with presence of a bone marrow cavity in mutant mice, in contrast to those in a and b. g, Representative CT scans of Csf1rCre;Csf1rfl/fl mice. Arrows indicate skull deformation and absence of bone marrow cavity in mutant mice as in a and b. CT scans and photographs are representative of >10 litters.
a, Young Flt3Cre;Csf1rfl/fl and Flt3Cre;Tnfrsf11afl/fl mice have normal long bones. Haematoxylin and TRAP staining of bone sections from four-week-old Flt3Cre;Tnfrsf11afl/fl mice, showing normal bone structure and bone marrow cavity. b, LSK cell numbers in bone marrow from three-to-four-week-old Flt3Cre;Tnfrsf11afl/fl (n = 3) and Flt3Cre;Tnfrsf11afl/+ mice (n = 2) and littermate controls (n = 4) and from 22-week-old Flt3Cre;Tnfrsf11afl/fl (n = 5) and Flt3Cre;Tnfrsf11afl/+ mice (n = 4) and littermate controls (n = 4). c, Haematoxylin and TRAP staining of bone sections from four-week-old Flt3Cre;Csf1rfl/fl mice showing normal bone structure and bone marrow cavity. d, e, Phenotypic long-term haematopoietic stem cells (LT-HSCs) are reduced in aged wild-type mice but not in aged VavCre;Csf1rfl/− mice. f, g, LT-HSCs are reduced in in young Csf1r−/− mice, and to a lesser extent, in young Tnfrsf11aWask-Cre;Csf1rfl/− mice. Cell counts for two femurs are shown. h, Flow cytometry analysis of F4/80+ cells in brain (microglia) and epidermis (Langerhans cells) in E18.5 Tnfrsf11aCre;Csf1rfl/fl embryos and littermate controls (n = 3 per group). i, Haematoxylin and TRAP staining of bone sections from P7 Tnfrsf11aCre;Csf1rfl/fl mice and littermate controls, showing absence of the bone marrow cavity. j, Flow cytometry of fetal liver at E15.5 (representative results of three experiments). k, LSK numbers in bone marrow of three-to-four-week-old Tnfrsf11aWask-Cre;Csf1rfl/fl mice (n = 24) and littermate controls (n = 20), and Tnfrsf11aKoba-Cre;Csf1rfl/fl (n = 7) and Tnfrsf11aKoba-Cre;Csf1rfl+l mice (n = 6) and littermate controls (n = 8). l, For comparison, LSK numbers in bone marrow of three-to-four-week-old Csf1r−/− mice (n = 22) and littermate controls (n = 21). m, Representative micrographs of femur sections from four-week-old Tnfrsf11aCre;Csf1rfl/fl mice and littermate controls, stained with haematoxylin and TRAP. n, Blood leukocytes numbers in four-week-old Tnfrsf11aCre;Csf1rfl/fl mice (n = 5), Tnfrsf11aCre;Csf1rfl/+ mice (n = 6) and littermate controls (n = 12). Points represent individual mice; results from three independent experiments. Data are mean ± s.d.; n indicates the number of mice per group; unpaired two tailed t-tests. *P < 0.05, **P < 0.005, ***P < 0.0005 and ****P < 0.0001. LT-HSC, Lin−KIT+SCA1+;Kit+SCA1+CD34−FLT3−. Phenotypic short-term haematopoietic stem cells (ST-HSC), Lin−KIT+SCA1+CD34+FLT3−. MPP, multipotent progenitors; Lin−KIT+SCA1+CD34+FLT3+. Lin, CD3+CD19+NK1.1+TER119+CD11b+GR1+B220+.
a, Representative Micro-CT of femura of mice of the indicated age and genotype. b, Bone length, connectivity density (Conn density), trabecular number (Tb.N.) and trabecular spacing (Tb.Sp.) analysed by micro-CT in aged Flt3Cre;Tnfrsf11afl/fl (n = 4) and Flt3Cre;Csf1rfl/fl (n = 4) mice and control littermates (n = 7). c, Bone histomorphometry as in b, for VavCre;Csf1rfl/fl mice and control littermates (n = 5). d, e, Dynamic bone histomorphometry in aged Flt3Cre;Tnfrsf11afl/fl and Flt3Cre;Csf1rfl/fl mice using in vivo calcein labelling. d, Representative micrographs of calcein labelling (green) of femura of mice from the indicated genotypes and ages. Scale bars: 200 μm (top); 50 μm (bottom). e, Quantification of calcein labelling by fluorescence microscopy of mineralized surface/bone surface (MS/BS), mineral apposition rate (MAR), and bone formation rate/bone surface (BFR/BS) in aged Flt3Cre;Tnfrsf11afl/fl (n = 5), Flt3Cre;Csf1rfl/fl (n = 3) and control littermates (n = 10) Data are mean ± s.d.; dots in graphs represent individual mice; n indicates the number of mice per group; unpaired two tailed t-tests. *P < 0.05, **P < 0.005, ***P < 0.0005 and ****P < 0.0001.
a, Representative confocal microscopy of frozen sections from Flt3Cre;Rosa26LSL-YFP and Csf1rCre;Rosa26LSL-YFPmice analysed at E16.5 (n = 3). b, YFP-labelling efficiency in Flt3Cre;Rosa26LSL-YFP mice analysed by flow cytometry in the indicated cell populations (left), and by confocal microscopy on frozen bone sections at the indicated age (right). Magnified regions (bottom right) show YFP expression in individual osteoclasts. YFP, YFP antibody; TRAP, ELF97 fluorescent substrate; TO-PRO-3, nuclear stain. c, YFP-labelling efficiency in Csf1rCre;Rosa26LSL-YFPmice analysed as in b. Data in b and c are representative of at least three experiments per time point and genotype. Points represent individual mice. d, Genetic lineage tracing of osteoclasts in ossification centres using Csf1rMer-iCre-Mer;Rosa26LSL-YFP mice. Representative high-power confocal microscopy of embryonic femurs showing MGCs in primary ossification centres from Csf1rMer-iCre-Mer;Rosa26LSL-YFP E18.5 embryos pulsed with 4-OHT at E8.5, showing YFP expression in MGCs after cre recombination (left) and quantified as MFI (right) from cre+ (n = 8) and cre− (n = 4) (d), and unpulsed controls (e), showing the lack of YFP in cre+ (n = 4) and cre− (n = 4). Sections were labelled with antibodies against YFP, TRAP (ELF97 substrate) and TO-PRO-3.
a, Bar graphs indicate percentage of cells expressing eYFP obtained by flow cytometry of Tnfrsf11aCre;Rosa26LSL-YFP cells from the indicated cell types, organs and time points. Data represent three independent experiments; n, number of mice per group indicated on x axis. b, Lineage tracing in the fetal liver of VavCre+;tdRFPwt/ki mice. n, number of mice per group indicated on x axis. c, Representive molecular analysis of Csf1r deletion in purified bone marrow haematopoietic stem and progenitor cells (HSPC) from 62-week-old VavCre;Csf1rfl/fl mice and controls (n = 5). d, Representative photograph of teeth from three-week-old Rosa26-CreERT2+;Csf1rfl/− pulsed with tamoxifen at E10.5 (n = 3 mice from three independent litters). FL, fetal liver; LT-HSC, long-term haematopoietic stem cells; MPP, multipotent progenitors; PMN, polymorphonuclear cells; mono, monocytes; T, T cells; B, B cells; PEC, peritoneal exudate cells. Data are mean ± s.d.; points represent individual mice.
a–d, Bone volume/total volume (BV/TV, a), bone length (b), connectivity density (conn density, c), and trabecular number (Tb.N., d) were analysed by micro-CT in 21-day-old mice. Csf1r−/− (n = 4), control littermates (n = 7); Tnfrsf11aWask-Cre+;Csf1rfll−(n = 8), Tnfrsf11aWask-Cre+;Csf1rfll+(n = 7), Tnfrsf11aWask-Cre+;Csf1rfll−(n = 3) and control littermates (n = 5). e, Representative micrographs of calcein labelling (green) of femur of mice from the indicated genotypes and ages (n = 4). Scale bar, 50 μm. f, Quantification of calcein labelling by fluorescence microscopy: mineralized surface/bone surface (MS/BS), mineral apposition rate (MAR) and bone formation rate/bone surface (BFR/BS) in Tnfrsf11aWask-Cre+;Csf1rfll− Csf1r−/− (n = 4) and control littermates (n = 15). Data are mean ± s.d.; dots in graphs represent individual mice; n indicates the number of mice per group; unpaired two-tailed t-test. *P ≤ 0.05, **P ≤ 0.005, ***P ≤ 0.0005 and ****P ≤ 0.0001.
a, Short-term kinetics: EdU (20 μg g−1) was injected intraperitoneally in C57Bl6/N mice at t = 0. Mice were euthanized at the indicated time points and the percentage of EdU+ cells (blue) and the geometric MFI of EdU+ cells (red) were determined by flow cytometry, showing rapid EdU incorporation. Percentage of EdU+ cells plateaus at ~30 min, and geometric MFI plateaus at ~75 min. Following a first round of cell division, ~50% of monocytic cells are labelled after 8–12 h (n = 3–8 mice, see Source Data). b, Long-term kinetics: (1–240 h) EdU was injected as in a and percentage of EdU+ monocytic cells in bone marrow (top) and blood (bottom) was determined by flow cytometry, showing labelling of ~50% of monocytic cells for ~2 days. Labelled cells were not detectable after three days. Points represent values from individual mice; data for each time point are pooled from two to three independent experiments (see Source Data). c, Parabiosis between Csf1rCre;Rosa26LSL-YFP and Csf1rCre;Rosa26LSL-tdTomato pairs as described in (Fig. 3), paired for one-to-eight weeks, and from Csf1rCre;Rosa26LSL-YFP partners separated after four weeks of parabiosis and analysed 4 weeks, 14 weeks and 24 weeks after separation. Scatter plots represent the MFI of individual TRAP+ MGCs for YFP (y axis) and tdTomato (x axis), and histograms represent the overlaid distribution of the MFI values for YFP and tdTomato in TRAP+ MGCs at the indicated time points. Data are mean ± s.d.; dots in graphs represent individual mice; n indicates the number of mice per group.
a, Representative flow cytometry plots of purified bone marrow monocytes from magnetic-bead based enrichment (MACS); percentage of live YFP+ monocytes is indicated. b, c, Representative flow cytometry plots from blood (b) and bone marrow (c) of 14-day-old mice transferred with 1 × 10⁶ YFP+ monocytes on day 5, 8 and 11, the percentage of YFP+ cells is indicated. Results shown in a–c are representative of three independent experiments.
High-power confocal microscopy images of frozen sections from Csf1rCre;Csf1rfl/fl mice transferred with monocytes from Csf1rCre;Rosa26LSL-YFP and controls, stained with YFP antibody, TRAP substrate ELF97 and TOPRO-3 nuclear stain. Examples of multinucleated Trap+YFP+ cells (osteoclasts) are indicated with dotted lines. n = 3 mice from independent litters. Numbers 1–3 correspond to the mice in Fig. 4d.