Abstract
Systematic investigations using neutron and X-ray small angle scattering in near-physiological salt solutions were made to reveal the effect of polymer concentration, pH, and calcium ion concentration on the structure of semi-dilute solutions of four model biopolymers [polyaspartic acid, DNA, chondroitin sulfate, and hyaluronic acid (HA)] representing typical backbone structures. In the low q range (<0.01 Å−1), the scattering response I(q) is dominated by scattering from large clusters. In the intermediate q range, I(q) varies approximately as q−1, exposing the linear nature of the scatterers. In these polyelectrolyte solutions, the correlation length L displays a power law dependence on the polymer concentration c that resembles that of neutral polymer solutions. L increases with increasing calcium chloride concentration and with decreasing pH. The effect of the different divalent cations, Ba, Mg, Ca, Sr, and Mn, on the structure of DNA solutions is practically identical. However, in mixed salt conditions at the same ionic strength, the combined effect of mono- and divalent counter-ions on the structure of the polymer solutions deviates significantly from additivity. Anomalous small angle X-ray scattering observations on both DNA and HA solutions reveal that the divalent strontium counter-ions form a tight sheath around the polymer chain. The shape of the divalent ion cloud is similar in these two systems.
INTRODUCTION
Solution properties of charged polymer molecules depend strongly on their ionic environment. Charges give rise to complex inter- and intramolecular interactions that govern the short and long range behavior.1–13 These interactions can be screened by varying the pH or by adding salts to the system. In the case of strong electrostatic coupling, counter-ions assemble around the polyion. The distribution of monovalent counter-ions is usually well approximated by the Poisson-Boltzmann theory.3–5 When the electrostatic interactions involve multivalent ions, however, this model fails.14,15
Recently, the understanding of the effect of multivalent cations on structure formation in polyelectrolyte solutions has significantly progressed, owing to advances in the field of molecular dynamics simulations.15–19 It has been shown, for instance, that in these systems, a net attractive interaction occurs between like charged macroions and that the charged molecules can attract each other due to charge fluctuations in the counter-ion distribution.20,21 Under certain circumstances, ordered structures appear. Depending on the dynamics of the interactions, metastable states may also develop. In the presence of divalent counter-ions, stiff polyelectrolyte chains may spontaneously form bundles and create a network structure.13,21 In polymer solutions composed of long flexible chains, aggregation can occur. With monovalent counter-ions, aggregation is usually less pronounced.
Although many experimental studies have been performed on polyelectrolyte solutions in different ionic environments, relatively little attention has been paid to the biologically relevant situation in which both mono- and divalent counter-ions are present. Flory and Osterheld studied the effect of mono- and divalent counter-ions on the extension of polyacrylic acid chains in dilute solutions and found that at a fixed degree of neutralization, the chain expansion factor varies inversely with the ionic strength of the solution.22 However, systematic investigations into the effect of the ionic environment on the structure and interactions of biopolymer solutions are lacking. This knowledge is essential to understand physiological processes in which ions play a central role. For example, the ion-induced assembly is a general phenomenon that appears in a variety of biological situations, such as wound healing and cell and tissue development, as well as in many pathological conditions.
The aim of this study is to determine the effect of the ionic environment on the solution structure of four anionic polymers that model the three major classes of biomacromolecules vital for life (proteins, polynucleic acids, and polysaccharides). To model a protein chain, we used polyaspartic acid (PASP), which possesses a peptide backbone. We also study DNA, a typical polynucleotide and chondroitin sulfate (CS) and hyaluronic acid (HA). The latter are charged polysaccharides that are major constituents of the extracellular matrix. Small angle neutron scattering (SANS) and small angle X-ray scattering (SAXS) are used to determine the organization of the molecules over a broad range of length scales, 10 Å < q−1 < 500 Å, where q is the scattering wave vector, q [=(4π/λ)sin(θ/2)], θ is the scattering angle, and λ is the wavelength of the incident radiation. The effects of polymer concentration, pH, and calcium ion concentration are investigated by these techniques in near physiological solution conditions. Anomalous small angle X-ray scattering (ASAXS) is used to determine the ion distribution around the polymer chains.
This paper is organized as follows. After a brief description of the theoretical background and the materials and methods, differences between the scattering responses of these polyelectrolyte solutions and those of neutral polymers are discussed. We present the results of SANS and SAXS measurements made on the four biopolymer solutions at different polymer concentrations in 0.1M NaCl. The organization of the different polymers in the semi-dilute concentration range is investigated by comparing the concentration dependence of the small angle scattering response. The effects of pH and calcium ions on the characteristic length scales are then examined. To determine the shape of the divalent ion cloud surrounding the polymer chains in physiologically relevant salt conditions, ASAXS measurements were made on the solutions of HA and DNA.
THEORY
Scattering from macromolecular solutions
Simple binary solutions of neutral flexible polymers consist of a polymer component and a low molecular weight solvent. The scattering properties of neutral semi-dilute flexible polymer solutions23 are described by a correlation length ξ that is governed by short range van der Waals interactions and defines the average spatial extent of the thermal concentration fluctuations. The correlation length can be determined by small angle scattering techniques. In the case of random thermal concentration fluctuations, this scattering response may be described by an Ornstein-Zernike function24
| (1) |
where ∆ρ2 is the contrast factor25 between the polymer and solvent, kB is the Boltzmann constant, T is the absolute temperature, Π is the osmotic pressure of the system, and c is the polymer concentration. In this uniform solution, the only characteristic length scale is ξ, which decreases with increasing concentration.
When the chain contains rigid or semi-rigid segments, a different correlation length is required, a situation that has been addressed theoretically26,27 for infinitely thin chains. The scattering function from a system of linear segments must vary as 1/q. For real systems of finite cross-sectional area, however, two length scales are needed to describe the scattering function, one for the length and the other for the cross-sectional radius R. At high concentration, the molecules overlap to form a network in which the linear character of the segments can be detected in the appropriate q range. This happens when the resolution q of the observation is high enough to distinguish a length L of a given sequence of segments from among the many overlapping chains. To describe the scattering response, we employ the following empirical expression,28 which contains three adjustable parameters and is applicable in the Guinier approximation qR < 1:
| (2) |
The first factor in the denominator of Eq. (2) simulates the scattering by a thin rigid rod,29 and the second factor is the low-q approximation for its finite cross section. We recall however that in the overlapping regime, the concentration fluctuations, which give rise to the scattering, correspond to fluctuations in the separation between the semi-rigid rod-like elements. This implies that L is a measure of the distance between neighboring chains. In neutral polymer solutions, the scattering intensity at q = 0 is defined by Ref. 30,
| (3) |
In polymer solutions in which molecular associations or other large-scale structures are present, the description of the scattering response requires an additional term. This feature has been observed in many systems.28,31–35 In polyelectrolyte solutions, the molecular associations give rise to an extra scattering contribution at small angles, which takes the form of a power law
| (4) |
where B is a constant and m > 3.21 The total scattering intensity thus becomes
| (5) |
At high values of q, however, beyond the range explored by SANS, the total scattering curve is no longer satisfactorily described by Eq. (5). To account more realistically for the shape of the polymer chain, we replace the cross-sectional form factor 1/(1 + q2R2) in Eq. (5) by that of a uniform solid cylinder of external radius R, i.e., [J1(R,q)/qR]2, where J1(R,q) is the cylindrical Bessel function of order 1. The total scattering intensity now becomes
| (6) |
ASAXS from polymer solutions
ASAXS provides a unique method of determining the counter-ion distribution in polyelectrolyte solutions. In these systems, the scattering intensity contains a contribution from the structure factor of the polymer as well as from that of the counter-ions associated with the polymer.35–42
The total scattering function can be defined in terms of the differences in electron density (ρj(E) − ρs) between the solvent and the other components (j = polymer, resonant ion) of the solution. Thus
| (7) |
where r0 (2.818 × 10⁻¹³ cm) is the classical radius of the electron, E is the energy of the incident X-ray beam, and Sjk(q) is the partial structure factor, in which j and k represent either the polymer (p) or the ion cloud (x). In the vicinity of the absorption edge, ρx is energy-dependent. Thus
| (8) |
where NA is Avogadro’s number and vx and f(E) are, respectively, the volume and the effective number of electrons f of the counter-ion. As the energy E of the incident photons approaches the absorption threshold from below, the electron density ρx(E) of the counter-ion decreases, while that of the polymer and of the solvent remains constant.
The difference between the scattering intensity I(q) from a sample at two different energies E1 and E2 is then given by
| (9) |
where E1 and E2 are, respectively, the reference energy measured far below the absorption edge and that just below the edge, where the anomalous effects are the strongest.43,44 In the present system consisting of water, polymer, and strontium ions, ρs ≈ 3 × 10²³ e/cm3, ρp ≈ 6 × 10²³ e/cm3, f ≈ 30, and vx ≈ 6 × 10⁻²⁴ cm3. In the two systems studied, DNA and HA, it is found that Sxx(q) is proportional to Sxp(q). In the discussion of the ion distribution, we therefore simply base our observations on the difference ΔI(q,E1,E2) without resorting to its component parts.
EXPERIMENTAL
Sample preparation
Polyaspartic acid (PASP) solutions were made from the sodium salt of PASP (Sigma, Mw = 42 kDa) in D2O. The PASP concentration ranged between 2% and 20% w/w in 0.1M NaCl. The CaCl2 concentration was varied between 0 and 0.2M.
DNA solutions were prepared from a sodium salt of double stranded DNA (Sigma, salmon testes, Mw = 1.3 × 10⁶) in 0.1M NaCl solution. The percentage of the G-C content of this DNA was 41.2%. Different amounts of calcium chloride were added to the DNA solutions. The final concentrations of the DNA solutions were 1%, 2%, 3%, and 6% by weight. In the case of the 6% solution, five calcium concentrations were studied, = 0, 0.02, 0.04, 0.06, and 0.08M. At higher concentrations, phase separation occurs in this system. SANS measurements were made below this threshold concentration.
Chondroitin sulfate (CS) solutions were prepared by dissolving the sodium salt of CS (Sigma-Aldrich, Mw = 40 kDa) in D2O. The CS concentration ranged between 1% and 20% w/w in 0.1M NaCl. Concentration of added calcium chloride was varied between 0 and 0.2M. The samples were allowed to homogenize for 2–3 days.
Sodium hyaluronate (HA, Sigma Mw = 1.2 × 10⁶, Mw/Mn = 1.5) solutions were made in H2O containing 0.1M NaCl at different HA concentrations in the range 1%–4% w/w. Above 4% w/w polymer concentration, the HA solutions exhibit physical gelation, even in the absence of divalent cations. Calcium chloride concentration was varied in the range 0–0.2M. The sodium chloride concentration (0.1M) and pH (=7) were identical in all samples.
Small angle neutron scattering measurements
SANS measurements were made on the NG3 instrument at NIST, Gaithersburg, MD. For these measurements, the solvent used in all samples was D2O. The temperature was maintained at 25 ± 0.1 °C during the experiments. Measurements were made at two sample-detector distances, 2.5 m and 13.1 m, with incident wavelength 8 Å. After radial averaging, corrections for incoherent background, detector response, and cell window scattering were applied. The intensity normalization was made with the NIST standard samples.45
The ASAXS measurements were done on the BM2 beam line at the European Synchrotron Radiation Facility (ESRF). The pixel size of the 2D charge coupled device (CCD) detector was 50 µm. Corrections were made for dark counts and camera distortion. The measured intensities were normalized using a standard polyethylene sample (lupolen) of known scattering cross section. The transfer wave vector range explored was 0.008 Å−1 ≤ q ≤ 1.0 Å−1, where the upper limit qmax defines the spatial resolution that can be achieved in this type of measurement. To limit radiation damage effects, sequences of exposure times were limited to 50 s and the position of the beam in the sample was changed at each exposure. No detectable effects of radiation damage were found in any of the samples.
At the high values of q explored in this investigation, solvent background corrections are of paramount concern, particularly owing to the fluorescent signal generated close to the absorption edge. The fluorescent signal was corrected by subtraction of a constant background. To maintain the sample thickness as closely as possible, identical to that of the background solution, specimens were held between 25 µm thick mica windows separated by a 2 mm Teflon washer.
As the absorption threshold of the calcium counter-ions occurs at too low energy (4.038 keV) for viable operation of the X-ray beam line, these ions were substituted by strontium (16.1047 keV). H2O was used as the solvent for all these samples. The SAXS measurements were made at six energies below the strontium absorption edge: 15.800, 15.984, 16.056, 16.085, 16.097, and 16.102 keV.
RESULTS AND DISCUSSION
Concentration dependence of the SANS profiles
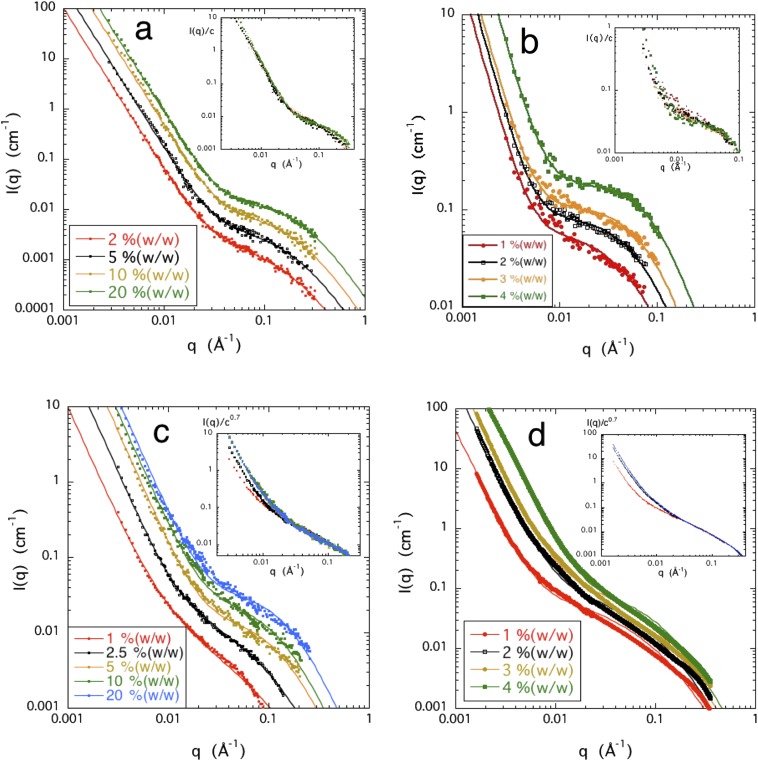
Figure 1 shows the SANS profiles of the four biopolymer solutions in 0.1M NaCl. All the curves possess the same general shape represented by Eq. (5). The power law slope of the low q feature always lies in the range 3 < −m < 3.5, typical of scattering from rough surfaces. As no change in slope is detected at the lowest values of q, the size of the large clusters giving rise to the surface scattering cannot be estimated. In the intermediate q range (0.01 Å−1 < q < 0.1 Å−1), a plateau-like region appears, followed by a further decrease in intensity at high q. The latter feature corresponds to the cross-sectional radius of the molecule. In all cases, the scattering intensity is an increasing function of the polymer concentration over the whole q range.
FIG. 1.
SANS or SAXS responses of polymer solutions in 0.1M NaCl of (a) PASP, (b) DNA, (c) CS, and (d) HA (SAXS) for different polymer concentrations. Continuous lines through the data points are fits to Eq. (5). Insets: Reduced intensity I(q)/cp (a) PASP, with p = 1, (b) DNA, with p = 1, (c) CS, with p = 0.7, and (d) HA with p = 0.7.
As mentioned in the section titled Theory, if the particles in a given system are independent, the scattering intensity is proportional to the concentration c. Deviation from proportionality is thus an indicator of interactions among the scattering elements. The insets in Fig. 1 show the intensities, normalized by the concentration, as a function of q for the different systems. In these figures, the normalization I(q)/cp was adopted, where p < 1 and p > 1 correspond, respectively, to repulsive and attractive interactions. The value of p was selected to obtain coincidence of the reduced intensity in the high q region where the signal originates from the individual, non-overlapping, chain segments.
For PASP, to a good approximation, all the curves I(q)/c superimpose over the whole q range. PASP thus displays single (individual) chain behavior, not only in the high q range (as in neutral polymer solutions) but also at lower q, where an overlap among the coils would normally prevail in similar solutions of a higher molecular weight polymer.
For the DNA solutions [Fig. 1(b)], the curves I(q)/c superimpose in the high q range, like PASP. Below q ≈ 0.02 Å−1, however, the data are too noisy to detect a trend, probably as a result of slow structure formation in these high viscosity solutions.
In the CS and HA solutions, the intensity increases more weakly than c. To obtain superposition in a representation of the general form I(q)/cp, I(q) in the high q range must be divided by c0.7 in both systems. In these solutions, normalization of the scattering curves I(q) by the polymer concentration reveals weak residual electrostatic interactions in 0.1M NaCl. However, the chemical composition and structural flexibility of the polymers, as well as hydrophobic interactions (i.e., the full complexity of polyelectrolyte molecules), may also play an important role.
There are many variables controlling the behavior of polyelectrolyte solutions. Charged macromolecules are correlated both topologically and electrostatically, and they interact with the ions in the solution. The electrostatic coupling between polyelectrolyte chains and the surrounding ion cloud gives rise to solution properties that differ from neutral polymer solutions. Hydrogen bonding, van der Waals interactions, excluded volume effects, etc. also contribute to the complexity of the systems. The collective behavior of these interactions is poorly understood.46
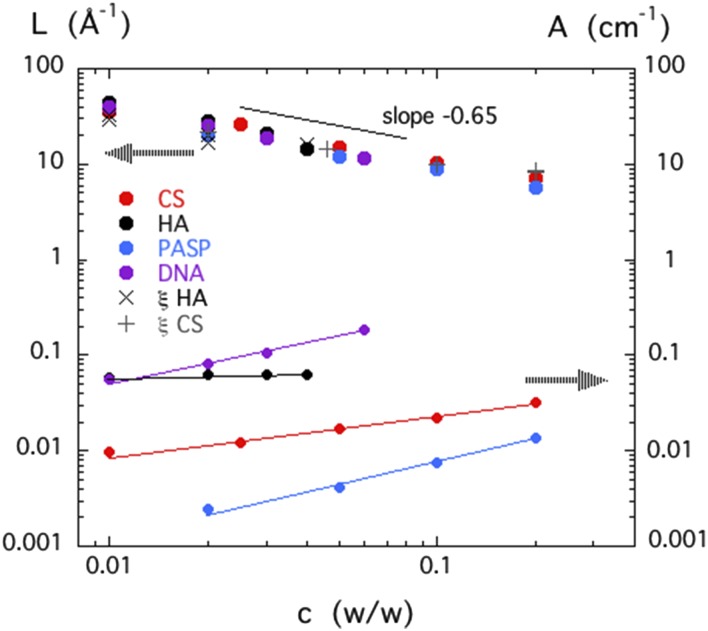
The SANS results were analyzed in terms of Eq. (5). Within experimental error, R was found to be independent of concentration, which is consistent with its role as the cross-sectional radius of the polymer chain. (Values found for R were DNA 10 ± 1 Å, PASP 3.5 ± 1 Å, and HA and CS 5.5 ± 1 Å.) The values of L and A calculated from the fits are displayed in Fig. 2 as a function of the polymer concentration. For the four different biopolymer solutions, all the values of L lie on a master curve in the form of a power law with slope −0.65 ± 0.05. It is notable that this exponent is close to that reported for the concentration dependence of the correlation length ξ in neutral polymer47,48 and polyelectrolyte49 solutions. The agreement between the values of L and the dynamic light scattering measurements of the hydrodynamic correlation length, both in CS and HA, is evidence that the length L is the thermodynamic correlation length of the solution.
FIG. 2.
Left hand axis: concentration dependence of the length L determined from the fits of Eq. (5) to the SANS responses of the CS, HA, PASP, and DNA solutions in 0.1M NaCl. Also shown are the values of the hydrodynamic correlation length ξ measured in similar solutions of HA (×) and chondroitin sulfate (+) by dynamic light scattering. Right hand axis: scattering amplitude A determined from the fits of Eq. (5) to the same SANS measurements.
For each system, A exhibits a weakly increasing power law dependence on the concentration. This behavior contrasts with the scaling prediction for neutral polymer solutions, where, in good solvent conditions,
| (10) |
In neutral polymer solutions, A thus decreases weakly as a function of the concentration.23
In summary, the above results show that in 0.1M NaCl solution, the small angle scattering response of the four biopolymer systems displays significant deviations from that of solutions of flexible neutral polymers, as described by Eq. (1). At low q, a strong upturn in intensity is observed, the power law slope of which is greater than −3, characteristic of surface scattering. This feature is present both in polymers having hydrophilic (HA, CS, PASP) and relatively hydrophobic (DNA) backbone. Normalization of the scattering curves I(q) by the concentration reveals residual electrostatic interactions in 0.1M NaCl solution. In PASP and in DNA (at q > 0.02 Å−1), the scattering intensity is proportional to the polymer concentration c. HA and CS, however, exhibit deviation from proportionality. In these solutions, to obtain coincidence at high q, the scattering intensity must be normalized by c0.7, with the implication that the residual electrostatic interaction between adjacent polymer chains is repulsive. The similarity between the behavior of HA and CS can be attributed to the similar chemical architecture of the two polymers. PASP differs from HA and CS not only in its chemical composition but also in its flexibility. The persistence length of the PASP chain is much shorter (<10 Å) than that of the polysaccharide chains (≈100 Å), and its cross-sectional radius is almost 50% smaller. Consequently, the interpenetration of the PASP molecules is less pronounced, and they behave as independent scattering units. In the case of the DNA, the attractive interaction between the hydrophobic segments may compensate the residual repulsive electrostatic forces.
Effects of ionic environment
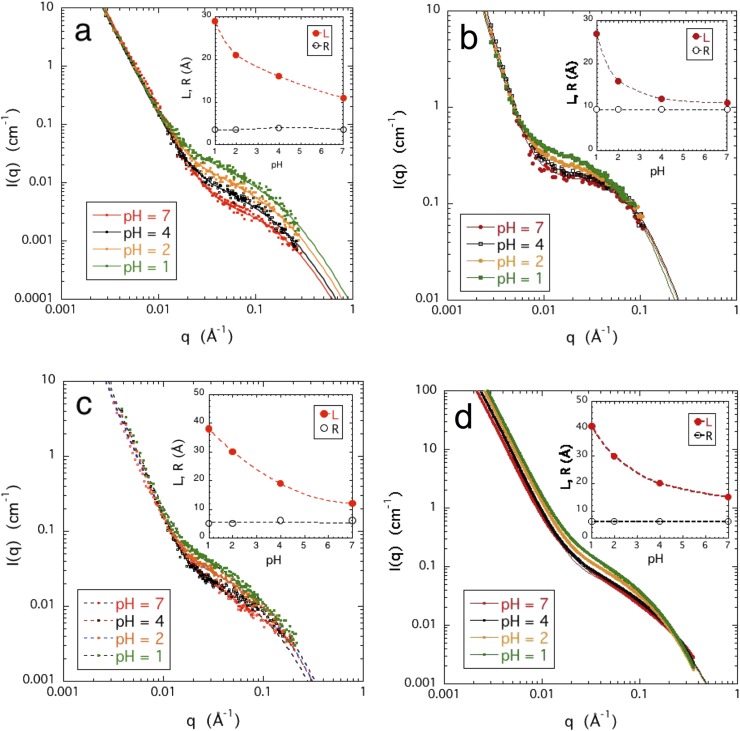
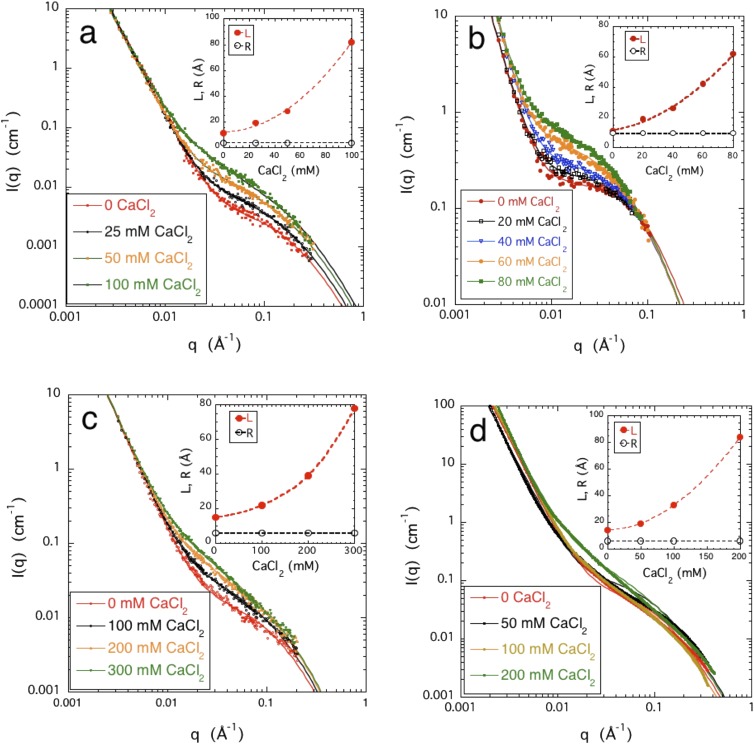
SANS measurements were also made on the biopolymer solutions as a function of pH (Fig. 3) and of calcium ion content (Fig. 4). These changes in the ionic environment modify both the effective charge density on the polymer chains and the electrostatic screening in the solvent. With decreasing pH, weak polyacids become progressively protonated as the counter-ions are replaced by the hydrogen ions. Polyacids possessing a hydrophobic backbone precipitate at low pH. Increasing the calcium ion concentration has two important consequences: progressive screening of the electrostatic interactions in the solvent and condensation of the ions on the oppositely charged polymer. Both effects reduce the repulsive electrostatic interactions between neighboring molecules. We first discuss the effect of pH and then that of calcium ions.
FIG. 3.
pH dependence of small angle scattering responses. (a) PASP 5% w/w (SANS); (b) DNA 4% w/w (SANS); (c) CS 5% w/w (SANS); and (d) HA 4% w/w (SAXS). Inset shows the pH dependence of the parameters L and R [Eq. (5)].
FIG. 4.
Variation of SANS responses with CaCl2 concentration. (a) PASP 5% w/w (SANS); (b) DNA 4% w/w (SANS); (c) CS 5% w/w (SANS); and (d) HA 4% w/w (SAXS). Inset shows the calcium ion dependence of the parameters L and R [Eq. (5)].
Figure 3 shows the SANS response I(q) of the four polymer solutions at different pH. To avoid precipitation, these measurements were confined to pH ≥ 1. Inspection of the figure shows that Eq. (5) provides a satisfactory fit to I(q) in all cases. In both the low and high q regions, I(q) is influenced only weakly by the pH, but in the intermediate range (0.01 Å−1 < q < 0.08 Å−1), the scattering intensity increases with decreasing pH. This increase is consistent with the general behavior of polymer solutions close to phase separation, in which the intensity increases due to the increasing amplitude of the thermodynamic fluctuations as the transition is approached. The insets of Fig. 3 show that in all the solutions, the spatial range L of the fluctuation increases with decreasing pH. In solutions of weak polyacids, it is expected that at pH < pKa, the thermodynamic properties, such as solubility and osmotic pressure, change abruptly. In the present solutions, however, the shape of the scattering profile displayed no sign of qualitative change in the pH range investigated (1 ≤ pH ≤ 7).
Figure 4 shows for each system how the SANS response varies with increasing calcium chloride concentration. The effect of calcium ions is qualitatively similar to that of the pH. The low q-region of the SANS curves is practically unaffected by the addition of CaCl2. The increase in scattering amplitude in the intermediate q region is much greater than that due to pH and is accompanied by a more pronounced increase in L. In the PASP solution, for example, L increases by a factor of more than 7 (from 11 to 82 Å) upon addition of 0.1M CaCl2, while it changes by a factor of less than 3 (from 11 to 29 Å) when the pH is reduced from 7 to 1. We note that DNA solutions become unstable and precipitate at higher CaCl2 concentrations. This behavior may reflect the formation of calcium-bridged supra-structures. Such an effect could be more significant for double stranded DNA, which has less solvent-accessible “surface area” of hydrophobic bases than for single stranded DNA.
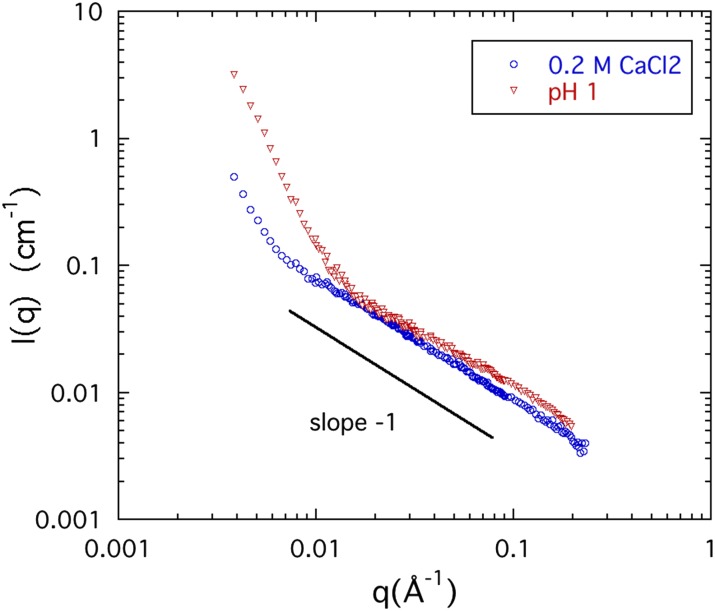
A striking feature of the SANS curves, both in their pH and calcium chloride dependence, is the progressive extension to lower values of q of the linear region (i.e., where I(q) ∝ 1/q). This effect is illustrated in Fig. 5 for two 4% w/w CS solutions in the absence of NaCl, one at pH = 1 and the other with 0.2M CaCl2. In the latter case, the linear range extends from 0.008 Å−1 to 0.2 Å−1, corresponding to an upper length limit 1/q ≈ 125 Å. This value is comparable to the persistence length of the CS molecule (≈100 Å)50,51 indicating that Ca2+ ions promote chain alignment.
FIG. 5.
SANS responses of 4% w/w chondroitin sulfate solutions in the absence of NaCl, with 0.2M CaCl2 (blue circles) and pH = 1 (red triangles). The region in which I(q) ∝ q−1 (0.008 < q < 0.2 Å−1) is the signature of linear geometry and indicates the shape of the fluctuating correlation volume.
Since many of the macroscopic properties of polyelectrolyte solutions, notably osmotic and electrostatic properties, are satisfactorily interpreted in terms of the ionic strength, we investigate how the ionic strength and salt composition influence the structure of the polymer solution at the length scales probed by SANS. The ionic strength is J = 1/2ΣiZi2ci, where Zi is the valence of the ion species i and ci is its concentration. This concept assumes additivity of the contributions of mono and multivalent ions. If the ionic strength were the sole determining factor that governs the structure of the polymer solution and its scattering response, the SANS spectrum of a polyelectrolyte solution containing x moles of CaCl2 would be identical to that of an equivalent solution containing 3x moles of NaCl.
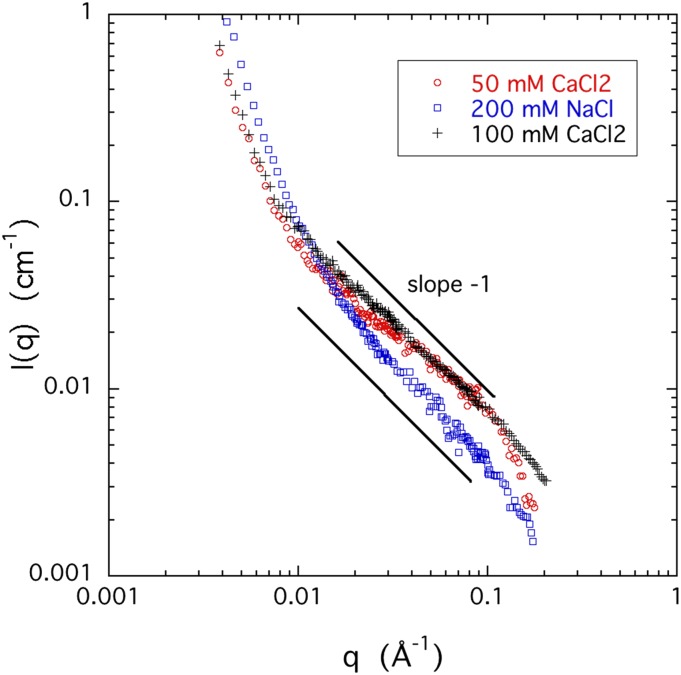
In Fig. 6, the SANS spectra of 4% w/w CS solutions, measured in 0.05M and 0.1M CaCl2 (J = 0.15M and 0.3M, respectively), are compared with that of a corresponding 4% w/w CS solution containing 0.2M NaCl (J = 0.2M). The figure demonstrates that the SANS responses deviate significantly from additivity. In the range q > 0.01 Å−1 dominated by the thermodynamic concentration fluctuations, the intensity scattered by both calcium containing systems exceeds that of the sodium containing counterpart by a factor of approximately two, reflecting that the correlation length is greater in the presence of calcium ions. This finding indicates that the effect of calcium ions cannot be interpreted purely in terms of the ionic strength of the solution. Other factors, such as attractive and repulsive forces between the charged groups on the polymer backbone, interactions among the ions and solvent molecules, charge density of the polyions, ion hydration, etc., may also play an important role.
FIG. 6.
SANS responses of 4% w/w CS solutions containing either NaCl or CaCl2 at different concentrations.
In summary, changes in the ionic environment due either to the pH or to added calcium ions affect primarily the scattering response in the intermediate q range. The scattering intensity in this region increases with decreasing pH and with increasing calcium ion concentration. This intensity increase is accompanied in both cases by an increase in L and can be attributed to a change in the polymer-solvent interaction. In mixed salt conditions (i.e., containing both NaCl and CaCl2) at the same ionic strength, the combined effect of mono- and divalent counter-ions on the structure of the polymer solutions deviates significantly from additivity.
Anomalous small angle x-ray scattering (ASAXS)
The subsection titled “Effects of ionic environment” described ion-induced changes in the organization of the dissolved biopolymer molecules, as seen by small angle scattering. As the small angle scattering intensity is governed primarily by the difference in contrast between the polymer and the solvent, this technique does not detect the contribution of the counter-ions owing to their small effect to the total scattering intensity. As the ion concentration increases, changes occur in (i) the thermodynamic interactions that cause intermolecular reorganization and (ii) the composition and distribution of the counter-ion cloud. To separate these two contributions and determine the counter-ion distribution, ASAXS measurements were made in solutions of DNA and HA containing mono and divalent cations. These polymer systems differ in their phase stability. DNA solutions are sensitive to divalent counter-ions: in solutions containing 0.1M NaCl and 0.25M CaCl2, they precipitate. HA, by contrast, remains stable in solution even up to 1M CaCl2.
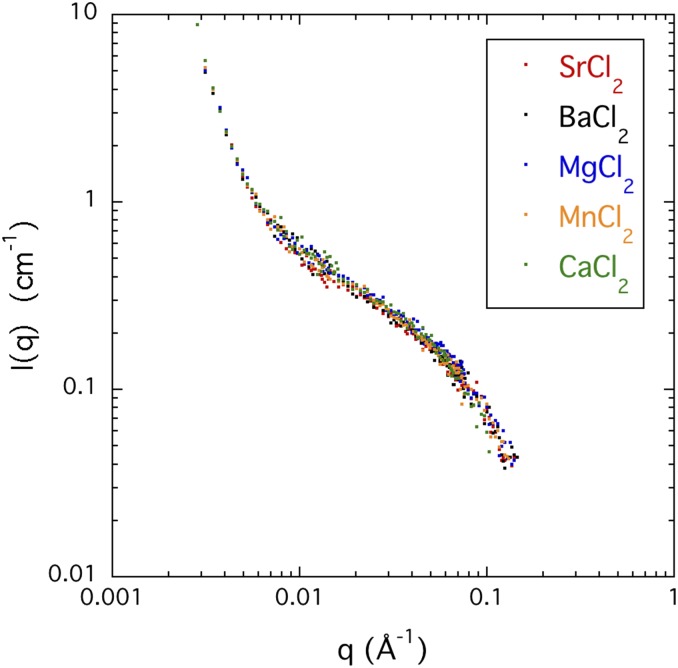
The ASAXS technique modifies the scattering contrast between the counter-ions and the solvent, without affecting that of the polymer. The scattering response from the same sample is recorded at different incident energies close to the absorption edge of the resonant atom being investigated. As noted in the Experimental section, strontium ions were used to substitute for the calcium ions since the atomic absorption edge of this atom lies in a convenient energy range for scattering measurements. This substitution does not affect the structure of the solution, as demonstrated in Fig. 7, which shows that the SANS responses of DNA solutions with five different divalent cations are practically indistinguishable.
FIG. 7.
SANS response of solutions of DNA at 6% w/w, containing 0.1M NaCl with 0.06M of SrCl2, BaCl2, MgCl2, MnCl2, and CaCl2, respectively.
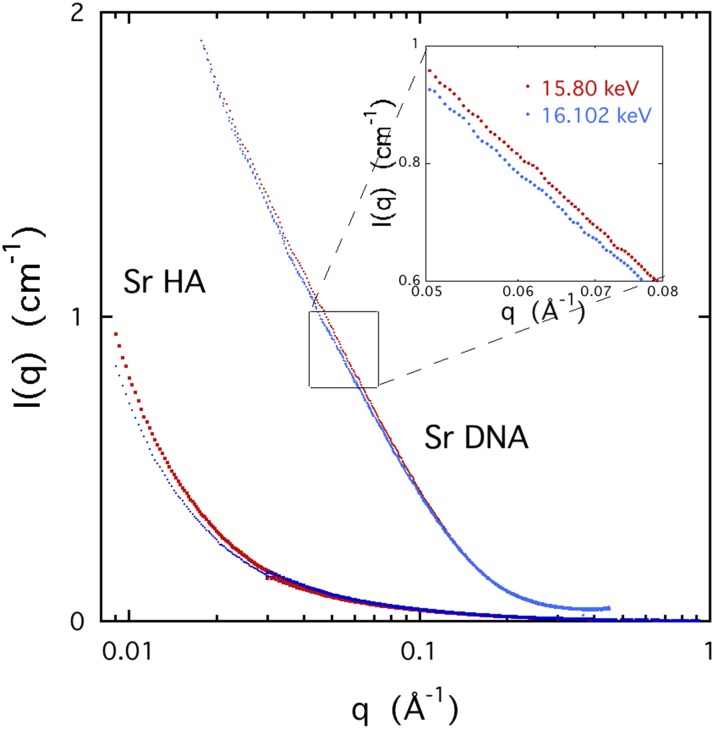
The ASAXS measurements were made on semi-dilute solutions of DNA and HA containing 0.1M NaCl, together with different amounts of SrCl2. Typical SAXS responses are shown in Fig. 8 at different incident X-ray energies close to the threshold of strontium (16.1046 keV). The scattering curves are almost indistinguishable in this figure. The inset shows the SAXS profiles measured at 15.8 keV and 16.102 keV. The difference between the two responses is due to the counter-ion cloud of strontium ions surrounding the polymer.
FIG. 8.
SAXS response of a 3% w/w DNA solution containing 0.1M NaCl and 0.03M SrCl2 and a 4% w/w HA solution containing 0.1M NaCl and 0.05M SrCl2 at two energies. Red symbols: 15.8 keV and blue symbols: 16.102 keV. Inset shows the DNA data at higher resolution from the region 0.05 ≤ q ≤ 0.08 Å−1.
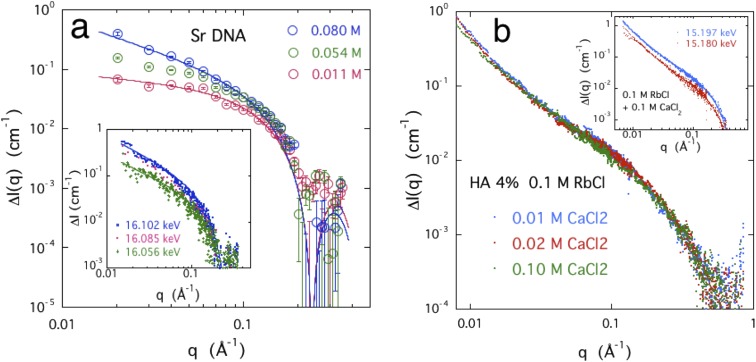
Figure 9 illustrates two important findings. Figure 9(a) shows that at constant incident energy (E2 = 16.102 keV), the difference signal ΔI(q) increases with increasing SrCl2 concentration in the polymer solution and Fig. 9(b) for the rubidium signal, ΔI(q) is insensitive to the calcium content of the solution. The insets in both figures also illustrate how ΔI(q) increases as the energy of the incident radiation approaches the atomic absorption threshold of the resonant ion.
FIG. 9.
(a) Intensity difference ΔI(q) = [I(q)15.8 − I(q)16.102] in a 3% w/w DNA solution with 0.1M NaCl and different amounts of SrCl2; (b) ΔI(q) = [I(q)14.9 − I(q)15.197] in a 4% w/w HA solution containing 0.1M RbCl and different concentrations of CaCl2. Inset: ΔI(q) in a 4% w/w HA solution containing 0.1M RbCl and 0.1M CaCl2, for two near-threshold energies E2 = 15.180 and 15.197 keV, in which the reference energy is E1 = 14.9 keV.
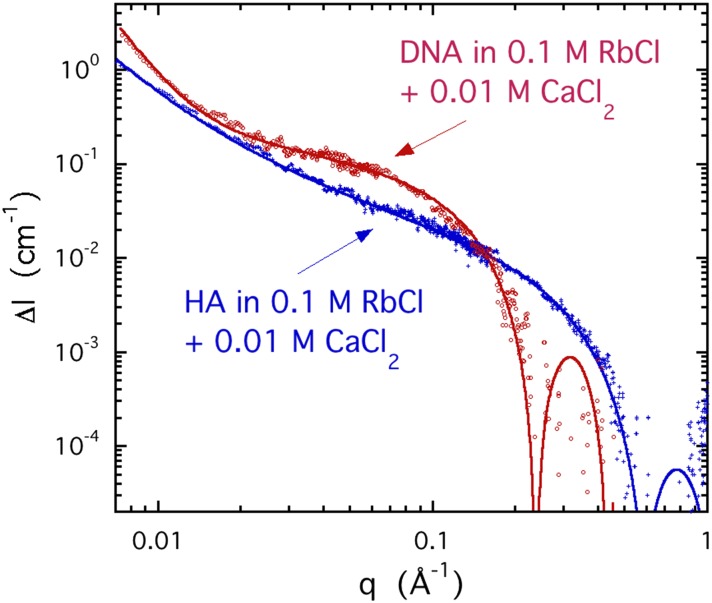
Figure 10 shows typical ASAXS signals ΔI(q) from the rubidium counter-ion cloud around DNA and HA polymer chains in the presence of 0.01M CaCl2. In the low q region, both responses vary approximately as q−1 but diverge faster with decreasing q as scattering from heterogeneities becomes dominant. The continuous lines in the figure are the fits of Eq. (6) to the data, where we make the approximation that the shape of the counter-ion cloud is patterned on that of the polymer chain. The radius R of the counter-ion cloud is expected to be greater than that of the bare polymer. To estimate R for the rubidium cloud, we use the simple model of Eq. (6) according to which the strong downturn in signal intensity from DNA at q ≈ 0.24 Å−1 indicates a cylinder of radius R ≈ 16 Å, while for HA, the first zero at q ≈ 0.52 Å−1 corresponds to R ≈ 7.4 Å.
FIG. 10.
Comparison of the ASAXS difference signal ΔI(q) for rubidium from solutions of DNA and HA containing 0.1M RbCl and 0.01M CaCl2 with reference energy E1 = 14.9 keV and probe energy E2 = 15.197 keV.
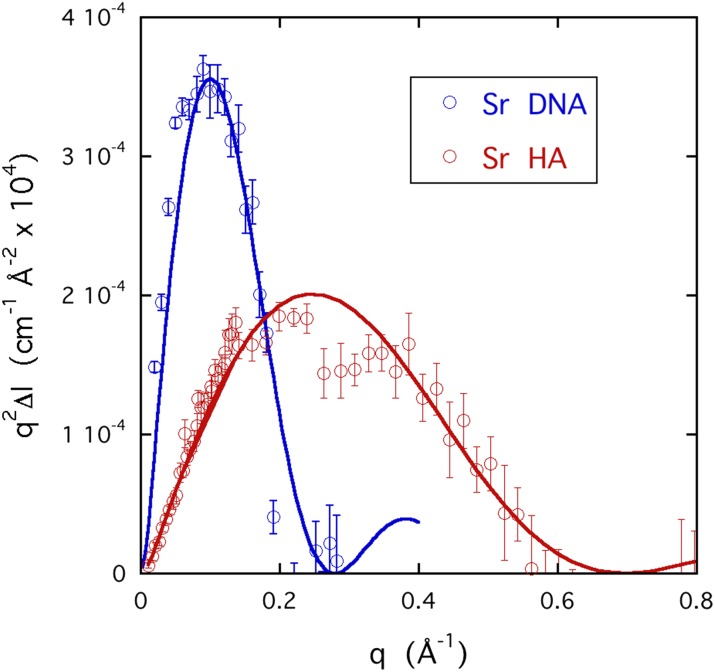
Figure 11 shows the corresponding ASAXS strontium response in the Kratky representation, q2ΔI(q) vs q, to enhance the difference in scattering behavior in the high q region where the scattering intensity is weak. The figure shows the data for DNA with 0.08M SrCl2 and for HA with 0.05M SrCl2. The fits to these curves yield R = 13.7 Å for the radius of the strontium cloud around DNA and R = 5.5 Å with HA. It should be mentioned that the model underlying Eq. (6) is sensitive preferentially to the inner core of the hollow cylindrical cloud, where the boundary is sharp, rather than to its mean radius. This geometrical distinction is especially relevant to the case of the monovalent ion, where the external structure of the cloud is diffuse. Nevertheless, these ASAXS results show that in both DNA and HA, the effective radius of the divalent ions is appreciably smaller than that of the monovalent ions.
FIG. 11.
Kratky plots of the ASAXS signals ΔI(q) of strontium in DNA and in HA, with probe energy E2 = 16.102 keV. The continuous curves are the fits to the expression q2ΔI(q), where ΔI(q) has the same form as Eq. (6). For strontium in DNA, R = 13.7 Å and for strontium in HA, R = 5.5 Å.
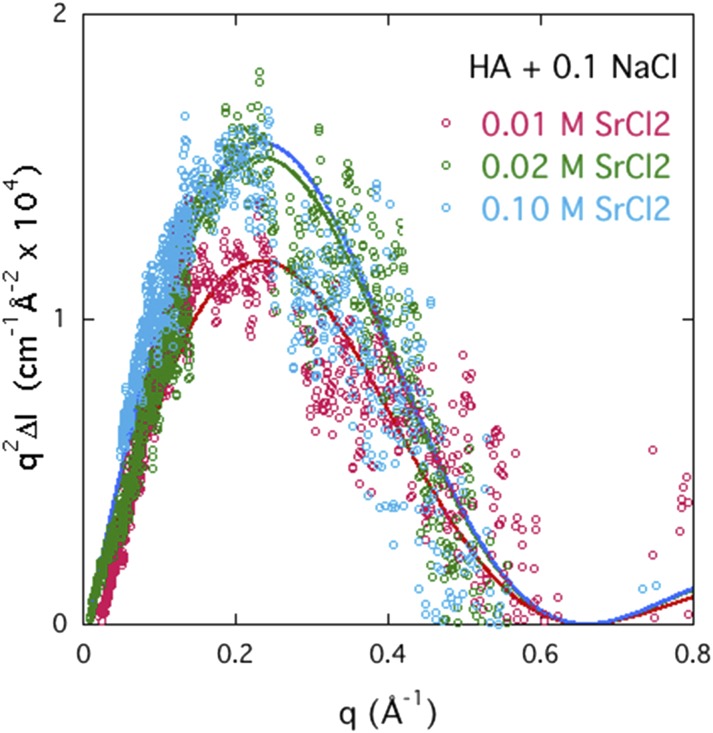
The Kratky representation makes it possible to estimate the relative amount of counter-ions in the immediate neighborhood of the polymer. Figure 12 shows how the intensity of the strontium ASAXS signal in solutions of HA increases with the total SrCl2 concentration in the solution. The figure shows that the saturation value of the intensity is reached practically at 0.02M SrCl2. A similar result is found for SrCl2 in DNA, where the concentration of repeat units is approximately the same as in the HA solutions, i.e., 0.1M. These findings indicate that saturation of the divalent-monovalent ion exchange is achieved when the divalent ion concentration reaches 20% of the stoichiometric value. The width of the curves in Fig. 12 is practically independent of the SrCl2 concentration, indicating that the shape of the ion cloud remains self-similar. In contrast to DNA solutions containing 0.1M NaCl, where precipitation occurs at divalent ion concentrations just beyond this level (∼0.025M SrCl2), HA solutions remain stable even in the presence of 0.2M CaCl2, i.e., well above the saturation threshold.34 The latter finding implies that the thermodynamic stability of these polyelectrolyte solutions is primarily governed by the hydrophilic character of the polymer backbone. When the electrostatic repulsion between the charged groups is screened, relatively hydrophobic polymers such as DNA precipitate, while solutions of hydrophilic polymers such as HA remain stable.
FIG. 12.
Kratky plot of the ASAXS signals ΔI(q) of strontium in HA at three strontium chloride concentrations. Saturation of the signal is almost complete already at 0.02M SrCl2. Probe energy E2 = 16.102 keV.
The ASAXS results demonstrate that both for DNA and HA solutions, the counter-ion cloud can be described by the same functional form as that of the polymer backbone, i.e., Eq. (6). It follows that the counter-ion cloud mimics the polymer conformation over the length scale range explored by ASAXS. Divalent counter-ions, however, stay in closer proximity to the polymer chain than monovalent ions, and consequently the latter are sparser and more loosely attached. The resulting arrangement of divalent ions not only screens the charged groups more effectively but also modifies the composition of the solvent in the immediate surroundings of the polymer chain. Thus, addition of divalent ions diminishes the interaction between polymer and solvent and, in the case of hydrophobic polymers, tends to phase separation.
CONCLUSIONS
Systematic small angle scattering studies were made on semi-dilute solutions of four charged biopolymers (PASP, DNA, CS, and HA), which represent the main types of biological macromolecules. The effects of polymer concentration, pH, and calcium chloride concentration on the polymer structure were investigated in near-physiological salt conditions.
In all cases, the SANS response I(q) could be described by an expression consisting of two terms. In the low q range (<0.01 Å−1), I(q) is dominated by scattering from large clusters. In the intermediate q range, the scattering intensity varies approximately as q−1, which signifies that the scattering structures are linear. The correlation length L of the concentration fluctuations displays a power law dependence on the polymer concentration c, with L ∝ c−0.65 ± 0.05, similar to that observed in neutral polymer solutions. With increasing calcium chloride concentration and with decreasing pH, L increases as the solutions move toward phase separation. The downturn of the scattering signal in the high q region (q ≈ 0.1 Å−1) defines the cross-sectional radius of the polymer.
The concentration dependence of the SANS intensity I(q) reveals important differences in the thermodynamic interactions between the polymers and the solvents. In the case of PASP, I(q) is proportional to c at all observed values of q. This means that the PASP coils act as independent scattering units at all length scales and implies that their degree of interpenetration is low. In DNA, I(q) is proportional to c at q > 0.02 Å−1. At lower values of q, however, concentration dependent cluster formation alters the shape of the SANS curves, making it difficult to make conclusive comparisons between the various responses of I(q)/c for this system. For the two charged polysaccharides, CS and HA, deviation from proportionality [I(q) ∝ c0.7] observed at q > 0.02 Å−1 indicates that, although the linear subunits of the polymer chains are spatially distinct, residual long range electrostatic repulsion exists between them.
ASAXS measurements are complementary to those of SANS. ASAXS probes the configuration of the counter-ions in the ion cloud surrounding the polymer chains, while SANS probes the conformation of the polymer chains and reflects ion induced changes in the thermodynamic interactions. The ASAXS observations on both DNA and HA complement those of SANS by revealing the increase in the divalent ion content in the counter-ion cloud with increasing divalent salt content in the solution. The thermodynamic changes are the consequence of the tight sheath that the divalent ions form around the polymer chain. The observed similarity in the shape of the divalent ion cloud in these two systems implies that the solution stability of these polymers is controlled not by the counter-ions but by the hydrophilic/hydrophobic character of the polymer backbone.
ACKNOWLEDGMENTS
This research was supported by the Intramural Research Program of the NICHD, NIH. We acknowledge the support of the National Institute of Standards and Technology, U.S. Department of Commerce, in providing the neutron research facilities used in this work. This work utilized facilities supported in part by the National Science Foundation under Agreement No. DMR-0944772. We thank the European Synchrotron Radiation Facility for access to the French CRG X-ray beam line BM02 (experiments 02-01-620 and 02-01-675). We gratefully acknowledge the help and consultation of Dr. Jack Douglas and Dr. Boualem Hammouda (NIST).
REFERENCES
- 1.Oosawa F., Polyelectrolytes (Marcel Dekker, New York, 1971). [Google Scholar]
- 2.Eisenberg H., Biological Macromolecules and Polyelectrolytes in Solution (Clarendon, Oxford, 1976). [Google Scholar]
- 3.Fuoss R. M., Katchalsky A., and Lifson S., Proc. Natl. Acad. Sci. U. S. A. 37, 579 (1951). 10.1073/pnas.37.9.579 [DOI] [PMC free article] [PubMed] [Google Scholar]
- 4.Katchalsky A., Lifson S., and Eisenberg H., J. Polym. Sci. 7, 571 (1951). 10.1002/pol.1951.120070513 [DOI] [Google Scholar]
- 5.Gunnarsson G., Jonsson B., and Wennerstrom H., J. Phys. Chem. 84, 3114 (1980). 10.1021/j100460a029 [DOI] [Google Scholar]
- 6.Manning G. S., J. Chem. Phys. 51, 924 (1969). 10.1063/1.1672157 [DOI] [Google Scholar]
- 7.Manning G. S., Q. Rev. Biophys. 11, 179 (1978). 10.1017/s0033583500002031 [DOI] [PubMed] [Google Scholar]
- 8.Le Bret M. and Zimm B. H., Biopolymers 23, 287 (1984). 10.1002/bip.360230209 [DOI] [PubMed] [Google Scholar]
- 9.Belloni L., Drifford M., and Turq P., Chem. Phys. 83(1), 147 (1984). 10.1016/0301-0104(84)85229-5 [DOI] [Google Scholar]
- 10.Marcus R. A., J. Chem. Phys. 23, 1057 (1955). 10.1063/1.1742191 [DOI] [Google Scholar]
- 11.Philip J. R. and Wooding R. A., J. Chem. Phys. 52, 953 (1970). 10.1063/1.1673081 [DOI] [Google Scholar]
- 12.Evans D. F., Mitchell D. J., and Ninham B. W., J. Phys. Chem. 88, 6344 (1984). 10.1021/j150669a057 [DOI] [Google Scholar]
- 13.Bloomfield V. A., Biopolymers 31, 1471 (1991). 10.1002/bip.360311305 [DOI] [PubMed] [Google Scholar]
- 14.Pack G. R., Wong L., and Lamm G., Biopolymers 49, 575 (1999). [DOI] [PubMed] [Google Scholar]
- 15.Andresen K., Qiu X., Pabit S. A., Lamb J. S., Park H. Y., Kwok L. W., and Pollack L., Biophys. J. 95, 287 (2008). 10.1529/biophysj.107.123174 [DOI] [PMC free article] [PubMed] [Google Scholar]
- 16.Liu S., Ghosh K., and Muthukumar M., J. Chem. Phys. 119, 1813 (2003). 10.1063/1.1580109 [DOI] [Google Scholar]
- 17.Holm C., Joanny J. F., Kremer K., Netz R. R., Reineker P., Seidel C., Vilgis T. A., and Winkler R. G., Adv. Polym. Sci. 166, 67 (2004). 10.1007/b11349 [DOI] [Google Scholar]
- 18.Klos J. and Pakula T., J. Phys.: Condens. Matter 17, 5635 (2005). 10.1088/0953-8984/17/37/002 [DOI] [PubMed] [Google Scholar]
- 19.Pi Y., Shang Y., Liu H., and Hu Y., J. Colloid Interface Sci. 306, 405–410 (2007). 10.1016/j.jcis.2006.10.020 [DOI] [PubMed] [Google Scholar]
- 20.Barrat J. L. and Joanny J. F., Adv. Chem. Phys. 94, 1–66 (1996). 10.1002/9780470141533.ch1 [DOI] [Google Scholar]
- 21.Forster S. and Schmidt M., Adv. Polym. Sci. 120, 51 (1995). 10.1007/3-540-58704-7_2 [DOI] [Google Scholar]
- 22.Flory P. J. and Osterheld J. E., J. Phys. Chem. 58, 653 (1954). 10.1021/j150518a014 [DOI] [Google Scholar]
- 23.de Gennes P. G., Scaling Concepts in Polymer Physics (Cornell, Ithaca, 1979). [Google Scholar]
- 24.Ornstein L. S. and Zernicke F., Proc. Royal Netherlands Academy of Arts and Sciences (KNAW) 17, 793 (1914). [Google Scholar]
- 25.Sears V. F., Neutron News 3, 26 (1992). 10.1080/10448639208218770 [DOI] [Google Scholar]
- 26.Kirste R. G. and Oberthür R. C., Small Angle X-ray Scattering, edited by Glatter O. and Kratky O. (Academic Press, London, 1982). [Google Scholar]
- 27.des Cloiseaux J., Macromolecules 6, 403 (1973). 10.1021/ma60033a017 [DOI] [Google Scholar]
- 28.Horkay F., Basser P. J., Hecht A. M., and Geissler E., Macromolecules 45, 2882 (2012). 10.1021/ma202693s [DOI] [PMC free article] [PubMed] [Google Scholar]
- 29.Neugebauer T., Ann. Phys. 434, 509 (1943). 10.1002/andp.19434340702 [DOI] [Google Scholar]
- 30.Horkay F., Burchard W., Geissler E., and Hecht A. M., Macromolecules 26, 1296 (1993). 10.1021/ma00058a017 [DOI] [Google Scholar]
- 31.Benoit H. and Picot C., Pure Appl. Chem. 12, 545 (1966). 10.1351/pac196612010545 [DOI] [Google Scholar]
- 32.Zhang Y., Douglas J. F., Ermi B. D., and Amis E. J., J. Chem. Phys. 114, 3299 (2001). 10.1063/1.1336148 [DOI] [Google Scholar]
- 33.Borsali R., Nguyen H., and Pecora R., Macromolecules 31, 1548 (1998). 10.1021/ma970919b [DOI] [Google Scholar]
- 34.Horkay F., Basser P. J., Londono D. J., Hecht A. M., and Geissler E., J. Chem. Phys. 131, 184902 (2009). 10.1063/1.3262308 [DOI] [PMC free article] [PubMed] [Google Scholar]
- 35.Morfin I., Horkay F., Basser P. J., Bley F., Hecht A.-M., Rochas C., and Geissler E., Biophys. J. 87, 2897 (2004). 10.1529/biophysj.104.045542 [DOI] [PMC free article] [PubMed] [Google Scholar]
- 36.Williams C. E., Neutron, X-Ray and Light Scattering, edited by Lindner P. and Zemb T. (Elsevier, New York, 1991). [Google Scholar]
- 37.Sabbagh I., Delsanti M., and Lesieur P., Eur. Phys. J. B 12, 253 (1999). 10.1007/s100510051002 [DOI] [Google Scholar]
- 38.Guilleaume B., Blaul J., Ballauff M., Wittemann M., Rehahn M., and Goerigk G., Eur. Phys. J. E 8, 299 (2002). 10.1140/epje/i2001-10105-8 [DOI] [PubMed] [Google Scholar]
- 39.Das R., Mills T. T., Kwok L. W., Maskel G. S., Millet I. S., Doniach S., Finkelstein K. D., Herschlag D., and Pollack L., Phys. Rev. Lett. 90, 188103 (2003). 10.1103/physrevlett.90.188103 [DOI] [PubMed] [Google Scholar]
- 40.Dingenouts N., Merkle R., Guo X., Narayanan T., Goerigk G., and Ballauff M., J. Appl. Crystallogr. 36, 578 (2003). 10.1107/s0021889803000256 [DOI] [Google Scholar]
- 41.Jusufi A. and Ballauff M., Macromol. Theory Simul. 15, 193 (2006). 10.1002/mats.200500084 [DOI] [Google Scholar]
- 42.Horkay F., Hecht A. M., Rochas C., Basser P. J., and Geissler E., J. Chem. Phys. 125, 234904 (2006). 10.1063/1.2402921 [DOI] [PubMed] [Google Scholar]
- 43.Zakharova S. S., Egelhaaf S. U., Bhuiyan L. B., Outhwaite C. W., Bratko D., and van der Maarel J. R. C., J. Chem. Phys. 111, 10706 (1999). 10.1063/1.480425 [DOI] [Google Scholar]
- 44.van der Maarel J. R. C., Groot L. C. A., Mandel M., Jesse W., Jannink G., and Rodriguez V., J. Phys. II 2, 109 (1992). 10.1051/jp2:1992117 [DOI] [Google Scholar]
- 45.NIST Cold Neutron Research Facility, NG3 and NG7. 30-m. SANS Instruments Data Acquisition Manual (NIST, 1999). [Google Scholar]
- 46.Muthukumar M., Macromolecules 50, 9528 (2017). 10.1021/acs.macromol.7b01929 [DOI] [PMC free article] [PubMed] [Google Scholar]
- 47.Brown W. and Johnsen R. M., Macromolecules 18, 379 (1985). 10.1021/ma00145a014 [DOI] [Google Scholar]
- 48.Brown W. and Mortensen K., Macromolecules 21, 420 (1988). 10.1021/ma00180a023 [DOI] [Google Scholar]
- 49.Prabhu V. M., Muthukumar M., Wignall G. D., and Melnichenko Y. B., J. Chem. Phys. 119, 4085 (2003). 10.1063/1.1592496 [DOI] [Google Scholar]
- 50.Buhler E. and Boué F., Macromolecules 37, 1600 (2004). 10.1021/ma0215520 [DOI] [Google Scholar]
- 51.Bathe M., Rutledge G. C., Grodzinsky A. J., and Tidor B., Biophys. J. 89, 2357 (2005). 10.1529/biophysj.105.067918 [DOI] [PMC free article] [PubMed] [Google Scholar]


