

Abstract
Objective
The aim of this study was to describe health services utilisation and responsiveness in East Azerbaijan province, Iran.
Design
A cross-sectional household study as part of a larger research on primary healthcare system.
Setting
We carried out the study in East Azerbaijan Province, northwest Iran from July to September 2015.
Participants
A total of 1318 households were included.
Results
Most of the participating households had social security health insurance. Heart failure or hypertension care, general outpatient care and arthritis care were the most used services. High services cost and inadequate medicine and medical equipment were introduced to be the main barriers to health services utilisation in Tabriz and province representative sample (PRS), respectively. Health system responsiveness mean score (the maximum is 100) was 33.71±16.15 (95% CI 32.45 to 34.97) in Tabriz and 32.02±14.3 (95% CI 30.9 to 33.13) in PRS, which showed significant difference (p≤0.02).
Conclusions
Differences in the utilisation and responsiveness of health services and distribution of health resources were observed between Tabriz and PRS. Evidently, health system responsiveness in both Tabriz and PRS was at low level. The results demonstrate the need for changing resource distribution policies and employing reactive health policies to response the public health.
Keywords: health services, health-related quality of life, health-care utilization, responsiveness, low- and middle-income countries
Introduction
Health services utilisation is one of the most important performance indicators of health systems. It was reported that due to a set of cultural and socioeconomic factors, nearly one-third of the world population could not meet their need for health services.1 2 Previous studies have shown that perceived health status,3–5 access to health facilities, insurance coverage, socioeconomic status, education and residing region were variables probably affecting health services utilisation.6–11 Moreover, some literatures revealed that residents of cities with low socioeconomic status have disadvantages in health services utilisation when compared with the households residing in other regions.12–14
Utilisation of highest attainable level of health by each Iranian people was announced by the 29th articles of the constitution states.15 Public health services in Iran were delivered through health network in primary, secondary and tertiary levels. In addition, private sector and non-governmental organisations are active in this regard.16 Based on international and national reports, Iranian health system had achieved remarkable successes in public health promotion.17 18
However, studies had declared that there was diversity in achievements across this country.19 20 In a national study called ‘Health Services Utilization in Iran’ in 2003, results showed that still 6.4% of the households had not met their services need.11 Underutilisation of primary healthcare in Iran, as a matter of low quality and responsiveness of services, must be an important concern of policy-makers.21
Responsiveness is mostly related to the health system ability to meet patients’ non-medical needs.22 Respondents' demographic and socioeconomic features and their residential place were also introduced to be the affecting factors of health services responsiveness level.23–25 Desired level of responsiveness on behalf of health system contributes to more adherence by patients to the healthcare providers’ recommendations and improved outcomes.26
The health system responsiveness score was reported among 38%–84% in previous studies in Iran.23 27 28 According to WHO, health system responsiveness survey, prompt attention and dignity were respectively the most important domains of responsiveness in Iran.28 This was consistent with the study result of Karami-Tanha et al.23 On the other hand, the quality of basic amenities was the most important domain of responsiveness in the study of Rashidian et al.24
Previous literature have suggested that in order to meet the changing burden of disease and health issues, Iranian primary healthcare (PHC) system needs to have a reform.29 According to WHO, every health system has three basic functions including responsiveness, improving health outcome and fair financial contribution which must be fulfilled.22 Therefore, it is necessary to investigate the utilisation and responsiveness of primary healthcare system in different regions of Iran. Previous studies in Iran mostly were focused on health services utilisation and responsiveness between provinces in Iran,11 23 30 31 and studies on this topic in one province considering the differences between cities were very limited. Besides, there is also limited knowledge on the differences between various urban regions, regarding the health services utilisation and responsiveness.18
The aim of this study was to map out health services utilisation and responsiveness between the cities of East Azerbaijan Province, Iran, to provide information and evidences about local public health organisations and services to policy-makers. This result will be a cornerstone of the reform of primary healthcare system in this region.
Material and methods
Study design
A cross-sectional household survey was conducted in 2015 (July to September). This study is part of a larger research designed to assess the PHC reform effectiveness in the Province. More details about the methodology could be found in the published protocol.32
Study setting
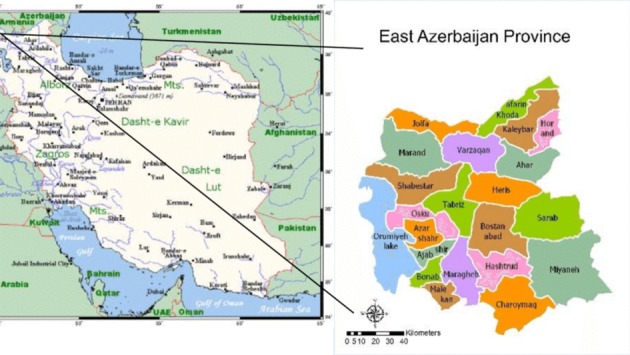
East Azerbaijan Province with a total population of 3 909 652 people (based on 2016 census) is located in northwest of Iran. Tabriz, as a metropolitan city, is the most developed and populated (1 773 033 people) city in the province. City of Oskou with a population of 158 270 people, Marand with 244 971 people, Varzeghan with 52 650 people, Bonab with 134 892 people and Mianeh with 182 848 people were the cities included in the study. All are experiencing a growing trend of urbanisation and industrialisation (figure 1).
Figure 1.

East Azerbaijan map. PRS, province representative sample.
Sampling
Two-stage cluster sampling method through probability proportional to size (PPS) was used for sampling. First, the Province was divided into five geographical parts (central, northwest, southwest, northeast, southeast), and out of each part, one county was selected randomly. Accordingly, the metropolitan city Tabriz (as province capital), Oskou in central part, Marand in northwest, Varzeghan in northeast, Bonab in southwest and Mianeh in southeast were selected (province representative sample, PRS).
For Tabriz, 120 clusters of 20 households were allocated. In Tabriz, clusters were selected on the basis of the framework of the Demographic Health Survey study (national survey in 2011). In other cities, clusters were selected on the basis of the census records of urban and rural populations using PPS cluster sampling.
Questionnaires
The main questionnaire was adapted from that of Gharaie et al in 2013 and have been modified based on experts’ advice.27 Finally, a three-section questionnaire was developed to assess health services utilisation and responsiveness (online supplementary appendix 1). The first section was for the items about household characteristics such as family dimension, having a child under 5 years, the type of insurance, hospitalisation rate and four main health issues (hypertension, diabetes, depression and injuries) prevalence. The second section was composed of 16 questions on utilisation of health services in the participants’ last visit to the health facilities or providers. The items included last visit time, reason for visit, barriers to services utilisation, last visit place, satisfaction of last visit, cost of services and drugs, quality and outcome of last utilised health services and utilisation of home care. Section 3 included eight questions on health system responsiveness based on WHO responsiveness questionnaire,33 as services promptness, dignity, communication, patient participation, information confidentiality, choice of provider, amenities quality and access. The responses were categorised on a 5-point Likert scale as 1 meaning completely disagree and 5 as completely agree. The questionnaire’s content validity was assessed using experts’ ideas. Experts included professionals who were content expert or had research or work experience in the topic.34 Experts assessed each item qualitatively in case of using correct and appropriate words, grammar, diction and word order. Quantitative content validity assessment was done through a table in which experts rated the items using 4-point evaluation scales in case of each item’s necessity, relevance and clarity (table 1).
Table 1.
Content validity assessment form
| Item | Necessity | Relevance | Clarity |
| 1 (not useful) | 1 (not relevant) | 1 (not clear) | |
| 2 (not necessary) | 2 (item needs some revision) | 2 (item needs some revision) | |
| 3 (useful but not essential) | 3 (relevant but needs minor revision) | 3 (clear but needs minor revision) | |
| 4 (necessary) | 4 (completely relevant) | 4 (very clear) |
fmch-2018-000007supp001.pdf (91KB, pdf)
Kappa coefficient was calculated using the formula reported by Sim and Wright in 2005.35
Where:
Po is the proportion of observed agreements and Pc is the proportion of agreements expected by chance. Kappa coefficient for the whole questionnaire was calculated to be 1. Moreover, the reliability of the questionnaire was approved by conducting a test–retest pilot study (n=30 households) with a 2-week interval (intraclass correlation coefficient (95% CI)=0.76 (0.49 to 0.88)).
Data collection
Based on the main data collection plan, presented in the protocol,32 600 households were asked to fill in the responsiveness and utilisation questionnaire (remaining households answered to other surveys in the main study). However, 1318 households finally participated in this study. The head of the households or housewives were interviewed by a trained questioner. If he/she was not able to respond, an educated member of the household who is at least 15 years old was asked to respond. Each household was conducted for data three times. Households with residences of less than 6 months in each area were excluded.
Statistical analysis
Data were analysed using descriptive statistics including frequency, mean and SD and for inferential statistics based on data normality. We also used χ2 and Mann-Whitney U tests to calculate the difference of percentage and mean between different groups. A p value of 0.05 or less for a two-tailed test was considered significant. Data analysis was performed using the Stata V.14.0 program (StataCorp, College Station, Texas, USA).
Results
In total, 1318 households participated in the study (50.3% in Tabriz). Household size mode was 4 (32.5% of households) in Tabriz when compared with 3 (33.9% of households) in PRS. The annual ever-hospitalisation rate of a family member, for the year former to the study time, was 162 per 1000 households in Tabriz versus 244 in PRS. Results showed that most of the households were under the coverage of social security insurance (68.1% in Tabriz and 45.2% in PRS). Moreover, about 36.2% of households had rural health insurance in PRS. Frequency distribution of four main health issues in households are presented in figure 2.
Figure 2.
Frequency distribution of four main health issues in households (%).
Findings showed that 53.46% and 46.11% of households’ members in Tabriz and PRS had used health services in their last 30 days former to the study time. Heart failure or hypertension care (13.05%), general outpatient care (11.1%) and arthritis care (9.93%) were the most used services. The health services used by households in last visit to health facilities are given in table 2.
Table 2.
Percentage of household who had used health services in last visit to health facilities
| Health services | Tabriz (% of households) | PRS (% of households) | Total (% of households) |
| Dentistry | 7.92 | 5.07 | 6.53 |
| Vaccination | 5.69 | 6.3 | 5.99 |
| Prenatal care | 1.11 | 6.49 | 3.75 |
| Child care | 1.7 | 8.34 | 4.96 |
| Workplace health control | 0.93 | 0.27 | 0.18 |
| Injuries | 0.89 | 2.41 | 1.63 |
| Mental health | 5.41 | 4.71 | 5.07 |
| Arthritis | 8.82 | 11.03 | 9.93 |
| Asthma | 0.82 | 1.88 | 1.34 |
| Diabetes | 2.86 | 3.36 | 3.1 |
| Thyroid disease | 0.92 | 0.97 | 0.94 |
| Women diseases | 11.71 | 4.23 | 8.04 |
| Stroke | 0.79 | 0.1 | 0.45 |
| Heart failure or hypertension | 13.39 | 12.71 | 13.05 |
| Febrile and infectious diseases | 2 | 7.68 | 4.79 |
| Cancer care | 0.76 | 0.05 | 0.41 |
| Outpatient surgery | 0.15 | 0.35 | 0.25 |
| Hospitalisation | 1.8 | 2 | 1.9 |
| Laboratory services | 5.92 | 4.12 | 5.04 |
| Rehabilitation services | 0.12 | 0.14 | 0.13 |
| Emergency services | 0.34 | 1.57 | 0.94 |
| Imaging services | 2.89 | 1.32 | 2.12 |
| General outpatient care | 8.3 | 14 | 11.1 |
| Kidney disease | 2.42 | 1.03 | 1.74 |
| Allergy care | 0.89 | 0.52 | 0.71 |
| Internal medicine | 1.81 | 0.26 | 1.05 |
| Digestive medicine | 2.67 | 1.57 | 2.13 |
| Dermatology services | 1.7 | 0.57 | 1.19 |
| Ophthalmology services | 3.01 | 0.81 | 1.93 |
| Otorhinolaryngology—ENT | 0.82 | 0.16 | 0.5 |
PRS, province representative sample.
About 4.56% of the households declared that they were unable to receive their required health services (5.42% in Tabriz and 3.66% in PRS, p≤0.001). In Tabriz, high costs of services (54.1%) and geographical inaccessibility (21.3%) were highlighted to be the most important reasons for not being able to access their needed health services (table 3). In PRS, shortage in medicines and medical equipment (8.2% in Tabriz and 34.6% in PRS, p=0.004) and insufficient information about service delivery facilities (3.3% in Tabriz and 23.1% in PRS, p=0.008) also were critical barriers.
Table 3.
Barriers to health services utilisation in Tabriz and PRS households
| Health services utilisation barriers | Tabriz (% of households)* | PRS (% of households) | P value |
| High cost of services | 54.1 | 46.2 | ≤0.001* |
| Geographical inaccessibility | 21.3 | 30.8 | 0.41* |
| Shortage in medicines and medical equipment | 8.2 | 34.6 | 0.004* |
| Unsure about health providers skills | 6.6 | 26.9 | 0.14* |
| Having a previous bad treatment experience | 13.1 | 19.2 | 0.33* |
| Insufficient information about service delivery facilities | 3.3 | 23.1 | 0.008* |
| Problem resolved | 6.6 | 11.5 | 0.347* |
*Households could select two main reasons.
PRS, province representative sample.
The majority of the households in their last referral selected private clinics to receive the health services (48.9% in Tabriz and 35.8% in PRS). Homecare was mostly used by Tabriz households (14%). Participants (61% in Tabriz and 66% in PRS) identified high cost of home care as the main barrier to its utilisation. In the last referral to health providers, drugs were prescribed for the majority of participants (79%) among which 0.07% did not get all of them. In this regard, the inability to compensate for drugs cost and prescribed drugs in home stock were the main reasons in both Tabriz and PRS.
Most of the participants (60% in Tabriz and 56% in PRS) stated that in their last health services utilisation, they have experienced partial improvement in their health status. However, about 16% in Tabriz and 12.5% in PRS, did not sense any improvement in their health status after getting health services. In case of participants’ satisfaction about health services, most of them in Tabriz (55%) and PRS (56%) were fairly satisfied with health services. However, only 0.07% of the Tabriz households were completely satisfied when compared with the 24% of households in PRS (p≤0.001).
Moreover, scoring the quality of health services was significantly different between Tabriz and PRS households (p≤0.001). About 35% of the households in Tabriz had rated the health services quality as weak when compared with the 20% in PRS (table 4).
Table 4.
Health services quality ranking by Tabriz and PRS households
| Quality rate | Tabriz (% of households) | PRS (% of households) | P value |
| Excellent | 5.9 | 13.4 | ≤0.001* |
| Good | 54.3 | 64.6 | |
| Weak | 35.6 | 19.8 | |
| Bad | 4.3 | 2.2 |
*Based on χ2 test.
PRS, province representative sample.
The mean±SD of health system responsiveness score was 33.71±16.15 (95% CI 32.45 to 34.97) and 32.02±14.3 (95% CI 30.9 to 33.13) in Tabriz and Province representative samples, respectively. There observed a significant difference between Tabriz and PRS households in terms of health system responsiveness (p≤0.02). Table 5 shows health system responsiveness according to the studied cities.
Table 5.
Health system responsiveness score in studied cities
| City | Responsiveness score | |
| Mean | 95% CI | |
| Tabriz | 33.71 | 32.45 to 34.97 |
| Oskou | 31.05 | 29.40 to 32.70 |
| Marand | 40.88 | 38.65 to 43.11 |
| Bonab | 31.65 | 29.18 to 34.13 |
| Mianeh | 26.26 | 23.30 to 29.22 |
| Varzegan | 28.24 | 23.79 to 32.69 |
| PRS | 32.02 | 30.9 to 33.13 |
PRS, province representative sample.
Discussion
Findings of the study showed the health service utilisation and responsiveness in East Azerbaijan Province in 2015. A significant difference between Tabriz, as capital city, and PRS households regarding health system responsiveness was observed. Results also revealed that the annual hospitalisation rate was higher in Tabriz population. The results illustrated that most of the households were covered by Social Security Insurance (68.1% in Tabriz, 45.2% in PRS). However, despite high insurance coverage in these areas, only 7% and 24% of customers were satisfied with the services in Tabriz and PRS, respectively. It should be noted that, despite its enhanced levels, insurance coverage still suffers from financial and administrative discriminations and the accessibility to the healthcare system is still the matter of problem.36 As Ibrahimipour et al suggested, insufficient governmental partnership may be the key reason behind the failure of creating appropriate coverage of health insurance.37
Obtained results indicated that expensive health services and geographical inaccessibility were the barriers to the complete utilisation of health services in Tabriz. While medicine and medical equipment in health facilities was insufficient, high cost and geographical inaccessibility were the main reasons in PRS. Difference between province capital city, Tabriz, and other cities in distribution resource is the probable reason. Several studies reported that human resource distribution was inequitable in public health sector in Iran.31 38 A result of a study in Isfahan province revealed that health access indicators were distributed unequally between the province cities.39 Comparative study of East Azerbaijan census data (2016) showed that 74.6% of the hospital beds were in Tabriz versus 8.27% in PRS. This highlights the importance of redesigning health resource distribution policy in the province. The study of Hosseinpoor et al indicated that there was a linkage between residing in outlying rural districts and the usage level of health services.40 It also provides theoretical evidence for this deduction.
Increased expenses and problems in service delivery system that degrade quality in addition to grooving trend towards highly qualitative health services forced the government to implement evidence-based clinical instructions.41 Actually, some plans by Iranian health system including Family Physician and Health Sector Evolution Plan (HSEP) have partially eliminated the barriers to adequate accessibility of health services. Initiated in 2005, the Family Physician plan promoted the level of access to health services by diminishing the existing discriminations of health service utilisation in rural and poverty-stricken areas. The plan forced the Iranian Health Insurance Organization to create a level of insurance for living residents in rural and poor areas (>20 000 people).42 43 Based on the plan, general physicians were the first referrers to get health services.44 Among the plans, HSEP gained more success in lowering down health cost because the costs of inpatient services utilisation at the hospitals compromised the greatest bulk of health payments in Iran.45
As our study suggested, the trends towards using private clinics to get health services were 48.9% and 35.8% for Tabriz and PRS, respectively. Existing literature in this regard have been associated with the level of utilisation with households’ level of income. In this regard, several investigations have supported the strong association between utilisation of health services and the level of financial income suggesting that private health sector delivers health services to people who are wealthier.46 Also, a previous study revealed that people had more trust in private clinics.47
As findings proposed, in the last referral, physicians have prescribed drugs for almost 80% of cases among which 7% gave up buying the drugs due to high costs or existing stock drugs at home. As previously mentioned, high costs of health services is one of the main barriers to adequate utilisation of health services. In conclusion, high price of drugs in both studied locations is a notable issue. It can be said that when prescribing drugs, several factors are vital among which the most important factors are physicians’ level of knowledge and pricing.48 49 These problems significantly limit providing a kind of qualitative, beneficial and equal health services in Iran.
As most professionals and experts of the field believe, health insurance system must undergo a wide range of imminent reformations.50 Study results showed that health services responsiveness was in low level in both Tabriz and PRS. Relatively poor quality of services leads to a low level of responsiveness.24 According to a draft by WHO in 2000, Iranian health system ranked 100th in terms of responsiveness worldwide. Previous literature have declared that in response to the changing burden of disease and health needs, Iran health system should deepen its reform to improve the quality and accessibility of primary care service.22 29
Conclusions
Differences in health services utilisation were observed between Tabriz and PRS. Moreover, improper resource distribution between capital and other cities was founded. It was evidenced that health system responsiveness in both Tabriz and PRS was at low level. The results demonstrated the need for changing resource distribution policies and employing reactive health policies to response the population need in a systematic way.
Limitations
All the information was self-reported by households, which are prone to recall errors. It is expected that the errors would be random and would not affect the validity of results. Investigating health services utilisation 3 months before this study was another limitation.
Acknowledgments
The authors thank the questioners and households for their contribution.
Footnotes
Contributors: All the authors have contributed in manuscript design, data collection, analysis, interpretation, drafting and finalising.
Funding: This research was done under the support of health vice-chancellor of TUOMS and was funded by Tabriz Health Services Management Research Center, Tabriz University of Medical Science, Tabriz, Iran.
Competing interests: None declared.
Patient consent: Not required.
Ethics approval: The study was approved by the Ethical Committee of Tabriz University of Medical Sciences (TUOMS) (TBZMED.REC.1394.35).
Provenance and peer review: Not commissioned; externally peer reviewed.
References
- 1. Young J, Young J. Health in the developing world: health status and healthcare utilization in Matlab. Bangladesh: University of Colorado, 2004. [Google Scholar]
- 2. Shah A. Global health overview; social, political, economic and environmental issues that affects us all, 2011. Available: http://www.globalissues.org/article/588/global-health-overview [Accessed 06 Dec 2018].
- 3. Morris S, Sutton M, Gravelle H. Inequity and inequality in the use of health care in England: an empirical investigation. Soc Sci Med 2005;60:1251–66. 10.1016/j.socscimed.2004.07.016 [DOI] [PubMed] [Google Scholar]
- 4. Parslow R, Jorm A, Christensen H, et al. Gender differences in factors affecting use of health services: an analysis of a community study of middle-aged and older Australians. Soc Sci Med 2004;59:2121–9. 10.1016/j.socscimed.2004.03.018 [DOI] [PubMed] [Google Scholar]
- 5. Pappa E, Niakas D. Assessment of health care needs and utilization in a mixed public–private system: the case of the Athens area. BMC Health Serv Res 2006;6:146 10.1186/1472-6963-6-146 [DOI] [PMC free article] [PubMed] [Google Scholar]
- 6. Redondo-Sendino Áurea, Guallar-Castillón P, Banegas JR. Gender differences in the utilization of health-care services among the older adult population of Spain. BMC Public Health 2006;6 10.1186/1471-2458-6-155 [DOI] [PMC free article] [PubMed] [Google Scholar]
- 7. Van der Heyden JH, Demarest S, Tafforeau J, et al. Socio-economic differences in the utilisation of health services in Belgium. Health Policy 2003;65:153–65. 10.1016/S0168-8510(02)00213-0 [DOI] [PubMed] [Google Scholar]
- 8. Goins RT, Williams KA, Carter MW, et al. Perceived barriers to health care access among rural older adults: a qualitative study. J Rural Health 2005;21:206–13. 10.1111/j.1748-0361.2005.tb00084.x [DOI] [PubMed] [Google Scholar]
- 9. Oliva-Moreno J, Zozaya N, López-Valcárcel BG. Opposite poles: a comparison between two Spanish regions in health-related quality of life, with implications for health policy. BMC Public Health 2010;10 10.1186/1471-2458-10-576 [DOI] [PMC free article] [PubMed] [Google Scholar]
- 10. Lahana E, Pappa E, Niakas D. Do place of residence and ethnicity affect health services utilization? Evidence from Greece. Int J Equity Health 2011;10:16 10.1186/1475-9276-10-16 [DOI] [PMC free article] [PubMed] [Google Scholar]
- 11. Nagavi M, Jamshidi H. Utilization of health services in Iran. Tehran, Iran: Ministery of Health and Medical Education, 2003. [Google Scholar]
- 12. Islam M, Montgomery M, Taneja S. Urban health and care-seeking behavior: a case study of slums in India and The Philippines. Bethesda: The Partners for Health Reformplus Project, ABT Associates Inc, 2006. [Google Scholar]
- 13. Kumar A, Mohanty SK. Intra-urban differentials in the utilization of reproductive healthcare in India, 1992–2006. J Urban Health 2011;88:311–28. 10.1007/s11524-010-9532-7 [DOI] [PMC free article] [PubMed] [Google Scholar]
- 14. Tabrizi JS, Farahbakhsh M, Bazargani HS. Health services utilization and responsiveness: a comparison of slum and Non-slum regions in Tabriz, Iran. Medical Science 2018;22:577–82. [Google Scholar]
- 15. Mehrdad R. Health system in Iran. JMAJ 2009;52:69–73. [Google Scholar]
- 16. Khangah HA, Jannati A, Imani A. Comparing the health care system of Iran with various countries. Health Scope 2017;6. [Google Scholar]
- 17. Asadi-Lari M, Sayyari AA, Akbari ME, et al. Public health improvement in Iran—lessons from the last 20 years. Public Health 2004;118:395–402. 10.1016/j.puhe.2004.05.011 [DOI] [PubMed] [Google Scholar]
- 18. Heidari GR, Heidari R. Iran Millennium development goal's in a glance. Iran J Public Health 2009;38(Suppl 1):63–4. [Google Scholar]
- 19. Khosravi A, Taylor R, Naghavi M, et al. Differential mortality in Iran. Popul Health Metr 2007;5:7 10.1186/1478-7954-5-7 [DOI] [PMC free article] [PubMed] [Google Scholar]
- 20. Cheraghali AM, Nikfar S, Behmanesh Y, et al. Evaluation of availability, accessibility and prescribing pattern of medicines in the Islamic Republic of Iran. East Mediterr Health J 2004;10:406–15. [PubMed] [Google Scholar]
- 21. Rouhani S, Charati JY, Mohammadpour RA. Structural quality & utilizing outpatient curative care under family medicine scheme in rural areas of Mazandaran—Iran. Iran J Health Sci 2013;1:28–34. [Google Scholar]
- 22. WHO The World Health Report 2000: health systems: improving performance. Geneva: World health organization, 2000. [Google Scholar]
- 23. Karami-Tanha F, Moradi-Lakeh M, Fallah-Abadi H, et al. Health system responsiveness for care of patients with heart failure: evidence from a university hospital. Arch Iran Med 2014;17:736–40. doi:0141711/AIM.003 [PubMed] [Google Scholar]
- 24. Rashidian A, Kavosi Z, Majdzadeh R, et al. Assessing health system responsiveness: a household Survey in 17th district of Tehran. Iran Red Crescent Med J 2011;13:302–8. [PMC free article] [PubMed] [Google Scholar]
- 25. Letkovicova H, Prasad A, Vallée RL. The health system responsiveness analytical guidlines for survey in the multi-country survey study. Geneva: World Health Organization, 2005. [Google Scholar]
- 26. Rice N, Robone S, Smith PC. Vignettes and health systems responsiveness in cross-country comparative analyses. J R Stat Soc Ser A Stat Soc 2012;175:337–69. 10.1111/j.1467-985X.2011.01021.x [DOI] [Google Scholar]
- 27. Gharaie H, Bahrami MA, Hamidi Y. The relationship between organizational climate and accountability in the public, private and charitable hospitals in Hamedan and Yazd cities—2012. J Health Manage 2013;3:35–47. [Google Scholar]
- 28. Valentine N, Darby C, Bonsel GJ. Which aspects of non-clinical quality of care are most important? Results from WHO's general population surveys of "health systems responsiveness" in 41 countries. Soc Sci Med 2008;66:1939–50. 10.1016/j.socscimed.2007.12.002 [DOI] [PubMed] [Google Scholar]
- 29. Nekoei Moghadam M, Amiresmaili M, Sadeghi V, et al. A qualitative study on human resources for primary health care in Iran. Int J Health Plann Manage 2018;33:e38–48. 10.1002/hpm.2405 [DOI] [PubMed] [Google Scholar]
- 30. Hassanzadeh J, Mohammadbeigi A, Eshrati B, et al. Determinants of inequity in health care services utilization in markazi Province of Iran. Iran Red Crescent Med J 2013;15:363–70. 10.5812/ircmj.3525 [DOI] [PMC free article] [PubMed] [Google Scholar]
- 31. Rezaei S, KaramiMatin B, Akbari Sari A. Inequality in the geographic distribution of health workforce in the governmental sector in Iran. Hakim Health Sys Res 2015;18:194–200. [Google Scholar]
- 32. Tabrizi JS, Farahbakhsh M, Sadeghi-Bazargani H. Effectiveness of the health complex model in Iranian primary health care reform: the study protocol. Patient Prefer Adherence 2063;2016:10. [DOI] [PMC free article] [PubMed] [Google Scholar]
- 33. World Health Organization Key informant survey [Internet], 2000. Available: http://www.who.int/responsiveness/surveys/KIS_2001_questionnaire.pdf?ua=1
- 34. Davis LL. Instrument review: getting the most from a panel of experts. Applied Nursing Research 1992;5:194–7. 10.1016/S0897-1897(05)80008-4 [DOI] [Google Scholar]
- 35. Sim J, Wright CC. The kappa statistic in reliability studies: use, interpretation, and sample size requirements. Phys Ther 2005;85:257–68. [PubMed] [Google Scholar]
- 36. Zare H, Trujillo AJ, Driessen J, et al. Health inequalities and development plans in Iran; an analysis of the past three decades (1984–2010). Int J Equity Health 2014;13:42 10.1186/1475-9276-13-42 [DOI] [PMC free article] [PubMed] [Google Scholar]
- 37. Ibrahimipour H, Maleki MR, Brown R, et al. A qualitative study of the difficulties in reaching sustainable universal health insurance coverage in Iran. Health Policy Plan 2011;26:485–95. 10.1093/heapol/czq084 [DOI] [PubMed] [Google Scholar]
- 38. East Azerbaijan Management and Planning Organization Comparative study on East-Azerbaijan sensus data among various counties. Tabriz, Iran: East Azerbaijan Management and Planning Organization, 2016. [Google Scholar]
- 39. Ebrahimipour H, Karimi S, Sadighifar J. Evaluating and ranking of Isfahan provinces in terms of access to health sector indicators. Health Inform Manage 2013;10:1075–85. [Google Scholar]
- 40. Hosseinpoor AR, Naghavi M, Alavian SM, et al. Determinants of seeking needed outpatient care in Iran: results from a national health services utilization survey. Arch Iran Med 2007;10:439–45. doi:07104/AIM.005 [PubMed] [Google Scholar]
- 41. Park S-H, Lee S-M. Evidence-based decision-making and health Technology assessment in South Korea. Value in Health 2008;11(Suppl 1):S163–4. 10.1111/j.1524-4733.2008.00382.x [DOI] [PubMed] [Google Scholar]
- 42. Ministry of Health and Medical Education The executive guideline of rural insurance & family physician program. Ministry of Health and Medical Education Press, 2007. [Google Scholar]
- 43. LeBaron SWM, Schultz SH. Family medicine in Iran: the birth of a new specialty. Int Fam Med 2005;37:502–5. [PubMed] [Google Scholar]
- 44. Shalileh K, Mahdanian A. Family physicians' satisfaction in Iran: a long path ahead. The Lancet 2010;376:515 10.1016/S0140-6736(10)61252-4 [DOI] [PubMed] [Google Scholar]
- 45. Kavosi Z, Rashidian A, Pourreza A, et al. Inequality in household catastrophic health care expenditure in a low-income society of Iran. Health Policy Plan 2012;27:613–23. 10.1093/heapol/czs001 [DOI] [PubMed] [Google Scholar]
- 46. Prata N, Montagu D, Jefferys E. Private sector, human resources and health franchising in Africa. Bull World Health Organ 2005;83:274–9. doi:/S0042-96862005000400011 [PMC free article] [PubMed] [Google Scholar]
- 47. Tabrizi J, Saadati M, Sadeghi-Bazargani H, et al. Iranian public trust in health services: evidence from Tabriz, Islamic Republic of Iran. East Mediterr Health J 2016;22:713–8. 10.26719/2016.22.10.713 [DOI] [PubMed] [Google Scholar]
- 48. Tahmasebi N, Kebriaee Zadeh A, Imani A. Evaluation of factors affecting sales of prescription medicines by econometric methods in Iran. Pharmaceutical Sciences 2013;19:101–7. [Google Scholar]
- 49. Cheraghali A, Golestani M, eshghi P. Cost components of treatment protocols of haemophilia patients with inhibitors using bypassing agents in Iran. Iran J Pharm Sci 2016;12:85–90. [Google Scholar]
- 50. Davari M, Haycox A, Walley T. The Iranian health insurance system; past experiences, present challenges and future strategies. Iranian J Publ Health 2012;41:1–9. [PMC free article] [PubMed] [Google Scholar]
Associated Data
This section collects any data citations, data availability statements, or supplementary materials included in this article.
Supplementary Materials
fmch-2018-000007supp001.pdf (91KB, pdf)