

Summary
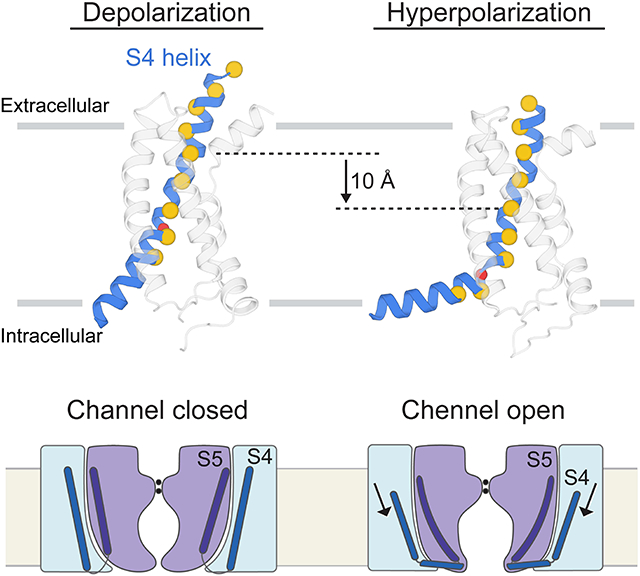
The hyperpolarization-activated cyclic nucleotide-gated (HCN) channel is a voltage-gated cation channel that mediates neuronal and cardiac pacemaker activity. HCN exhibits reversed voltage dependence, meaning it closes with depolarization and opens with hyperpolarization. Different than Na+, Ca2+ and Kv1–7 channels, HCN does not have domain-swapped voltage sensors. We introduced a reversible, metal-mediated cross bridge into the voltage sensors to create the chemical equivalent of a hyperpolarized conformation and determined the structure using cryo-EM. Compared to the depolarized HCN channel, the S4 helix is displaced towards the cytoplasm by two helical turns. Near the cytoplasm, S4 breaks into two helices, one running parallel to the membrane surface, analogous to the S4–S5 linker of domain-swapped voltage-gated channels. These findings suggest a basis for allosteric communication between voltage sensors and the gate in this kind of channel. They also imply that voltage sensor movements are not the same in all voltage-gated channels.
Graphical Abstract
In Brief
HCN, a voltage-sensitive pacemaker channel involved in rhythmic activity in the heart and brain, uses a gating mechanism that is distinct from other voltage-gated channels.
Introduction
Voltage-dependent proteins detect voltage differences across the cell membrane and respond by changing their conformation. A four transmembrane helix domain, called the voltage sensor, mediates this process. In voltage-gated ion channels, voltage sensors control the pore’s gate. Most voltage-gated ion channels, for example Na+, Ca2+ and Kv1–7 K+ channels, open when the cell membrane is depolarized (when voltage is made positive inside relative to outside). Mechanistic studies have focused predominantly on this class of voltage-gated channels. HCN, a cation channel, falls into a rarer class of voltage-gated channels that open when the membrane is hyperpolarized (when voltage is made negative inside relative to outside) (Gauss et al., 1998; Ludwig et al., 1998; Santoro et al., 1998). This property allows pacemaker activity (Sartiani et al., 2017). Sometimes called the pacemaker channel, HCN is found in the heart and nervous system, where physiological processes are controlled by frequency-tunable, pacemaker activity.
This study seeks to understand voltage sensor control of the gate in this less-studied class of hyperpolarization-gated ion channels. The four identical voltage sensors in HCN are structurally similar to voltage sensors in depolarization-gated channels (Lee and MacKinnon, 2017). In particular, the essential features of an S4 helix containing positive-charged amino acids every third position (Noda et al., 1984; Tanabe et al., 1987; Tempel et al., 1987) and a gating charge transfer center through which the positive charges are transferred across the center of the membrane (Tao et al., 2010) are conserved.
If all voltage sensors are structurally similar, the manner in which they are attached to the pore is variable. So far, voltage-gated ion channels fall into two architectural categories: those with domain-swapped (voltage sensor leaning against the pore element formed by a neighboring subunit, (Figure 1B)) and those with non-domain-swapped voltage sensors (Figure 1 A). Na+, Ca2+ and Kv1–7 K+ channels have domain-swapped voltage sensors. Domain-swapping necessitates an S4–S5 linker helix, which runs horizontal to the membrane plane; four of these, one from each subunit, encircle the pore’s gate. The S4–S5 linker is thought to function as a lever, transferring movements of the S4 helix to the gate (Long et al., 2005; Wisedchaisri et al., 2019; Xu et al., 2019).
Figure 1. Domain arrangements of voltage-gated ion channels.

(A) Non-domain-swapped channel. A single subunit of the channel tetramer is highlighted in blue. For this type of channels, the voltage sensor domain interacts with the pore domain from the same subunit. The HCN1 channel is shown here as an example (PDB ID, 5U6P) (B) Domain-swapped channel. For this type of channels, the voltage sensor domain interacts with the pore domain from an adjacent subunit. The Kv1.2–2.1 channel is shown as an example (PDB ID, 2R9R) (Only the transmembrane regions of the two channels are shown for clarity). (C) Channel topology and voltage preference for activation. Representative channels are listed in each category. Currently the existence of a domain-swapped, hyperpolarization-activation channel has not been verified.
Voltage sensors in HCN are not domain-swapped and therefore a helical S4–S5 linker does not exist (Figure 1A). Thus, the manner in which movements of the S4 helix are transmitted to the pore must be different in HCN. To be clear, a non-domain-swapped architecture does not necessarily signify channel opening upon membrane hyperpolarization. Voltage-gated K+ channels Kv10–12 have voltage sensors that are not domain-swapped, like HCN, but they open with membrane depolarization (Figure 1C) (Wang and MacKinnon, 2017; Whicher and MacKinnon, 2016).
Thus, HCN is a voltage-gated channel that differs in two important respects from the more familiar and extensively analyzed voltage-gated Na+, Ca2+ and K+ channels. First, HCN opens with membrane hyperpolarization, and second, the voltage sensors are not domain-swapped.
Results
Chemical stabilization towards a hyperpolarized conformation
In the absence of an externally applied electric field, for example in a membrane at zero millivolts, voltage sensors in HCN adopt a depolarized conformation and the pore is closed (Gauss et al., 1998; Lee and MacKinnon, 2017; Ludwig et al., 1998; Santoro et al., 1998). Our aim in this study is to stabilize HCN on the pathway towards a hyperpolarized conformation and characterize its structure. The problem is, any attempt to stabilize a conformation using chemical cross links is biased by the placement of the cross links. This is because a high energy cross link, such as a disulfide bridge, can form between two distant cysteine residues, trapping a protein in a conformation that it normally approaches only very rarely (Careaga and Falke, 1992). This is particularly true when disulfide bridges are formed in the presence of strong oxidizing agents for long periods of time.
There is an approach with ion channels to test whether or not a chemical cross link forms between sites that normally come close to each other when the channel gates. By introducing a metal affinity site, the rate of cross link formation can be monitored in an electrophysiological assay (Liu et al., 1997). If the rate of cross link formation occurs in a state-dependent manner on the timescale of channel gating, and is regulatable through the same variables that control gating, then it is likely that the introduced site is formed by residues that come within close proximity along the conformational pathway of gating. Sites that only rarely come close to each other will react too slowly, not on the time scale of gating. With these criteria in mind, we introduced cysteine residues at two locations predicted to approach each other on the basis of an earlier study, in which we defined the gating charge transfer center in a voltage-gated K+ channel (Tao et al., 2010). The gating charge transfer center is a constellation of amino acids, including a phenylalanine and several negatively charged amino acids, at the center of the voltage sensor. In that study we proposed that, as the S4 helix moves, arginine or lysine residues enter the transfer center, one at a time, as they cross the membrane. In HCN, one of the ‘every-third-position’ amino acids on S4, which are almost always arginine or lysine, happens to be serine. We mutated the serine to cysteine (S264C) and also mutated one residue in the gating charge transfer center to cysteine (F186C). In the structure of the depolarized HCN channel these amino acids are separated by ~15 Å, as shown (Figure 2A). The question we now seek to answer is, does this double cysteine mutation introduce a gating state-dependent metal affinity cross link? Such a cross link would require the cysteine residues to approach within ~5 Å of each other.
Figure 2. Stabilizing HCN towards a hyperpolarized conformation.

(A) Strategy to stabilize the HCN voltage sensor in a hyperpolarized conformation. (B) Whole cell currents show reversible crosslinking of HCN F186C/S264C. The formation of Cd2+ cross link locks the F186C/S264C channel in an open state.
See also Figure S1.
In whole cell voltage-clamp recordings the HCN mutant F186C/S264C gates in a voltage- and time-dependent manner, similar to wild type HCN (Figure 2B). In these experiments the cell membrane is held at 0 mV; a voltage at which the channels are closed. When the membrane is then stepped to negative (hyperpolarizing) voltages, HCN channels open in a time-dependent manner. But when 100 mM Cd2+ is added to the extracellular solution, the time-dependent gating disappears and the channels appear locked in an open state, evidenced by conductivity mimicking a linear resistor between 0 mV and −130 mV. When Cd2+ is removed from solution, channels revert back to wild type gating behavior. These effects depend on the presence cysteine residues at both positions 186 and 264 (Figure 2B and Figure S1A).
Cross link formation is state-dependent and occurs on the same time scale as channel gating (Figure 3A). In the experiment shown, Cd2+ is applied twice. During the first addition the membrane is held at 0 mV, interrupted by hyperpolarizing square pulses applied at fixed intervals. After two pulses, nearly all channels are locked open. During the second addition of Cd2+ following washout of the first, the time interval leading to the first hyperpolarizing pulse is delayed. Despite the long exposure to Cd2+ prior to the first hyperpolarizing pulse, only about 30% of the channels became locked open by the start of the first pulse. These results show that Cd2+ cross linking occurs rapidly when channels are opened by hyperpolarization and much more slowly when channels are held closed. The nearly 80% reactivity between the first and second pulse of the first Cd2+ addition occurred during the relatively brief first square pulse. Thus, Cd2+ cross link formation occurs on the time scale of channel gating. We find also that Cd2+ cross linking is highly voltage-dependent, as expected if proximity of the cysteine residues is regulated by the voltage-dependent protein conformational changes that underlie gating (Figure 3B and 3C). These electrophysiological properties support the conjecture that sites 186 and 264 come into close proximity to each other along the conformational pathway towards a hyperpolarized state.
Figure 3. Crosslinking of HCN F186C/S264C depends on the state of the channel.

(A) Cd2+ effect is more prominent when the channels are opened by hyperpolarization. In the first Cd2+ application, Cd2+ quickly increases the initial current recorded from hyperpolarizing square pulses, suggesting that the cross link forms efficiently during hyperpolarization. Note that almost all channels are locked open within seconds. In contrast, applying Cd2+ at 0 mV (where the channels are kept closed) for even 1 minute can only locked ~30% of the channel open. Current traces at selected time points are shown in the right. Initial currents indicated by an arrow are used to plot the left panel. (B) Voltage sensitivity of Cd2+ cross linking in HCN F186C/S264C. Peak tail currents indicated by an arrow are used to construct activation curves. (C) Activation curves of F186C/S264C in the absence or presence of Cd2+ (mean ± SEM; n = 3 to 6).
Structure of the cross-linked channel
We next expressed and purified the cysteine mutant channel and determined its structure in the presence Hg2+ to a resolution of 3.0 Å using single particle cryo-EM (Figure 4A, 4B and Figure S1B and S2). Hg2+ was used because it forms a chemically similar cross link with two cysteine residues, but with higher energy than Cd2+. Compared to the wild type HCN channel structure, the S4 helix is shifted towards the cytoplasmic side, with position 264 of the S4 helix next to position 186 of the gating charge transfer center (Figure 2A). The Cβ atoms of modelled cysteines 186 and 264 are separated by 6.5 Å and density for Hg2+ is located between them. The modelled S-Hg bond distance ~2.2 Å and geometry are consistent with reported data on the chemistry of cysteine-mediated metal bridges (Manceau and Nagy, 2008; Reyes et al., 2009) (Figure S2D). A narrow, polar pathway connects the extracellular solution to the metal ion between the cysteine residues (Figure S3).
Figure 4. Structure of the cross-linked HCN channel.

(A) Cryo-EM density map of the cross-linked HCN F186C/S264C channel. Each channel subunit is shown in a different color. (B) Structure of the cross-linked HCN F186C/S264C channel. TMD, transmembrane domain. CNBD, cyclic nucleotide binding domain.
See also Figures S1, S2 and S3.
We refer to this cross-linked channel as the ‘hyperpolarized channel’ or ‘towards a hyperpolarized conformation’, with the understanding that it is a cross link-stabilized channel that should be similar to a conformation favored by hyperpolarizing membrane voltages. We refer to the wild type channel, determined at 0 mV without a cross link, as the ‘depolarized channel’.
Movement of the S4 helix
The two helical turn (~10 Å) displacement of the S4 helix from its position in the depolarized HCN channel to its new position is accompanied by the secondary structural changes shown (Figure 5A and 5B). Alpha helical secondary structure is colored blue and 310 helical structure yellow. The region of 310 helix remains approximately at the center of the membrane in both structures. This means different amino acids form the segment of 310 helix in each (Figure 5C). As the helix moves, amino acids in the α helical segment near the extracellular surface must reorganize into a 310 helix. Simultaneously, amino acids beginning as a 310 helix must reorganize into an α helix as they approach the intracellular surface. In a previous study we observed a 310 helical segment in a single Kv structure and proposed that this kind of α helix to 310 helix transition would likely occur and called it a ‘concertina effect’ (Long et al., 2007). The 310 helix motif has now been observed in many voltage sensors (Guo et al., 2016; Payandeh et al., 2011; Sun and MacKinnon, 2017; Tao et al., 2017; Whicher and MacKinnon, 2016; Wu et al., 2016) and its significance seems obvious. A 310 helix causes the positive-charged amino acids on S4, arranged with every-third periodicity, to turn away from the lipid environment and into the gating charge transfer center near the middle of the membrane, where electrostatic destabilization of unshielded charges is greatest. A 310 helix is more tightly wound than an α helix and is associated with a higher energy cost. But it is clear that the energetic benefit of shielding arginine and lysine side chains deep inside the hydrophobic core must outweigh the higher cost of the 310 helix. When the first voltage-dependent ion channel genes were cloned, the most striking and unusual characteristic of the proteins they encode was the hydrophobic helix with positive-charged amino acids at every third position (Noda et al., 1984; Tanabe et al., 1987; Tempel et al., 1987). A dynamic α to 310 helix transition associated with S4 displacement beautifully rationalizes the every-third distribution of charges.
Figure 5. Movement of S4 in the voltage sensor.

(A and B) Helical geometry of S4 in depolarized and hyperpolarized conformations. The black dash lines represent approximate boundaries of the membrane bilayer. Red spheres denote Cα positions of Arg252 (R-2), Arg255 (R-1), Arg258 (R0), Lys261 (K1), Ser264 (S2), Arg267 (R3), Arg270 (R4), Arg273 (R5) and Arg276 (R6). (C) Transition of the 310-helical conformation in the S4 helix. Horizontal bars highlight the region of 310-helical conformation. The amino acid sequence along the S4 helix is shown and the numbering of positive-charged residues below the sequence is based on an alignment to Kv1.2 channel (Lee and MacKinnon, 2017; Tao et al., 2010). (D and E) Movement of positive charges during hyperpolarization. Residues compose the gating charge transfer center (Phe186, Asp189 and Asp225) are also labeled.
Breaking of S4 into two helices by hyperpolarization
With displacement of S4 towards a hyperpolarized conformation, two arginine residues, R3 (Arg267) and R4 (Arg270), move from above the gating charge transfer center down into and below it (Figure 5 D and 5E) (Dai et al., 2019). We observe also that the S4 helix breaks into two helices instead of the single helix observed in the depolarized conformation (Figure 6A). Above and including R4, S4 is vertical and crosses the membrane; below R4 it runs nearly horizontal, parallel to the intracellular membrane surface (Figure 6A). The helical break is stabilized by the side chain of Ser272, which forms a hydrogen bond with the carbonyl oxygen of Leu269, thus capping the end of the vertical segment of S4 (Figure 6B). The horizontal segment of S4 directs the side chains of R5 and R6 towards the intracellular solution, while at the same time it directs several lipophilic side chains towards the lipid membrane and a tryptophan towards the membrane-aqueous interface (Figure 6C). The conversion of a single long transmembrane S4 helix in the depolarized conformation into two separate helices in a hyperpolarized conformation apparently reduces the energetic penalty that would be incurred by inserting part of S4 into the aqueous solution inside the cell. While arginine and lysine residues are more stable (i.e. are at lower energy) in an aqueous environment, hydrophobic amino acids are less stable there. The conformation we observe, in which the C-terminal end of S4 forms an interfacial helix on the intracellular surface, would seem to achieve some balance between these favorable and unfavorable interactions.
Figure 6. Interfacial S4 helix created by hyperpolarization.

(A) Vertical translation of the S4 helix from depolarization to hyperpolarization. Spheres denote Cα positions of positive-charged residues, Ser264 (S2) and Ser272. The gray bars represent approximate boundaries of the membrane bilayer. (B) Interaction between Ser272 and Leu269 potentially stabilizes the helical break. (C) Interfacial helix transformed from the C-terminal end of S4.
Activation mechanism of the HCN channel
The new conformation of S4 produces a large displacement of the S5 helix away from the S6 helical bundle, which forms the pore’s gate (Figure 7A and 7B). The gate remains closed, implying that while the voltage sensor is at least partly hyperpolarized, it may not be enough so to open the pore. To query further whether the displacement of S5 observed in the hyperpolarized channel is one that could be associated with pore opening, we determined the structure of a mutant, Y289D, known to have a high open probability at 0 mV (Chen et al., 2001) to a resolution of 3.5 Å (Figure 7C, 7D and Figure S4). The voltage sensor of this mutant adopts a depolarized conformation, like wild type, but the S5 helix is shifted away from S6 in the same direction as in the hyperpolarized channel, although to a lesser extent (Figure 7C and 7D). The similar deviation of S5 in both suggests that S4 controls the gate in HCN through displacement of S5 relative to S6 (Cowgill et al., 2019).
Figure 7. Activation mechanism of the HCN channel.

(A and B) Movement of the S5 helix during hyperpolarization. Superposition of HCN in hyperpolarized (blue) and depolarized conformations (gray, PDB ID 5U6P, determined at a resolution of 3.5 Å). The intracellular end of S5 moves ~8 Å (as measured at Cα positions of Ala294). (C and D) Movement of the S5 helix in the Y289D mutant. Superposition of HCN Y289D (teal) and wild type channel (WT, gray, PDB ID 5U6P).
See also Figure S4.
Discussion
In this study we attempted to stabilize HCN in a conformation that it would normally adopt when the cell membrane is hyperpolarized. To do this we used a metal affinity bridge formed between a site-directed cysteine placed on S4 and one placed in the gating charge transfer center. Because a metal affinity bridge is rapidly reversible, an electrophysiological assay can be used to monitor the onset of cross bridge formation in real time through its effect on gating (Liu et al., 1997). We found that cross bridge formation occurred in a state-dependent manner, on the time scale of gating, and was regulatable through changes in membrane voltage, similar to channel gating itself. With these criteria fulfilled, we are reasonably confident that the conformation stabilized by the metal affinity bridge is similar to a conformation favored by hyperpolarizing membrane voltages.
The structure shows that S4 is displaced such that the two cysteine residues are in close proximity. When the S4 changes its vertical position from depolarized to hyperpolarized, the segment that adopts a 310 helix remains near the center of the membrane, but comprises different amino acids. In other words, amino acids move into and out of the 310 helix region, which is the mechanism by which positive charged amino acid side chains turn away from the lipid core and into the gating charge transfer center deep inside the membrane. The presence of a 310 helix in the S4 of many other voltage sensors implies that other voltage-gated channels may operate in a similar manner, with α dynamic a helix to 310 helix transition (Guo et al., 2016; Payandeh et al., 2011; Sun and MacKinnon, 2017; Tao et al., 2017; Whicher and MacKinnon, 2016; Wu et al., 2016). We note that the a helix to 310 helix transition (i.e. the concertina effect) allows the S4 helix to translate without rotating about its long axis (i.e. without a helical screw motion).
Hyperpolarization in HCN creates an interfacial helix out of the C-terminal end of S4. This observation was not anticipated. The conformational change occurs very far from the cysteine mutations. Ser272 is strategically located on S4 to cap one end of the broken helix (Figure 6B). And an interfacial helix is able to explain energy stabilization of the hyperpolarized S4 in a channel that does not have the permanent interfacial S4–S5 linker helix of domain-swapped voltage-gated channels. For these reasons, we think that the S4 conversion to two helices is not an artifact, but rather a part of voltage-dependent gating in HCN. Whether this two-helix property is a feature of other non-swapped voltage-gated channels or a feature of hyperpolarization-gated channels remains to be seen.
The reader may wonder, as do we, why the metal bridge produces an open channel at 0 mV in the electrophysiology experiments but the pore is closed in the structure? It may be that the structure is on the pathway to a hyperpolarized conformation, close, but not quite there. It is also possible that the open probability of the cross-linked channel at 0 mV, although nearly maximally activated by voltage, could be far below 0.5 and therefore has a mostly closed gate when averaged over time. We have witnessed several other examples of channel structures with closed gates under conditions that should maximally activate them (Chen et al., 2014; Dürr et al., 2014; Lee and MacKinnon, 2018; Whorton and MacKinnon, 2013). We do not understand why this is such a frequent occurrence. This uncertainty notwithstanding, we think these results reveal previously unknown aspects of voltage sensing by the HCN channel. The results also suggest that voltage sensors in different channels may not undergo the same conformational changes.
STAR Methods
LEAD CONTACT AND MATERIALS AVAILABILITY
Further information and requests for reagents should be directed to the lead contact Roderick MacKinnon (mackinn@rockefeller.edu). All unique/stable reagents generated in this study are available from the lead contact with a completed Material Transfer Agreement.
EXPERIMENTAL MODEL AND SUBJECT DETAILS
Cell lines
Chinese hamster ovary (CHO)-K1 cells were cultured in DMEM/F-12 medium supplemented with 10% fetal bovine serum. Sf9 cells were cultured in Sf-900 II SFM medium (Gibco) at 28 °C. HEK293S GnTI− cells were cultured in Freestyle 293 medium supplemented with 2% fetal bovine serum at 37 °C.
METHOD DETAILS
Electrophysiological recording
CHO-K1 cultured in 35 mm petri dishes were transiently transfected with 2 μg HCN1EM DNA plasmid using Lipofectamine 3000 according to the manufacturer’s instructions. After 48–96 h, the medium was replaced with the bath solution (55 mM KCl, 100 mM NaCl, 1 mM CaCl2, 10 mM glucose, and 10 mM HEPES pH 7.4; 310 mOsm). When indicated, 100 μM Cd2+ was added into the bath solution. For whole-cell recording, polished borosilicate micropipettes (resistance of 2–5 MΩ) were filled with the pipette solution (85 mM KCl, 70 mM KF, 5 mM EGTA, and 10 mM HEPES pH 7.2; 297 mOsm), and the recordings were obtained at room temperature (~23 °C) using an Axopatch 200B amplifier, a Digidata 1550 digitizer and pCLAMP. The recordings were low-pass filtered at 1 kHz and sampled at 20 kHz. The average current amplitude of HCN F186C/S264C is similar to the wild type channel.
Protein Expression and purification
HCN1EM mutants were expressed in HEK293S GnTI− cells (Goehring et al., 2014). Cells in suspension were grown at 37 °C to a density of ~3 × 10⁶ cells/ml and then baculoviruses carrying HCN genes were added to initiate the transduction. After 10 h, 10 mM sodium butyrate was added to cells and the culture temperature was shifted to 30 °C. Cells were harvested at 58 h post-transduction. HCN mutants express to similar extents as the wild type does (Figure S1B).
Protein purification was performed at 4 °C. The infected cell pellet from 1 L culture was resuspended in 200 ml hypotonic lysis buffer (20 mM KCl, 0.5 mM MgCl2, 5 μM cAMP, 0.1 mg/ml DNase, 10 mM Tris pH 8 and protease inhibitors) for 25 min, and the lysate was spun at 39800 × g for 35 min to sediment crude membranes. The membrane pellet was mechanically homogenized and solubilized in the extraction buffer (10 mM lauryl maltose neopentyl glycol, 2 mM cholesteryl hemisuccinate, 300 mM KCl, 5 μM cAMP, 20 mM Tris pH 8 and protease inhibitors) for 1.5 h. Solubilized membranes were clarified by centrifugation at 39800 × g for 55 min. The supernatant was applied to the GFP nanobody-coupled Sepharose resin (Kirchhofer et al., 2010), which was subsequently washed with 10 column volumes of the wash buffer (0.05 % digitonin, 300 mM KCl, 5 μM cAMP, 20 mM Tris pH 8 and protease inhibitors). The washed resin was incubated overnight with human rhinovirus 3C protease at a target protein to protease ratio of 40:1 (w/w) to cleave off GFP. The protein was eluted with the wash buffer, concentrated and purified through gel-filtration chromatography in the SEC buffer (0.05 % digitonin, 150 mM KCl, 5 μM cAMP and 20 mM Tris pH 8). Peak fractions were pooled and concentrated to 5–6 mg/ml. Prior to EM grid preparation, 5 mM cAMP was spiked to the protein sample. For HCN F186C/S264C sample, 200 μM HgCl2 was also added at this stage.
EM data acquisition
Aliquots of 3.5 μl purified HCN sample were applied to glow-discharged Quantifoil R1.2/1.3 400 mesh Au grids. After 15 s, the grids were blotted for 1.5 s and plunged into liquid ethane using a Vitrobot Mark IV (FEI) operated at 16 °C and 100% humidity. The grids were loaded onto a 300 kV Titan Krios transmission electron microscope with the K2 Summit detector. Micrographs were recorded in super-resolution mode using SerialEM (Mastronarde, 2005). Images have a physical pixel size of 1.03 Å (super-resolution pixel size of 0.515 Å) and a nominal defocus range of 1.2 to 2.3 μm. A dose rate of 8 electrons per pixel per second was used. The exposure time for each image was 10 s, with 0.2 s per frame. This gave a total cumulative dose of ~75 electrons per Å2 (1.51 electrons per Å2 per frame).
Image processing
Super-resolution image stacks were gain-normalized, binned by 2, and corrected for beam-induced motion using MotionCor2 (Zheng et al., 2017). Contrast transfer function parameters were estimated from motion-corrected summed images without dose-weighting using GCTF (Zhang, 2016). All subsequent processing was performed on motion-corrected summed images with dose-weighting. Particles were picked using Gautomatch (written by Kai Zhang). 2D and 3D classification were performed in RELION 3.0 (Scheres, 2012). The major classes of particles were refined and subjected to Bayesian particle polishing in RELION (Zivanov et al., 2019), followed by a final round of refinement using cryoSPARC2 (Punjani et al., 2017). The mask-corrected FSC curves were calculated in cryoSPARC2 and reported resolutions were based on the FSC = 0.143 criterion (Scheres and Chen, 2012). Local resolutions of density maps were estimated by Blocres (Cardone et al., 2013).
Model building
An initial model was obtained by docking the cAMP-bound HCN1EM structure (PDB code: 5U6P) into the density map using Chimera (Pettersen et al., 2004). The models were then refined iterative iteratively in Coot (Emsley et al., 2010) and Phenix (Afonine et al., 2018). The quality of final models was evaluated by MolProbity (Chen et al., 2010). The S4 helix geometry was analyzed using HELANAL-Plus (Kumar and Bansal, 2012). Figures were prepared using PyMOL (Schrödinger LLC, 2017) and Chimera.
DATA AND CODE AVAILABILITY
Data Resources
Cryo-EM density maps of the cross-linked HCN1 F186C/S264C and HCN1 Y289D have been deposited in the electron microscopy data bank under accession code EMD-20846 and 20847, respectively. Atomic coordinates of the cross-linked HCN1 F186C/S264C and HCN1 Y289D have been deposited in the protein data bank under accession code 6UQF and 6UQG, respectively.
Supplementary Material
Figure S1. Functional and biochemical analysis of HCN mutants, Related to Figure 2 and 4 (A) Cd2+ effects on the single or double cysteine HCN mutants. Current decay at 0 mV was used as a measure of Cd2+ crosslinking (mean ± SEM; n = 3 to 6). (B) Representative size-exclusion chromatography traces of HCN wild type (WT) and F186C/S264C. Peak fractions were used for cryo-EM analysis.
Figure S2. Cryo-EM reconstructions of the cross-linked HCN F186C/S264C channel, Related to Figure 4 (A) Local resolution of density map estimated by Blocres. (B) Angular distribution of particles for the final 3D reconstruction. (C) Fourier shell correlation (FSC) curves: half map 1 versus half map 2 (black), model versus summed map (blue). (D) Representative cryo-EM densities of the transmembrane regions. (E) Summary of refinement statistics.
Figure S3. Metal ion pathway in the HCN voltage sensor, from the extracellular solution to the binding site, Related to Figure 4 (A) Stereo view of the HCN sensor in a hyperpolarized conformation, viewed parallel to the membrane. Polar residues lining the pathway are labeled. The side chain of D222 is not modelled due to the absence of cryo-EM density. (B) Pathway to the metal ion binding site, viewed from the extracellular side.
Figure S4. Cryo-EM reconstructions of the HCN Y289D channel, Related to Figure 7 (A) Local resolution of density map estimated by Blocres. (B) Angular distribution of particles for the final 3D reconstruction. (C) Fourier shell correlation (FSC) curves: half map 1 versus half map 2 (black), model versus summed map (blue). (D) Summary of refinement statistics.
KEY RESOURCES TABLE
| REAGENT or RESOURCE | SOURCE | IDENTIFIER |
|---|---|---|
| Chemicals, Peptides, and Recombinant Proteins | ||
| DMEM/F-12 medium | Gibco | 11330–032 |
| Sf-900 II SFM medium | Gibco | 10902–088 |
| Freestyle 293 medium | Gibco | 12338–018 |
| Lipofectamine 3000 reagent | Invitrogen | L3000015 |
| Cellfectin II reagent | Invitrogen | 10362100 |
| lauryl maltose neopentyl glycol | Anatrace | NG310 |
| Cholesteryl hemisuccinate | Anatrace | CH210 |
| Digitonin | Calbiochem | 300410 |
| 3’ ,5’-cyclic AMP sodium salt | Sigma-Aldrich | A6885 |
| Deposited Data | ||
| Human HCNIEM F186C/264C | This study | EMDB: EMD-20846 PDB: 6UQF |
| Human HCN1EM Y289D | This study | EMDB: EMD-20847 PDB: 6UQG |
| Experimental Models: Cell Lines | ||
| CHO-K1 | ATCC | CRL-9618 |
| Sf9 | ATCC | CRL-1711 |
| HEK293S GnTI− | ATCC | CRL-3022 |
| Recombinant DNA | ||
| Human HCN1EM F186C/264C | This study | N/A |
| Human HCN1EM Y289D | This study | N/A |
| Software and Algorithms | ||
| Seriel EM | Mastronarde, 2005 | http://bio3d.colorado.edu/SerialEM |
| UCSF MotionCor2 | Zheng et al., 2017 | https://msg.ucsf.edu/em/software/motioncor2.html |
| Gctf | Zhang, 2016 | http://www.mrc-lmb.cam.ac.uk/kzhang/ |
| RELION | Scheres, 2012; Zivanov et al., 2019 | http://www2.mrc-lmb.cam.ac.uk/relion |
| Gautomatch | Kai Zhang | http://www.mrc-lmb.cam.ac.uk/kzhang/ |
| cryoSPARC2 | Punjani et al., 2017 | https://cryosparc.com/ |
| Blocres | Cardone et al., 2013 | https://lsbr.niams.nih.gov/bsoft/programs/blocres.html |
| UCSF Chimera | Pettersen et al., 2004 | https://www.cgl.ucsf.edu/chimera |
| COOT | Emsley et al., 2010 | https://www2.mrc-lmb.cam.ac.uk/personal/pemsley/coot |
| PHENIX | Afonine et al., 2018 | https://www.phenix-online.org |
| MolProbity | Chen et al., 2010 | http://molprobity.biochem.duke.edu |
| HELANAL-Plus | Kumar and Bansal, 2012 | http://nucleix.mbu.iisc.ernet.in/helanalplus/index.html |
| PyMOL | Schrodinger LLC, 2017 | http://www.pymol.org |
| Other | ||
| CNBR-activated Sepharose beads | GE Healthcare | 17043001 |
| Superose 6 Increase, 10/300 GL | GE Healthcare | 29091596 |
| R1.2/1.3 400 mesh Au holey carbon grids | Quantifoil | 1210627 |
Highlights.
Structure of the HCN channel in a hyperpolarized conformation is determined
S4 helix is displaced by two turns, accompanying by α to 310 helix transition
Hyperpolarization breaks S4 into two helices, one running parallel to the membrane
We propose a mechanism of electromechanical coupling in the HCN channel
Acknowledgments
We thank M. Ebrahim and J. Sotiris at the Evelyn Gruss Lipper Cryo-EM Resource Center of Rockefeller University for assistance with data collection, Dr. Chen Zhao, Dr. James Lee and members of MacKinnon and Jue Chen laboratories for helpful discussions. This work was supported in part by National Institutes of Health grant GM43949. C-H.L. is supported by the Jane Coffin Childs Memorial Fund fellowship (#61-1632). R.M. is an investigator of the Howard Hughes Medical Institute. We gratefully acknowledge the support of NVIDIA Corporation with the donation of the Titan X Pascal GPU.
Footnotes
Publisher's Disclaimer: This is a PDF file of an unedited manuscript that has been accepted for publication. As a service to our customers we are providing this early version of the manuscript. The manuscript will undergo copyediting, typesetting, and review of the resulting proof before it is published in its final form. Please note that during the production process errors may be discovered which could affect the content, and all legal disclaimers that apply to the journal pertain.
Declaration of interests
The authors declare no competing interests.
References
- Afonine PV, Poon BK, Read RJ, Sobolev OV, Terwilliger TC, Urzhumtsev A, Adams PD, and IUCr (2018). Real-space refinement in PHENIX for cryo-EM and crystallography. Acta Crystallogr. Sect. D Struct. Biol 74, 531–544. [DOI] [PMC free article] [PubMed] [Google Scholar]
- Cardone G, Heymann JB, and Steven AC (2013). One number does not fit all: mapping local variations in resolution in cryo-EM reconstructions. J. Struct. Biol 184, 226–236. [DOI] [PMC free article] [PubMed] [Google Scholar]
- Careaga CL, and Falke JJ (1992). Structure and dynamics of Escherichia coli chemosensory receptors. Engineered sulfhydryl studies. Biophys. J 62, 209–216. [DOI] [PMC free article] [PubMed] [Google Scholar]
- Chen J, Mitcheson JS, Tristani-Firouzi M, Lin M, and Sanguinetti MC (2001). The S4-S5 linker couples voltage sensing and activation of pacemaker channels. Proc. Natl. Acad. Sci. U. S. A 98, 11277–11282. [DOI] [PMC free article] [PubMed] [Google Scholar]
- Chen L, Dürr KL, and Gouaux E (2014). X-ray structures of AMPA receptor-cone snail toxin complexes illuminate activation mechanism. Science 345, 1021–1026. [DOI] [PMC free article] [PubMed] [Google Scholar]
- Chen VB, Arendall WB, Headd JJ, Keedy DA, Immormino RM, Kapral GJ, Murray LW, Richardson JS, and Richardson DC (2010). MolProbity: All-atom structure validation for macromolecular crystallography. Acta Crystallogr. Sect. D Biol. Crystallogr 66, 12–21. [DOI] [PMC free article] [PubMed] [Google Scholar]
- Cowgill J, Klenchin VA, Alvarez-Baron C, Tewari D, Blair A, and Chanda B (2019). Bipolar switching by HCN voltage sensor underlies hyperpolarization activation. Proc. Natl. Acad. Sci. U. S. A 116, 670–678. [DOI] [PMC free article] [PubMed] [Google Scholar]
- Dai G, Aman TK, DiMaio F, and Zagotta WN (2019). The HCN channel voltage sensor undergoes a large downward motion during hyperpolarization. Nat. Struct. Mol. Biol 26, 686–694. [DOI] [PMC free article] [PubMed] [Google Scholar]
- Dürr KL, Chen L, Stein RA, De Zorzi R, Folea IM, Walz T, Mchaourab HS, and Gouaux E (2014). Structure and dynamics of AMPA receptor GluA2 in resting, pre-open, and desensitized states. Cell 158, 778–792. [DOI] [PMC free article] [PubMed] [Google Scholar]
- Emsley P, Lohkamp B, Scott WG, and Cowtan K (2010). Features and development of Coot. Acta Crystallogr. Sect. D Biol. Crystallogr 66, 486–501. [DOI] [PMC free article] [PubMed] [Google Scholar]
- Gauss R, Seifert R, and Kaupp UB (1998). Molecular identification of a hyperpolarization-activated channel in sea urchin sperm. Nature 393, 583–587. [DOI] [PubMed] [Google Scholar]
- Goehring A, Lee C-H, Wang KH, Michel JC, Claxton DP, Baconguis I, Althoff T, Fischer S, Garcia KC, and Gouaux E (2014). Screening and large-scale expression of membrane proteins in mammalian cells for structural studies. Nat. Protoc 9, 2574–2585. [DOI] [PMC free article] [PubMed] [Google Scholar]
- Guo J, Zeng W, Chen Q, Lee C, Chen L, Yang Y, Cang C, Ren D, and Jiang Y (2016). Structure of the voltage-gated two-pore channel TPC1 from Arabidopsis thaliana. Nature 531, 196–201. [DOI] [PMC free article] [PubMed] [Google Scholar]
- Kumar P, and Bansal M (2012). HELANAL-Plus: a web server for analysis of helix geometry in protein structures. J. Biomol. Struct. Dyn 30, 773–783. [DOI] [PubMed] [Google Scholar]
- Lee C-H, and MacKinnon R (2017). Structures of the Human HCN1 Hyperpolarization-Activated Channel. Cell 168, 111–120.e11. [DOI] [PMC free article] [PubMed] [Google Scholar]
- Lee C-H, and MacKinnon R (2018). Activation mechanism of a human SK-calmodulin channel complex elucidated by cryo-EM structures. Science 360, 508–513. [DOI] [PMC free article] [PubMed] [Google Scholar]
- Liu Y, Holmgren M, Jurman ME, and Yellen G (1997). Gated access to the pore of a voltage-dependent K+ channel. Neuron 19, 175–184. [DOI] [PubMed] [Google Scholar]
- Long SB, Campbell EB, and Mackinnon R (2005). Voltage sensor of Kv1.2: structural basis of electromechanical coupling. Science 309, 903–908. [DOI] [PubMed] [Google Scholar]
- Long SB, Tao X, Campbell EB, and MacKinnon R (2007). Atomic structure of a voltage-dependent K+ channel in a lipid membrane-like environment. Nature 450, 376–382. [DOI] [PubMed] [Google Scholar]
- Ludwig A, Zong X, Jeglitsch M, Hofmann F, and Biel M (1998). A family of hyperpolarization-activated mammalian cation channels. Nature 393, 587–591. [DOI] [PubMed] [Google Scholar]
- Manceau A, and Nagy KL (2008). Relationships between Hg(II)-S bond distance and Hg(II) coordination in thiolates. Dalton Trans 1421–1425. [DOI] [PubMed] [Google Scholar]
- Mastronarde DN (2005). Automated electron microscope tomography using robust prediction of specimen movements. J. Struct. Biol 152, 36–51. [DOI] [PubMed] [Google Scholar]
- Noda M, Shimizu S, Tanabe T, Takai T, Kayano T, Ikeda T, Takahashi H, Nakayama H, Kanaoka Y, Minamino N, et al. (1984). Primary structure of Electrophorus electricus sodium channel deduced from cDNA sequence. Nature 312, 121–127. [DOI] [PubMed] [Google Scholar]
- Payandeh J, Scheuer T, Zheng N, and Catterall WA (2011). The crystal structure of a voltage-gated sodium channel. Nature 475, 353–358. [DOI] [PMC free article] [PubMed] [Google Scholar]
- Pettersen EF, Goddard TD, Huang CC, Couch GS, Greenblatt DM, Meng EC, and Ferrin TE (2004). UCSF Chimera--a visualization system for exploratory research and analysis. J. Comput. Chem 25, 1605–1612. [DOI] [PubMed] [Google Scholar]
- Punjani A, Rubinstein JL, Fleet DJ, and Brubaker MA (2017). cryoSPARC: algorithms for rapid unsupervised cryo-EM structure determination. Nat. Methods 14, 290–296. [DOI] [PubMed] [Google Scholar]
- Reyes N, Ginter C, and Boudker O (2009). Transport mechanism of a bacterial homologue of glutamate transporters. Nature 462, 880–885. [DOI] [PMC free article] [PubMed] [Google Scholar]
- Santoro B, Liu DT, Yao H, Bartsch D, Kandel ER, Siegelbaum SA, and Tibbs GR (1998). Identification of a Gene Encoding a Hyperpolarization-Activated Pacemaker Channel of Brain. Cell 93, 717–729. [DOI] [PubMed] [Google Scholar]
- Sartiani L, Mannaioni G, Masi A, Novella Romanelli M, and Cerbai E (2017). The Hyperpolarization-Activated Cyclic Nucleotide-Gated Channels: from Biophysics to Pharmacology of a Unique Family of Ion Channels. Pharmacol. Rev 69, 354–395. [DOI] [PubMed] [Google Scholar]
- Scheres SHW (2012). RELION: implementation of a Bayesian approach to cryo-EM structure determination. J. Struct. Biol 180, 519–530. [DOI] [PMC free article] [PubMed] [Google Scholar]
- Scheres SHW, and Chen S (2012). Prevention of overfitting in cryo-EM structure determination. Nat. Methods 9, 853–854. [DOI] [PMC free article] [PubMed] [Google Scholar]
- Schrödinger LLC (2017). The PyMOL Molecular Graphics System, Version 2.0
- Sun J, and MacKinnon R (2017). Cryo-EM Structure of a KCNQ1/CaM Complex Reveals Insights into Congenital Long QT Syndrome. Cell 169, 1042–1050.e9. [DOI] [PMC free article] [PubMed] [Google Scholar]
- Tanabe T, Takeshima H, Mikami A, Flockerzi V, Takahashi H, Kangawa K, Kojima M, Matsuo H, Hirose T, and Numa S (1987). Primary structure of the receptor for calcium channel blockers from skeletal muscle. Nature 328, 313–318. [DOI] [PubMed] [Google Scholar]
- Tao X, Lee A, Limapichat W, Dougherty DA, and MacKinnon R (2010). A gating charge transfer center in voltage sensors. Science 328, 67–73. [DOI] [PMC free article] [PubMed] [Google Scholar]
- Tao X, Hite RK, and MacKinnon R (2017). Cryo-EM structure of the open high-conductance Ca2+-activated K+channel. Nature 541, 46–51. [DOI] [PMC free article] [PubMed] [Google Scholar]
- Tempel BL, Papazian DM, Schwarz TL, Jan YN, and Jan LY (1987). Sequence of a probable potassium channel component encoded at Shaker locus of Drosophila. Science 237, 770–775. [DOI] [PubMed] [Google Scholar]
- Wang W, and MacKinnon R (2017). Cryo-EM Structure of the Open Human Ether-à-go-go-Related K+ Channel hERG. Cell 169, 422–430.e10. [DOI] [PMC free article] [PubMed] [Google Scholar]
- Whicher JR, and MacKinnon R (2016). Structure of the voltage-gated K+ channel Eag1 reveals an alternative voltage sensing mechanism. Science 353, 664–669. [DOI] [PMC free article] [PubMed] [Google Scholar]
- Whorton MR, and MacKinnon R (2013). X-ray structure of the mammalian GIRK2-βγ G-protein complex. Nature 498, 190–197. [DOI] [PMC free article] [PubMed] [Google Scholar]
- Wisedchaisri G, Tonggu L, McCord E, Gamal El-Din TM, Wang L, Zheng N, and Catterall WA (2019). Resting-State Structure and Gating Mechanism of a Voltage-Gated Sodium Channel. Cell 178, 993–1003.e12. [DOI] [PMC free article] [PubMed] [Google Scholar]
- Wu J, Yan Z, Li Z, Qian X, Lu S, Dong M, Zhou Q, and Yan N (2016). Structure of the voltage-gated calcium channel Cav1.1 at 3.6 Å resolution. Nature 537, 191–196. [DOI] [PubMed] [Google Scholar]
- Xu H, Li T, Rohou A, Arthur CP, Tzakoniati F, Wong E, Estevez A, Kugel C, Franke Y, Chen J, et al. (2019). Structural Basis of Nav1.7 Inhibition by a Gating-Modifier Spider Toxin. Cell 176, 702–715.e14. [DOI] [PubMed] [Google Scholar]
- Zhang K (2016). Gctf: Real-time CTF determination and correction. J. Struct. Biol 193, 1–12. [DOI] [PMC free article] [PubMed] [Google Scholar]
- Zheng SQ, Palovcak E, Armache J-P, Verba KA, Cheng Y, and Agard DA (2017). MotionCor2: anisotropic correction of beam-induced motion for improved cryo-electron microscopy. Nat. Methods 14, 331–332. [DOI] [PMC free article] [PubMed] [Google Scholar]
- Zivanov J, Nakane T, and Scheres SHW (2019). A Bayesian approach to beam-induced motion correction in cryo-EM single-particle analysis. IUCrJ 6, 5–17. [DOI] [PMC free article] [PubMed] [Google Scholar]
Associated Data
This section collects any data citations, data availability statements, or supplementary materials included in this article.
Supplementary Materials
Figure S1. Functional and biochemical analysis of HCN mutants, Related to Figure 2 and 4 (A) Cd2+ effects on the single or double cysteine HCN mutants. Current decay at 0 mV was used as a measure of Cd2+ crosslinking (mean ± SEM; n = 3 to 6). (B) Representative size-exclusion chromatography traces of HCN wild type (WT) and F186C/S264C. Peak fractions were used for cryo-EM analysis.
Figure S2. Cryo-EM reconstructions of the cross-linked HCN F186C/S264C channel, Related to Figure 4 (A) Local resolution of density map estimated by Blocres. (B) Angular distribution of particles for the final 3D reconstruction. (C) Fourier shell correlation (FSC) curves: half map 1 versus half map 2 (black), model versus summed map (blue). (D) Representative cryo-EM densities of the transmembrane regions. (E) Summary of refinement statistics.
Figure S3. Metal ion pathway in the HCN voltage sensor, from the extracellular solution to the binding site, Related to Figure 4 (A) Stereo view of the HCN sensor in a hyperpolarized conformation, viewed parallel to the membrane. Polar residues lining the pathway are labeled. The side chain of D222 is not modelled due to the absence of cryo-EM density. (B) Pathway to the metal ion binding site, viewed from the extracellular side.
Figure S4. Cryo-EM reconstructions of the HCN Y289D channel, Related to Figure 7 (A) Local resolution of density map estimated by Blocres. (B) Angular distribution of particles for the final 3D reconstruction. (C) Fourier shell correlation (FSC) curves: half map 1 versus half map 2 (black), model versus summed map (blue). (D) Summary of refinement statistics.
Data Availability Statement
Data Resources
Cryo-EM density maps of the cross-linked HCN1 F186C/S264C and HCN1 Y289D have been deposited in the electron microscopy data bank under accession code EMD-20846 and 20847, respectively. Atomic coordinates of the cross-linked HCN1 F186C/S264C and HCN1 Y289D have been deposited in the protein data bank under accession code 6UQF and 6UQG, respectively.