Significance
Building and maintaining sarcomeres is a tremendous challenge for the myocyte. This includes expression of the giant protein titin, assembly of the premyofibril, integration of titin into the sarcomere lattice, and remodeling under load with elimination of aged sarcomeric proteins. It is still unclear how titin synthesis and sarcomere assembly are orchestrated, how titin is integrated into the sarcomere, and how working sarcomeres afford constant remodeling, as they need to exchange titin proteins at the end of their lifetime. Here, we use a dual fluorophore knockin mouse that allows us to simultaneously follow titin’s N and C termini in vivo and study titin integration into the developing and mature sarcomere as well as sarcomere remodeling and disassembly.
Keywords: sarcomere, titin, proteostasis, live imaging, STED microscopy
Abstract
Cardiac protein homeostasis, sarcomere assembly, and integration of titin as the sarcomeric backbone are tightly regulated to facilitate adaptation and repair. Very little is known on how the >3-MDa titin protein is synthesized, moved, inserted into sarcomeres, detached, and degraded. Here, we generated a bifluorescently labeled knockin mouse to simultaneously visualize both ends of the molecule and follow titin’s life cycle in vivo. We find titin mRNA, protein synthesis and degradation compartmentalized toward the Z-disk in adult, but not embryonic cardiomyocytes. Originating at the Z-disk, titin contributes to a soluble protein pool (>15% of total titin) before it is integrated into the sarcomere lattice. Titin integration, disintegration, and reintegration are stochastic and do not proceed sequentially from Z-disk to M-band, as suggested previously. Exchange between soluble and integrated titin depends on titin protein composition and differs between individual cardiomyocytes. Thus, titin dynamics facilitate embryonic vs. adult sarcomere remodeling with implications for cardiac development and disease.
The sarcomere provides a structural basis for the heartbeat and for voluntary movement in higher organisms. Mutations in sarcomeric proteins can lead to severe disease, such as dilated cardiomyopathy (1), most frequently caused by patient mutations in the giant sarcomeric protein titin (2).
Titin is abundantly expressed in vertebrate striated muscle (3) and extensively spliced to produce isoforms with differential mechanical properties (4–6). Titin synthesis is a major feat with transcription alone taking an hour or more for full-length titin calculated from the speed of transcription by RNA polymerase II (7). It is unclear how titin mRNAs move, where they are translated, and how the resulting proteins move to their sarcomeric integration sites.
To form a continuous elastic filament system along the myofiber, titin integrates both into the Z-disk and M-band of the sarcomere (8, 9). The resulting scaffold with the Z-disk protein α-actinin and the M-band protein myomesin provides distinct binding sites and thus proper spacing for diverse sarcomeric proteins as well as regulation of myosin filament length (10). Accordingly, titin has been proposed to act as a molecular ruler and as a blueprint for sarcomere assembly.
Nevertheless, alignment of sarcomeric proteins and assembly start even before titin is available, and titin molecules do not form a static backbone, but move along and between sarcomeres (11). So far, it is still unclear how titin synthesis, relocation to the sarcomere, integration into the myofilament lattice, disintegration, and degradation are spatially and temporally organized to enable remodeling and adaptation in development and disease.
The formation of myofilaments has been studied intensively, indicated by the abundance of models for sarcomere assembly: The “2-state” model suggests a chaotic vs. a “highly ordered suprastructure” where multiple latent protein complexes are gradually assembled into the mature sarcomere (12). In one embodiment, a stress fiber-like structure, composed of nonmuscle proteins, serves as a reusable template to recruit sarcomeric proteins (13). Alternatively, actin filaments attached to Z-disks and A-bands might form independently and could subsequently be stitched together in a process dependent on titin (14, 15). In the prevailing premyofibril model, short minisarcomere structures that include Z-bodies attached to actin filaments and miniature A-bands assemble, then integrate titin to form nascent myofibers, which transition to mature myofibers (16, 17). None of these models considers how titin protein synthesis is regulated and compartmentalized, although spatial information on titin RNA and protein in chicken embryos exists since 20 y (18). Toward understanding sarcomere disassembly—there is limited insight from dividing cardiomyocytes (19) and no model on how titin molecules are disintegrated and replaced within the sarcomeric structure at the end of their lifetime.
Using titin-eGFP knockin mice, we have shown previously that titin is not the rigid backbone of the sarcomere. Rather, it moves along and across sarcomeres, although at significantly slower speeds than most other sarcomeric proteins (exchange half-lives of several hours vs. minutes, as determined by fluorescence recovery after photobleaching [FRAP]) (11). Although titin-eGFP mice allow for analysis of sarcomere dynamics in vivo, including effects of calcium and contractility (11), the animal model provides a limited view on sarcomere assembly as it cannot distinguish between integration at the Z-disk vs. M-band. In this study, we followed titin expression, homeostasis, and localization from embryo to adult using an animal model with distinct fluorophores labeling its N and C termini, which are >1 µm apart when integrated into the relaxed sarcomere. Live imaging of titin’s Z-disk and M-band region provided insights into how sarcomeres are assembled, disassembled, and reassembled with parallel integration of titin at both ends of the half-sarcomere. As sarcomeres mature, the transition from assembly to activity is accompanied by compartmentalization of protein production and degradation with localization of ribosomes, and proteasomes toward the Z-disk. We suggest that a pool of soluble titin molecules exists from which embryonic sarcomeres can be assembled and mature sarcomeres can be replenished. This includes full-length titin and truncated isoforms with higher mobility. Based on the differential titin mobility between cardiomyocytes as determined by recovery after photobleaching, we suggest an unexpected heterogeneity of titin mobility and thus titin isoform expression at the single-cell level.
Results
Physiological Expression of Fluorescently Tagged Titin Molecules Is Compatible with Normal Sarcomere Assembly and Striated Muscle Function.
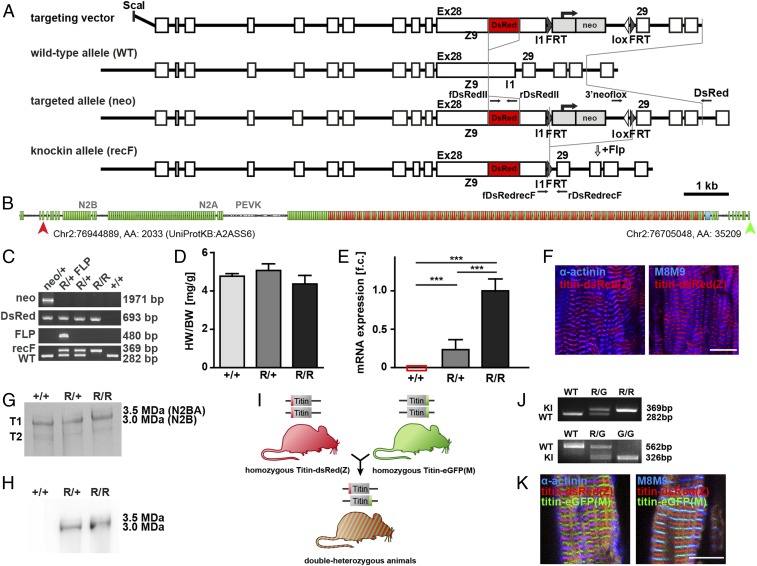
To follow titin during sarcomere assembly and visualize its N and C termini simultaneously, we combined the eGFP knockin at M-band exon 6 (11) [titin-eGFP(M)] with the newly generated DsRed-knockin at Z-disk exon 28 [titin-DsRed(Z)]. The latter resulted from homologous recombination in embryonic stem (ES) cells, blastocyst injection, and removal of the NEO cassette using the FLP recombinase transgene after germline transmission (Fig. 1 A–C). There was no obvious adverse phenotype with normal reproduction, weight gain, heart weight-to-body weight ratio, isoform expression, and contractile behavior of cardiomyocytes in DsRed knockin mice (Fig. 1D and SI Appendix, Fig. S1 A–I). DsRed-Titin was expressed at intermediate levels in heterozygous and at high levels in homozygous animals (Fig. 1E). The fusion protein integrated properly into the sarcomere, as its Z-disk region colocalized with α-actinin (Fig. 1F). Expression of DsRed-tagged titin was confirmed by vertical SDS agarose gel electrophoresis followed by Western blot analysis (Fig. 1 G and H and SI Appendix, Fig. S1 N and O). Homozygous breeding of titin-DsRed(Z) and titin-eGFP(M) knockin mice produced the expected Mendelian ratio of 100% double-heterozygous titin-DsRed(Z)/titin-eGFP(M) mice (Fig. 1 I and J). In these animals, titin integrates properly into the Z-disk and M-band where DsRed colocalizes with α-actinin and eGFP with the titin epitope M8M9 (Fig. 1K). Double-heterozygous mice had normal body and heart weights (SI Appendix, Fig. S1 D–I). Again, there was no effect on titin isoform expression on RNA or protein level (SI Appendix, Fig. S1 D–F). The lack of an apparent phenotype and proper integration of DsRed- and eGFP-Titin into the sarcomere makes this model a suitable tool to discriminate titin’s N and C termini and study myofilament dynamics.
Fig. 1.
Generation and basic characterization of the titin-DsRed(Z) knockin and double-heterozygous titin-DsRed(Z)/titin-eGFP(M) mice. (A) Targeting strategy to insert DsRed into titin’s N terminus at exon 28. Homologous recombination of the linearized targeting vector into the wild-type allele (WT) in ES cells leads to the targeted allele (neo). After germline transmission, the neomycin resistance cassette flanked by 2 FRT sites was removed by transgenic expression of the FLP-recombinase. The resulting mice carry the knockin allele (recF) with DsRed and 1 remaining FRT site. Primers for genotyping are indicated as arrows. (B) Domain structure of titin with indicated positions of dsRed and eGFP insertion at protein and DNA level. (C) PCR-based genotyping of wild-type (+/+), heterozygous (R/+), and homozygous (R/R) titin-DsRed(Z) knockin mice. Bands indicate the targeted allele (neo) and the excision of the Neo cassette (recF) after introduction of the Flp transgene (FLP). (D) Heart weight-to-body weight ratio (HW/BW) was not significantly different between animals; n = 4; mean with SEM; 1-way ANOVA, P > 0.05. (E) Titin-DsRed(Z) mRNA levels were quantified by qRT-PCR with intermediate titin-DsRed expression in heterozygotes (R/+) (n = 3; mean with SEM; 1-way ANOVA; ***P < 0.001). (F) Cryosections of heart tissue from homozygous titin-DsRed(Z) animals (R/R) stained for α-actinin (Z-disk) and for titin’s M-band region M8M9 to visualize titin integration. (Scale bar: 10 µm.) (G) SDS-agarose gel stained with Coomassie; cardiac isoforms N2B (3 MDa) and N2BA (3.5 MDa) are unchanged between genotypes. T2 is a degradation product. (H) Western blot analysis with an anti-DsRed antibody to verify the expression of titin-DsRed(Z) in heterozygous and homozygous titin-DsRed(Z) animals. (I) Breeding of the homozygous titin-eGFP(M) mice with the homozygous titin-DsRed(Z) mice led to 100% double-heterozygous animals with titin labeled at the Z-disk and M-band. (J) Genotyping PCR of DsRed inserted into titin’s exon 28 (Top) and eGFP inserted into M-band exon 6 (Bottom). (K) Cryosections of double-heterozygous titin-DsRed(Z)/titin-eGFP(M) hearts stained for α-actinin (Z-disk) or titin’s M-band region M8M9. Titin-DsRed(Z) and titin-eGFP(M) properly integrate into the sarcomere colocalizing with α-actinin and M8M9, respectively. (Scale bar: 10 µm.)
Titin mRNA Is Localized toward the Sarcomeric Z-Disk and Not Lined Up along the Sarcomeric Backbone.
To provide titin for sarcomere assembly and maintenance, the giant protein has to be synthesized and transported to the sites of integration—either by localized translation followed by diffusion toward its integration sties at Z-disk and M-band or by translation along a titin mRNA laid out from Z-disk to M-band.
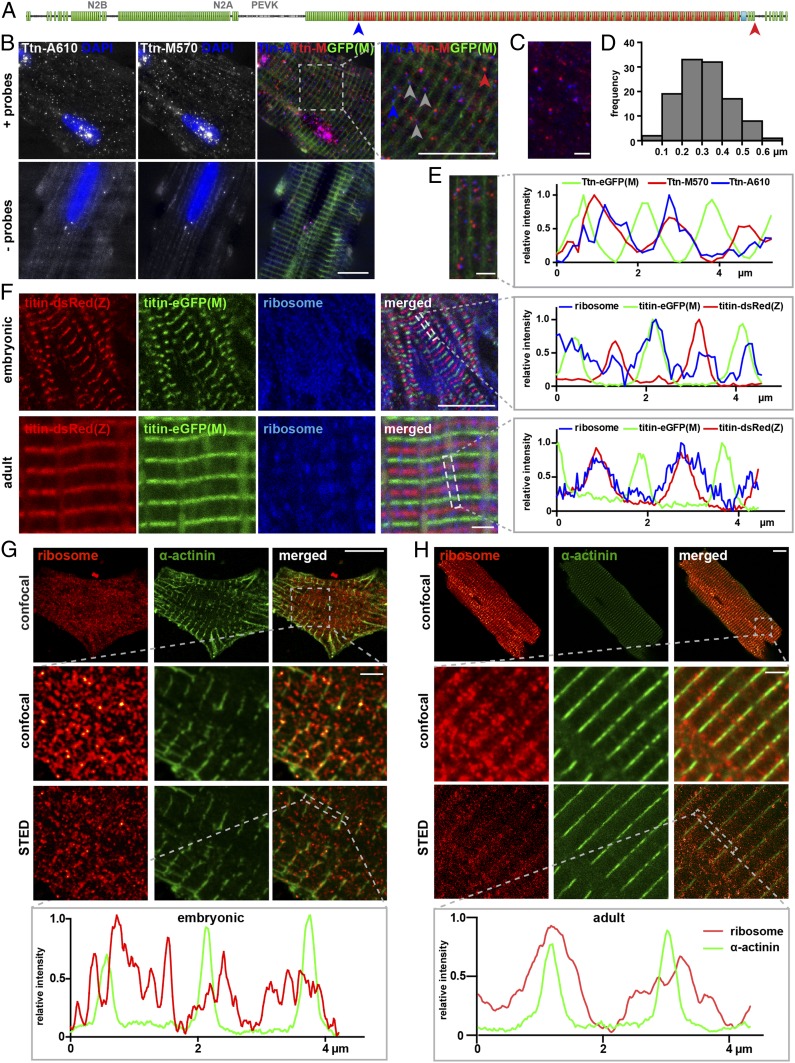
In adult Titin-eGFP(M) cardiomyocytes, the localization of titin mRNA was detected with specific probes against the A-band and M-band region using single-molecule fluorescence in situ hybridization (smFISH) (Fig. 2 A–E). Each subregion of a single RNA is represented as an individual dot (Fig. 2B). The most prominent signals were located within the nucleus and indicate sites of transcription. Outside the nucleus, the majority of titin mRNAs form a periodic pattern, suggesting that mRNAs do not freely diffuse, but localize at sites of translation along the myofilament. Titin mRNA signals corresponding to A-band (red) and M-band (blue; indicated in Fig. 2A) are generally in close proximity (Fig. 2B, gray arrow), at a distance from 0.1 to 0.6 μm (Fig. 2 C and D), suggesting the presence of condensed vs. elongated RNA molecules. We rarely find RNA signals, where only A-band (blue arrow) or M-band (red arrow) are represented. These RNA species likely represent truncated titin isoforms or result from exon skipping.
Fig. 2.
Sites of sarcomeric protein synthesis differ between embryonic and mature cardiomyocytes with titin mRNA and ribosomes localized toward the Z-disk in adults. (A) FISH probes were directed against the titin A-band and M-band region, respectively. (B) Localization of titin mRNA in titin-eGFP(M) adult cardiomyocytes. The probes detect single titin molecules. (Scale bar: 10 µm.) Ttn-A (blue) and Ttn-M (red) probes localize in close proximity, but not directly on top of each other as expected for background (Bottom). (C and D) The distance between Ttn-A and Ttn-M probe was measured in 4 regions of 4 different cells. (Scale bar: 2 µm.) (E) Straightened and stitched sarcomere segments of a representative cell. (Scale bar: 2 µm.) Localization of titin FISH probes relative to the M-band in line profile diagrams. (F) In embryonic cardiomyocytes, ribosomes distribute evenly along the myofiber. (Scale bar: 10 µm.) In adult cardiomyocytes, ribosomes are clustered around the Z-disk. Confocal images. (Scale bar: 2 µm.) (G) Superresolution microscopy (STED) of embryonic wild-type cardiomyocytes confirms localization of the ribosomes throughout the cytoplasm (α-actinin; green). (Scale bar: Top, overview, 10 µm; Middle and Bottom, 2 µm.) (H) In adult cardiomyocytes, ribosomes are localized at the Z-disk and extend into the I-band. At the Z-disk, α- actinin and ribosome signals overlay. (Scale bar: Top, overview, 10 µm; Middle and Bottom, 2 µm.) The localization of ribosomes is indicated as a line profile along the dotted rectangle.
To determine whether titin mRNA predominantly localizes toward the Z-disk or M-band, we aligned and merged 4 sarcomeric segments of individual cells to integrate the signal over multiple sarcomeres and obtain a representative localization profile (Fig. 2E). In the corresponding trace, titin mRNA predominantly localizes to toward the Z-disk, between the green M-band signals. The RNA-binding protein TDP-43 has previously been shown to colocalize with titin mRNA in myo-granules of regenerating skeletal muscle (20). In adult cardiomyocytes, it is expressed at low levels and localizes proximal to the Z-disk, where titin mRNA is present (SI Appendix, Fig. S2A).
As Cardiomyocytes Differentiate, Protein Synthesis Is Compartmentalized within the Sarcomere.
To extend the smFISH analysis and sublocalize the sites of protein production within the sarcomere, we used costaining of ribosomes and α-actinin at the Z-disk in embryonic and adult cardiomyocytes (Fig. 2 F–H). In embryonic cardiomyocytes at embryonic day 13.5 (E13.5), ribosomes were evenly distributed throughout the cytoplasm (Fig. 2 F and G)—independent of the time of cultivation (SI Appendix, Fig. S2). Here, protein production was not compartmentalized within the sarcomere facilitating diffusion of embryonic titin. In adult cardiomyocytes, ribosomes were mainly localized at the I-band and largely excluded from the A-band as revealed by confocal and superresolution microscopy (Fig. 2 F and H). The highest ribosome concentration was detected at the densely packed Z-disk (Fig. 2 F and H). This finding has implications for titin dynamics, as titin synthesized close to the Z-disk region in adult cardiomyocytes would subsequently need to bridge the distance to its M-band integration site.
Titin’s N and C Termini Integrate, Disintegrate, and Reintegrate Concurrently into the Z-Disk and M-Band.
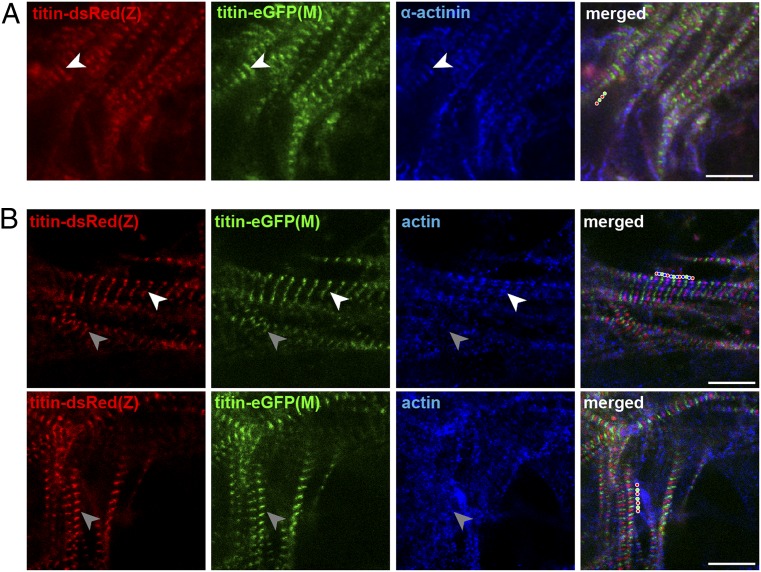
After isolation of ES cells from double-heterozygous animals [titin-DsRed(Z)/titin-eGFP(M)] and differentiation into cardiomyocytes, we followed titin integration during sarcomere assembly. The leading edge of newly assembled myofilaments consistently produced an alternating red and green pattern (SI Appendix, Fig. S3), which we find in all leading edges surveyed (Fig. 3 and SI Appendix, Fig. S3, 3× 3 to 4 replicates each with 2 to 5 leading edges per replicate for a total of >30), suggesting that integration of titin at the Z-disk is not a prerequisite for the integration into the M-band.
Fig. 3.
Sarcomere assembly and titin integration in differentiating ES cells. Alternating fluorescent titin bands in newly assembled sarcomeres are delineated with red and green dots, respectively (merged panels). The white and gray arrows indicate more and less mature integration sites, respectively. (A) α-Actinin staining identifies the punctate Z-bodies of the early developing premyofibrils before titin is integrated and Z-disks. (B) Staining for sarcomeric actin (thin filament) that partially overlaps with Z-disk titin. Mature sarcomeres with titin and actin integrated into the sarcomere lattice (white arrow) coexist with less mature regions where titin is integrated but actin is more distributed (gray arrow).
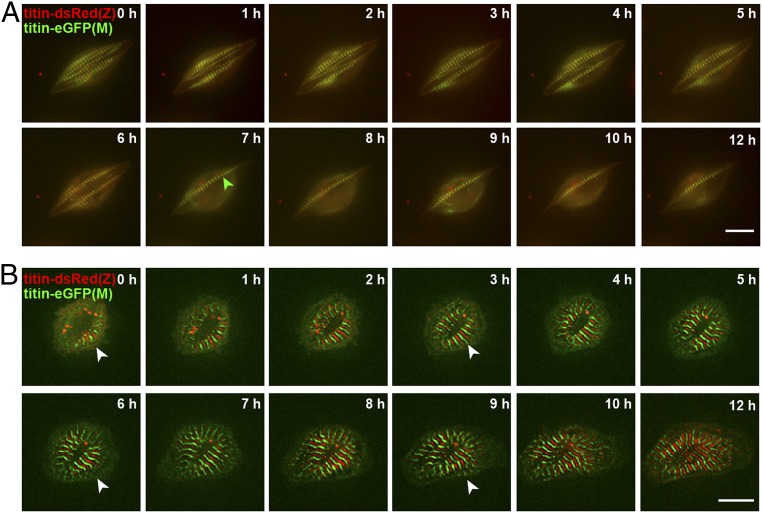
To distinguish premyofibrils from nascent myofibrils, we stained double-heterozygous cardiomyocytes for α-actinin, which produced a punctate staining that corresponds to Z-bodies and indicates early developing premyofibrils. These Z-bodies are known to eventually fuse into Z-disks (21, 22)—before they integrate titin (Fig. 3A). Actin staining was diffuse in immature cardiomyocytes and appeared compacted as developing sarcomeres matured (Fig. 3B). In some regions, titin emerged at Z-disk and M-band before actin extended into the A/I region. Based on the premyofibril model, one would expect neighboring DsRed signals following Z-disk integration prior to M-band integration as the final integration step, visible as an interspersed eGFP signal. However, there were no DsRed-titin doublet signals at the leading edge of nascent myofilaments in differentiating cardiomyocytes. In addition, we did not only find DsRed at the leading edge of the myofilament where sarcomeres are formed, but also eGFP. Together, these data suggest that there is no checkpoint in the process of sarcomere assembly, where Z-disk titin is integrated first and then followed by M-band integration. Similarly, sarcomere disassembly after treatment with myoseverin, a microtubule binding protein that reversibly disrupts sarcomere organization (23), does not proceed from M-band to Z-disk. Rather, sarcomeres release titin from the Z-disk and M-band and reintegrate titin without checkpoint control for Z-disk integration (Fig. 4 and SI Appendix, Fig. S4). Notably, the artificial disruption of sarcomeres with myoseverin leads to extreme cases of not only juxtaposed neighboring DsRed but also neighboring eGFP bands. This may reflect unordered disassembly rather than documenting directed disassembly, as both DsRed and eGFP variants exist (Fig. 4A). After complete disassembly, removal of myoseverin leads to reassembly, which again proceeds without directionality (Fig. 4B), similar to de novo sarcomere assembly.
Fig. 4.
Titin disintegrates from and reintegrates into the sarcomere without preference for Z-disk vs. M-band. (A) Embryonic cardiomyocytes treated with 20 µM Myoseverin to disrupt the sarcomeric structure. Titin disassembles in parallel from Z-disk and M-band (green disassembly does not precede red disassembly). Both titin-DsRed(Z) and titin-eGFP(M) doublets exist (green arrow and SI Appendix, Fig. S4). (Scale bar: 10 µm.) (B) Reassembly (white arrow) of the sarcomere after removal of Myoseverin with simultaneous integration of titin into the M-band and Z-disk. (Scale bar: 10 µm.)
A Subset of Titin Proteins Is Not Integrated into the Sarcomere but Diffusely Localized throughout the Sarcomeric and Extrasarcomeric Space.
Once sarcomeres are assembled and ribosomes localized to the Z-disk during maturation, nascent titin proteins need to move from the site of synthesis to their integration sites. We hypothesized that this movement of nonintegrated titin proteins should be reflected in a pool of mobile titin where the eGFP and DsRed tags do not localize to their respective integration sites. To dissect this mobile pool from background signal, we relied on the fluorescent titin fusion proteins, which reduced background signal as compared to antibody staining by directly looking at the native protein while excluding the potential for signals derived from antibody cross-reactivity. Nevertheless, we needed to account for autofluorescence of subcellular structures contributing to background signal and accordingly used wild-type cells as a reference in the same field of view proximal to the embryonic or adult double-heterozygous knockin cells (Fig. 5 and SI Appendix, Fig. S5). Indeed, we found increased background signal in longitudinally aligned cytoplasmic structures between the myofilaments, which correspond to chains of cardiac mitochondria (SI Appendix, Fig. S5D). Hence, these regions were excluded in subsequent analyses.
Fig. 5.
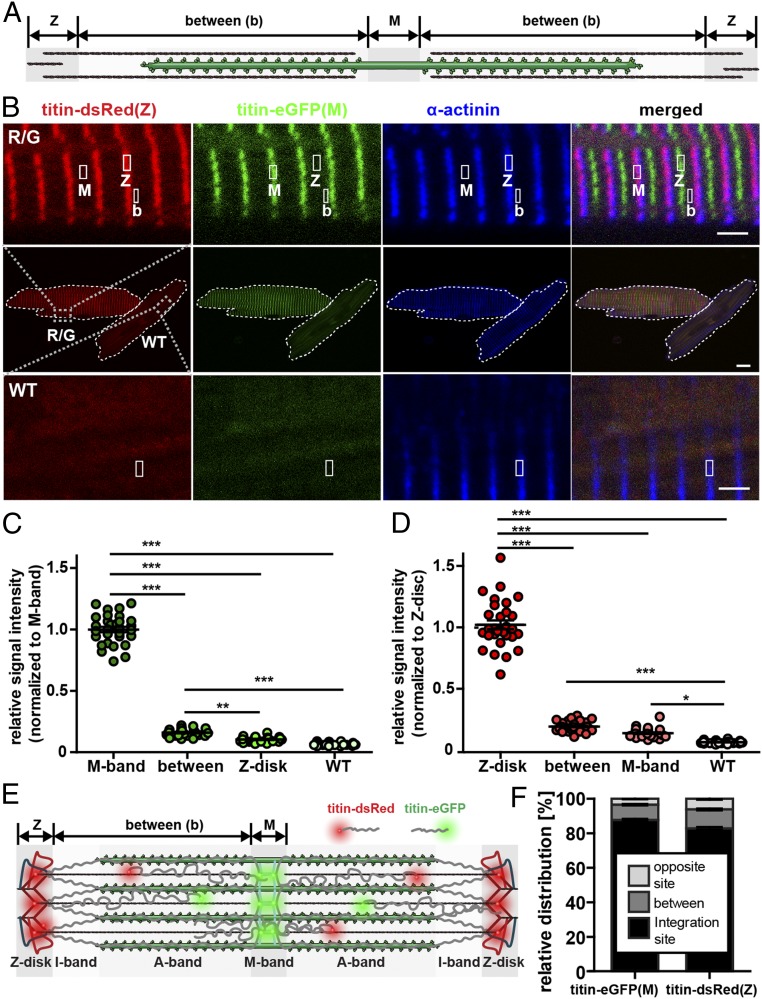
Titin’s N and C termini are not confined to their integration sites but localize throughout the sarcomere. (A) Schematic drawing of the regions of interest: Z-disk, M-band, and between the Z-disk and M-band (between) reflects titin molecules that are not incorporated into their integration sites within the myofilament. (B) Confocal images of titin-DsRed(Z)/titin-eGFP(M) and wild-type adult cardiomyocytes stained for α-actinin. M, M-band region; Z, Z-disk region; b, between. Regions of interest are indicated and magnified above for knockin cells and below for wild-type background controls. Please note the difference in signal intensity between B and the region outside the cell (background: bottom 10% of the frame). (Scale bar: middle, 10 µm; scale bar, zoomed images below and above, 2 µm.) (C and D) Relative signal intensity at selected sarcomeric regions in double-heterozygous and wild-type cells (C: 488 nm, green; D: 516 nm, red). Wild-type signal (WT) was recorded as background. Titin’s Z-disk and M-band regions localize outside the integration side with red and green signal above the WT background. M-band titin localizes at the Z-disk and Z-disk titin at the M-band, although at lower levels vs. between. (E) Schematic drawing of titin-DsRed(Z) and titin-eGFP(M) localized within and between integration sites in the mature sarcomere. (F) Less M-band titin signal is located outside its integration site (12.3%) compared to Z-disk signal (17.3%). One-way ANOVA with Bonferroni posttest; n = 30; *P < 0.05; **P < 0.01; ***P < 0.01. Error bars indicate SEM.
Quantification of titin signals along the myofilament revealed that the majority of titin was integrated but ∼17% of Z-disk and ∼12% of M-band titin localized outside their respective integration site (Fig. 5 C–F). We designate this as the mobile pool, which includes titin that is not only present between the integration sites at Z-disk and M-band, but also at the respective opposite integration site (i.e., Z-disk titin at the M-band and vice versa), suggesting that titins can move along and between sarcomeres including through areas of high protein density such as the Z-disk and M-band (Fig. 5F). Treatment with protease and proteasome inhibitors did not alter the pool of nonintegrated titin (SI Appendix, Fig. S5 E–G), suggesting that this pool is not an accumulation of titin fragments.
Differential Titin Z-Disk vs. M-Band Dynamics and Intercellular Heterogeneity.
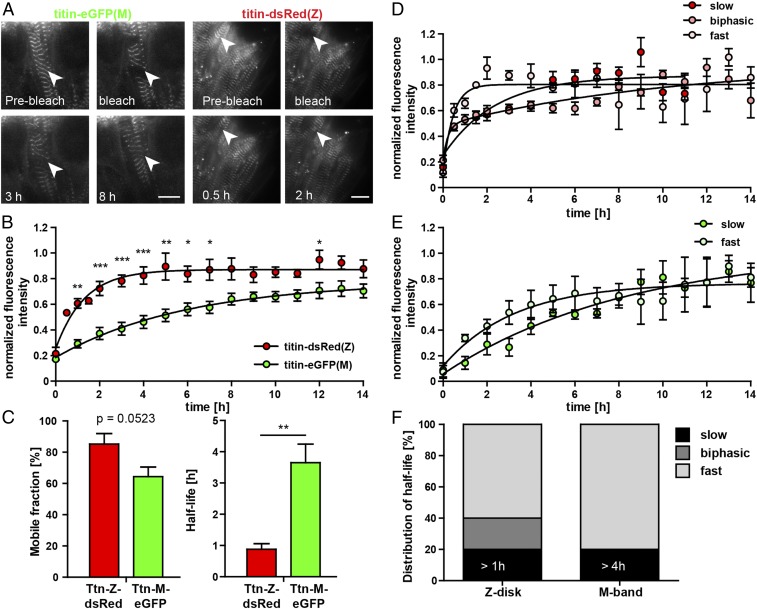
Titin is expressed as multiple different isoforms, including full-length titins that can be labeled with either fluorophore as well as truncated titin that only contains the DsRed labeled Z-disk region [Novex-3 (24)] or only contains the eGFP label [Cronos titin (25)]. To investigate whether this heterogeneity is reflected in different mobility of fluorescently labeled titins, we used FRAP. We compared intercellular heterogeneity in titin mobility and differences between Z-disk and M-band titin mobility. Embryonic cardiomyocytes homozygous for titin-DsRed(Z) or titin-eGFP(M) were isolated at E13.5, and we followed the recovery of titin signal after bleaching of an area of 2 × 2 sarcomere lengths (Fig. 6A). To confirm that recovery after photobleaching reflected mobility and not reconstitution of the fluorophore, we bleached fixed cells as a control. There was no recovery after photobleaching for 14 h in the fixation control when >90% of fluorescence had recovered after 6 h in living cells (SI Appendix, Fig. S6), suggesting that we faithfully captured protein mobility in our FRAP assay.
Fig. 6.
Cellular heterogeneity of titin dynamics at the Z-disk vs. M-band in embryonic cardiomyocytes. (A) Representative images of titin-eGFP(M) and titin-DsRed(Z) recovery after photobleaching of an area of 2 × 2 sarcomeres in embryonic cardiomyocytes at selected time points. (Scale bar: 10 µm.) (B) Normalized fluorescence intensity at the integration site over 14 h after bleaching (n = 5). (C) Mobile fraction and half-life of fluorescence recovery at the integration site of titin-DsRed(Z) and titin-eGFP(M). (D) Representative recovery diagrams of a fast, a slow, and a biphasic titin-DsRed(Z) cell. (E) Representative recovery diagrams of a fast and a slow titin-eGFP(M) cell. (F) Summary of cellular heterogeneity for titin-DsRed(Z) with slow cells exhibiting an exchange half-life of >1 h as a cutoff and titin-eGFP(M) with half-lives >4 h (n = 10 to 11 cells each). Statistical significance by 2-way ANOVA. Error bars indicate SEM.
We found significant differences in mobility between Z-disk and M-band labeled titins, which we quantify using exchange half-life after photobleaching (11) (Fig. 6B). The average mobile fractions were reduced for titin-eGFP(M), although not significantly, but mobility was reduced by a factor of 4 compared to titin-DsRed(Z) (Fig. 6C and SI Appendix, Table S1), suggesting that M-band integration of titin is stronger than Z-disk integration. Interestingly, we find an unexpected heterogeneity between individual cells with fast vs. slow recovery for the same integration site (Fig. 6 D and E and SI Appendix, Table S2). This suggests an effect that does not only depend on the integration site but also on the titin isoform makeup of the individual cell. This is also consistent with those titin-DsRed(Z) cells that show a biphasic recovery, as would be expected in cells coexpressing short and long titin isoforms with different mobility (Fig. 6 D and F).
Sarcomeric Protein Degradation Is Localized toward the Z-Disk as Cardiomyocytes Mature.
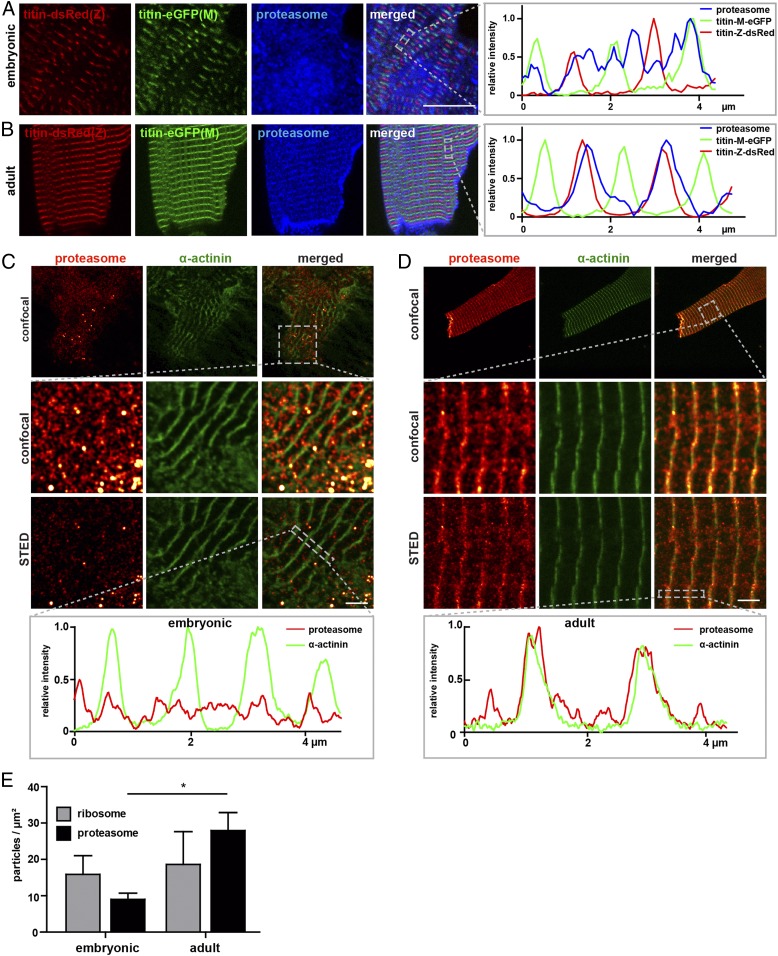
As protein synthesis is localized mainly at the Z-disk and I-band in adult cardiomyocytes only, we hypothesized that degradation would similarly be compartmentalized in adult but not in embryonic cardiomyocytes. Costaining with an antibody directed against the 20S-subunit of the proteasome revealed diffuse localization of proteasomes in embryonic cardiomyocytes (Fig. 7A) and an accumulation of proteasomes at the Z-disk and at the cell membrane of the intercalated disk in adult cardiomyocytes (Fig. 7B). As cardiomyocytes mature from embryonic to adult, proteasomes localized toward the Z-disk (Fig. 7 C and D) and the density of individual proteasomes was significantly increased (Fig. 7E).
Fig. 7.
Proteasome localization in cardiomyocytes. (A) In embryonic titin-DsRed(Z)/titin-eGFP(M) cardiomyocytes proteasomes (20s subunit) localize throughout the sarcoplasm (blue). (Scale bar: 10 µm.) (B) In adult cardiomyocytes, proteasomes localize to the Z-disk and intercalated disk. (Scale bar: 10 µm.) (C) STED images of wild-type embryonic cardiomyocytes, stained for α-actinin (Z-disk) and the 20s subunit of the proteasome. Proteasomes cluster throughout the sarcoplasm. (Scale bar: 2 µm.) (D) STED images of adult cardiomyocytes stained for α-actinin (Z-disk) and proteasomes with the majority of proteasome clusters associated with the Z-disk as visualized in the representative line profile. Proteasomes and α-actinin colocalize within the Z-disk (yellow dots). (Scale bar: 2 µm.) (E) Quantification of ribosomes vs. proteasomes in embryonic and adult cardiomyocytes (n = 4 to 8 per group). Statistical significance by 2-way ANOVA. Error bars indicate SEM.
Compared to ribosomes that localize toward both Z-disk and I-band in adult cardiomyocytes, proteasomes were more confined to the Z-disk (Fig. 7D vs. Fig. 2H). Thus, as cardiomyocytes mature, protein synthesis and degradation are compartmentalized at the Z-disk/I-band region, separating areas of actin/myosin interaction and areas of protein homeostasis, which requires movement of newly synthesized titin from the Z-disk to its integration sites and back to the Z-disk for degradation.
Discussion
Sarcomere assembly and adaptation are critically important not only in embryonic development but also in heart and skeletal muscle disease. In these studies, we followed titin synthesis, motility, integration into the sarcomere, disintegration, and degradation as the titin lifecycle is a main determinant of sarcomere structure and function. Our approach builds on knockin mice, which express fluorescently tagged titin protein. Unlike overexpression of fluorescently labeled titin fragments, which might not properly integrate into the sarcomere (26) or cause disassembly (8, 27), labeling full-length titin reduces potential adverse effects (11). We placed eGFP at the extreme C terminus to not interfere with the kinase domain on the opposite end of the M-band (28) and DsRed at the Z-disk/I-band to retain titin’s T-cap binding site at the opposite end of the Z-disk (8). Double-heterozygous and homozygous animals are phenotypically normal and allow direct visualization of sarcomere dynamics.
To compare the spatial constraints for titin dynamics in the embryonic and adult heart, we localized titin mRNA ribosomes and proteasomes in the cardiomyocyte. Titin mRNA is distributed along the myofiber and predominantly localized around the Z-disk (Fig. 2E); here, where we suggest the majority of translation and protein degradation to occur as opposed to the more tightly packed A-band region in the sarcomere (Fig. 8A). Recent work has shown that RNAs encoding sarcomeric proteins are integrated into granules, which are cleared as fibers mature (20). This process could contribute to compartmentalization of RNAs and limit their diffusion in the developing myocyte.
Fig. 8.
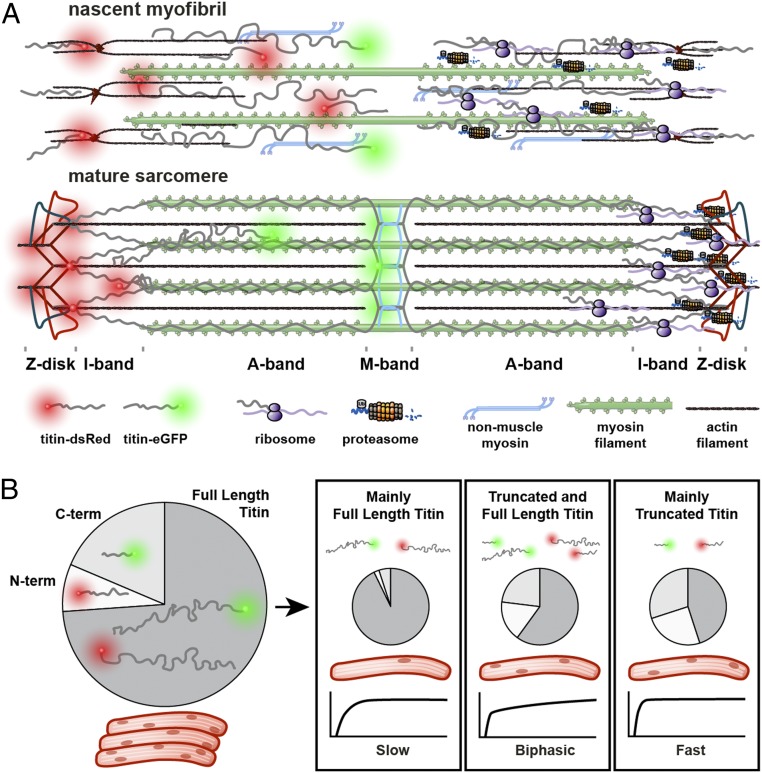
Titin dynamics in the developing and mature sarcomere. (A) As continuous titin filaments form, sites of protein turnover are localized at the Z-disk (Right), and the ratio of free to integrated titin is reduced (Left). (B) Cardiac tissue expresses full-length, N-terminal, and C-terminal titins. Differences in isoform composition at the single-cell level and increased mobility of long vs. short isoforms can contribute to differences in FRAP (slow, biphasic, or fast).
In the embryonic sarcomere, ribosomes and proteasomes were not compartmentalized. This might relate to the reduced protein density of immature sarcomeres and should additionally facilitate remodeling, as protein synthesis and degradation could occur at any site within the filament. The ratio of ribosome to proteasome was shifted toward the ribosome in the embryo—consistent with the expected net increase in protein synthesis in a developing organism. This is unlike the adult cardiomyocyte, where protein synthesis and degradation should be at a steady state. Indeed, we find an excess of proteasomes compared to ribosomes in adults: As sarcomeres mature, the transition from assembly to activity is accompanied by compartmentalization of protein production and degradation as ribosomes and proteasomes localize toward the Z-disk and regions outside the myofilament lattice where mitochondria accumulate. This pattern would be consistent with a scenario where titin is synthesized at the Z-disk and in the extrasarcomeric space and subsequently moves to its integration sites.
This is also supported by our comparison of knockin cells that express fluorescently labeled titin molecules to background fluorescence in wild-type cardiomyocytes in the same field of view (Fig. 5). We suggest that titin proteins exist outside their integration sites and estimated that 10 to 15% of titin proteins are not integrated into the sarcomeric backbone.
As titin protein synthesis proceeds from its N-terminal Z-disk region and as ribosomes conveniently localize there, it is tempting to speculate that titin is first integrated at the Z-disk and only later at the M-band. This would be consistent with the premyofibril model of sarcomere assembly: in the nascent myofiber, titin supposedly first attaches to Z-bodies with their N terminus, and later during development into the mature myofiber, the C terminus integrates into the M-band (16, 17). In our double-heterozygous titin knockin mouse, DsRed-tagged Z-disks do not form before eGFP-tagged M-bands appear, as we do not find red doublets that would indicate Z-disk titin-DsRed in the absence of M-band integrated eGFP-titin (Fig. 3). This applies to de novo sarcomere assembly as well as reassembly after myoseverin treatment (Fig. 4).
Taken together, the cardiomyocyte would thus maintain a mobile pool of titin that 1) facilitates the exchange of oxidized or damaged titin protein for newly synthesized titin at the Z-disk where ribosomes and proteasomes accumulate and 2) can replenish titin in the mature sarcomere integrating from either end of the protein.
Our Titin-eGFP(M) and Titin-DsRed(Z) knockin mice revealed that titin is not the rigid sarcomeric backbone, but that titin molecules move along and between sarcomeres. As titin is expressed in different N-terminal, full-length, and C-terminal isoforms, eGFP and DsRed label different titin pools: N-terminal titin fragments or the novex3 isoform only carry the red label, while C-terminal fragments or cronos titin only carry the green tag (Fig. 8B). Accordingly, proteins of different sizes and thus different mobility would provide different recovery times after photobleaching. Indeed, red fluorescence is recovered almost 4-times as fast as green fluorescence (Fig. 6). Interestingly, even within the Titin-DsRed(Z) and the Titin-eGFP(M) animals, we find cells that recover faster or more slowly. This heterogeneity could be explained with differences in titin protein composition or isoform expression at the single-cell level. As 20% of the Titin-DsRed(Z) cardiomyocytes produce a biphasic response for recovery after photobleaching, we would suggest that these cells express a mix of short and long titin proteins in similar amounts so that fast and slow recovery of different sized titins overlap (Fig. 8B). Once single-cell sequencing protocols with increased sensitivity are available, it should be possible to refine our analysis of cellular heterogeneity as it relates to sarcomere dynamics and thus cardiac remodeling.
In summary, this study provides insights on how and where titin is synthesized, stored, moved, integrated into the sarcomere, disintegrated, and degraded. We obtained evidence for a pool of soluble titin at an unexpected size of more than 15% of total titin in mature cardiomyocytes from which titin is added to the sarcomere in parallel at Z-disk and M-band. We found a striking difference between embryonic and mature cardiomyocytes in compartmentalization of titin synthesis and degradation as a basis for facilitated remodeling in the embryonic sarcomere vs. improved force generation in the adult sarcomere, where ribosomes and proteasomes localized away from the actin–myosin interface toward the Z-disk.
Materials and Methods
Generation of the DsRed(Z)-Knockin Mouse and Double-Heterozygous Titin-DsRed/Titin-eGFP(M) Mice.
A targeting vector to insert the DsRed cDNA into titin’s exon 28 (Z-disk, Fig. 1) was generated using standard procedures (29). Animals were backcrossed on a 129/S6 background, and for each experiment littermates were used (age and sex matched). For breeding, genotyping, and basic characterization, please refer to SI Appendix.
Animal Procedures.
Animal studies were approved by local authorities (Landesamt für Gesundheit und Soziales - LaGeSo Berlin).
SDS-Agarose Electrophoresis and Western Blot.
Protein lysates were prepared and analyzed as described previously (30), separated on agarose gels and blotted on polyvinylidene difluoride membranes. Primary antibodies were purchased from Invitrogen (anti-GFP; A11120) and from Clontech (anti-dsRed monomer; 632496). The secondary horseradish peroxidase-conjugated antibody was detected by chemiluminescence staining with ECL (Supersignal West Femto Chemiluminescent Substrate; Pierce Chemical) or by fluorescence staining with IRDye 680LT and IRDye 800CW (Odyssey; Li-COOR infrared detection system).
Real-Time PCR.
Heart tissue of all genotypes was collected, snap frozen, and grinded. Total RNA was isolated from tissue powder with TRIzol followed by a cleaning step with the Qiagen RNeasy isolation Kit. To convert RNA into cDNA, a reversed transcription PCR with a viral RNA-dependent DNA polymerase was performed using the RNA to cDNA Kit from Applied Biosystem or Thermo Scientific RevertAid RT Kit according to manufacturer’s specifications.
Immunofluorescence Staining.
Hearts from DsRed homozygous and DsRed/eGFP double-heterozygous animals were dissected and prepared for immunofluorescence staining as described previously (11). Cryosections were permeabilized and blocked with 10% goat serum, 0.3% Triton X-100, and 0.2% BSA in PBS for 2 h. Embryonic and adult cardiomyocytes were fixed with 4% paraformaldehyde (PFA) at room temperature for 10 min followed by permeabilization and blocking as above.
Primary antibodies were incubated at 4 °C overnight (1:100 anti-α-actinin, Sigma-Aldrich; 1:200 anti-titin M8M9, Siegfried Labeit; 1:50 anti-RPLP0; Sigma-Aldrich; 1:50 anti-20s proteasome, Thermo Fisher; 1:50 anti-MTCO1, Abcam; 1:250 anti-TDP-43, Abcam), secondary antibodies for 2 h at room temperature (1:500 to 1:1,000 goat anti-mouse or goat anti-rabbit IgG Alexa Fluor 647 from Invitrogen). Cells stained for stimulated emission depletion (STED) imaging were labeled with photostable fluorescent secondary antibodies from abberior (STAR 635P goat anti-rabbit and STAR 580 goat anti-mouse, 1:500 in PBS).
Images were acquired with a confocal laser-scanning microscope (LSM710; Carl Zeiss) with a Plan-Apochromat 63×/1.4 oil Ph3 objective. Superresolution imaging was performed with a 3D-STED microscope (Abberior Instruments) and a 100× oil objective (UPLANSAPO) or a TCS SP8 STED microscope (Leica) with a HC PL APO C2S 100× oil objective (1.4 N.A.) as described previously (31). Additional detail on STED imaging and image analysis with Fiji (32) is provided in SI Appendix.
smFISH.
Adult cardiomyocytes were fixed with 2% PFA for 10 min at room temperature followed by permeabilization with 70% ethanol overnight at 4 °C. After equilibration in washing buffer (10% formamide and 2× SSC) for 15 min at 37 °C, the hybridization was performed for 16 h at 37 °C with 100 nM of the probe diluted in 10% formamide and 8% dextran sulfate. Custom probe sets for smFISH labeled with CalFluor-610 and Quasar-570 were designed using Stellaris RNA FISH probe designer (Biosearch Technologies). Washing for 30 min at 37 °C was followed by DAPI staining (1:2,000 in washing buffer) for 10 min at 37 °C. For imaging, we used a wide-field microscope (Nikon Eclipse Ti) and a PlanApoλ 100× oil Ph3 objective. The samples were illuminated with the Prior Lumen 200 system and imaged with the filters for DAPI (excitation [Ex], 387/11; emission [Em], 447/60; beam splitter [BS], HC BS 409), GFP (Ex, 470/40; Em, 525/50; BS, T 495 LPXR), Quasar-570 (Ex, 534/20; Em, 572/28; BS, HC BS 552), and CalFluor-610 (Ex, 580/25; Em, 625/30; BS, T 600 LPXR), and the Andor DU888 camera. For each image, 21 z stacks with 0.3-µm steps were taken and processed with Fiji software (32). Additional detail is available in SI Appendix.
Isolation, Differentiation, and Cultivation of Primary Cells.
ES cells were isolated from blastocysts at E3.5 of pregnancy. After outgrowth of the inner cell mass, cells were picked and dissociated with accutase and cultivated on inactivated fibroblast. For differentiation into cardiomyocytes, the ES cells were dissociated and transferred to hanging drops. Resulting embryoid bodies were transferred on galantine-coated coverslips or ibidi dishes for analysis.
Embryonic cardiomyocytes were isolated at E13.5 as described previously (11). Adult cardiomyocytes were isolated from hearts of 8- to 12-wk-old mice using Collagenase Type II perfusion. Additional detail on tissue culture and myoseverin treatment is available in SI Appendix.
Fluorescence Recovery after Photobleaching.
FRAP experiments were performed as previously described (11) with the following modifications. Embryonic cardiomyocytes were isolated from homozygous titin-eGFP(M) and homozygous titin-dsRed(Z) animals. The experiments were performed on the DeltaVision Elite microscope with the 60× oil objective (N.A. 1.42). eGFP fluorescence was photobleached with a 488-nm laser at 25% intensity for 0.1 s and dsRed fluorescence with a 561-nm laser at 100% intensity for 0.25 s. The region of interest covered 2 sarcomeres, and the fluorescence recovery was followed over 14 h with imaging every 30 min for the first 2 h and then every hour. For each genotype, 5 experiments were performed (n = 5) with 3 cells per experiment. Fluorescence intensity was measured at the respective integration sites at up to 5 regions per cell. Normalized recovery curves were calculated as described previously and fitted with a 1-phase association curve using GraphPad Prism. From this curve, the exchange half-life was obtained as the time point where 50% of the maximal signal had returned. For cells with a biphasic recovery, we fitted a 2-phase association curve:
Additionally, the mobile fraction was calculated (11). FRAP data are represented as mean of the 5 individual experiments or as values obtained from a single cell.
Statistical Analysis.
For statistical analysis, we used GraphPad Prism 5.0. Results are expressed as mean ± SEM, and significance is indicated as follows: *P < 0.05, **P < 0.01, and ***P < 0.001. Differences between 2 groups were evaluated using t test (unpaired, 2-tailed) and between 3 and more groups with 1-way ANOVA. Two-way ANOVA was used, if groups were affected by 2 different factors. After ANOVA tests, we applied the Bonferroni posttest. Additional information for each experiment is provided in the respective figure legends.
Data Availability Statement.
All data discussed in the paper are available within the article text.
Supplementary Material
Acknowledgments
This work was funded by the FOR1352 of the German Research Foundation and by German Centre for Cardiovascular Research Project MD3-Nanopathology (to S.E.L.). We thank Anje Sporbert, Anca Margineanu, and the Microscope Core Facility from the Max Delbrück Center for support with the confocal and STED microscopes; Siegfried Labeit for the titin antibodies; and Dilan Cacan, Michaela Naschke, and Janine Fröhlich for expert technical assistance.
Footnotes
The authors declare no competing interest.
This article is a PNAS Direct Submission.
This article contains supporting information online at https://www.pnas.org/lookup/suppl/doi:10.1073/pnas.1904385116/-/DCSupplemental.
References
- 1.Ware J. S., et al. ; IMAC-2 and IPAC Investigators , Shared genetic predisposition in peripartum and dilated cardiomyopathies. N. Engl. J. Med. 374, 233–241 (2016). [DOI] [PMC free article] [PubMed] [Google Scholar]
- 2.Herman D. S., et al. , Truncations of titin causing dilated cardiomyopathy. N. Engl. J. Med. 366, 619–628 (2012). [DOI] [PMC free article] [PubMed] [Google Scholar]
- 3.Wang K., McClure J., Tu A., Titin: Major myofibrillar components of striated muscle. Proc. Natl. Acad. Sci. U.S.A. 76, 3698–3702 (1979). [DOI] [PMC free article] [PubMed] [Google Scholar]
- 4.Cazorla O., et al. , Differential expression of cardiac titin isoforms and modulation of cellular stiffness. Circ. Res. 86, 59–67 (2000). [DOI] [PubMed] [Google Scholar]
- 5.Guo W., et al. , RBM20, a gene for hereditary cardiomyopathy, regulates titin splicing. Nat. Med. 18, 766–773 (2012). [DOI] [PMC free article] [PubMed] [Google Scholar]
- 6.Li S., Guo W., Schmitt B. M., Greaser M. L., Comprehensive analysis of titin protein isoform and alternative splicing in normal and mutant rats. J. Cell. Biochem. 113, 1265–1273 (2012). [DOI] [PMC free article] [PubMed] [Google Scholar]
- 7.Jonkers I., Lis J. T., Getting up to speed with transcription elongation by RNA polymerase II. Nat. Rev. Mol. Cell Biol. 16, 167–177 (2015). [DOI] [PMC free article] [PubMed] [Google Scholar]
- 8.Gregorio C. C., et al. , The NH2 terminus of titin spans the Z-disc: Its interaction with a novel 19-kD ligand (T-cap) is required for sarcomeric integrity. J. Cell Biol. 143, 1013–1027 (1998). [DOI] [PMC free article] [PubMed] [Google Scholar]
- 9.Obermann W. M., Gautel M., Weber K., Fürst D. O., Molecular structure of the sarcomeric M band: Mapping of titin and myosin binding domains in myomesin and the identification of a potential regulatory phosphorylation site in myomesin. EMBO J. 16, 211–220 (1997). [DOI] [PMC free article] [PubMed] [Google Scholar]
- 10.Tonino P., et al. , The giant protein titin regulates the length of the striated muscle thick filament. Nat. Commun. 8, 1041 (2017). [DOI] [PMC free article] [PubMed] [Google Scholar]
- 11.da Silva Lopes K., Pietas A., Radke M. H., Gotthardt M., Titin visualization in real time reveals an unexpected level of mobility within and between sarcomeres. J. Cell Biol. 193, 785–798 (2011). [DOI] [PMC free article] [PubMed] [Google Scholar]
- 12.Rui Y., Bai J., Perrimon N., Sarcomere formation occurs by the assembly of multiple latent protein complexes. PLoS Genet. 6, e1001208 (2010). [DOI] [PMC free article] [PubMed] [Google Scholar]
- 13.Dlugosz A. A., Antin P. B., Nachmias V. T., Holtzer H., The relationship between stress fiber-like structures and nascent myofibrils in cultured cardiac myocytes. J. Cell Biol. 99, 2268–2278 (1984). [DOI] [PMC free article] [PubMed] [Google Scholar]
- 14.Schultheiss T., et al. , Differential distribution of subsets of myofibrillar proteins in cardiac nonstriated and striated myofibrils. J. Cell Biol. 110, 1159–1172 (1990). [DOI] [PMC free article] [PubMed] [Google Scholar]
- 15.Ojima K., et al. , Initiation and maturation of I-Z-I bodies in the growth tips of transfected myotubes. J. Cell Sci. 112, 4101–4112 (1999). [DOI] [PubMed] [Google Scholar]
- 16.Rhee D., Sanger J. M., Sanger J. W., The premyofibril: Evidence for its role in myofibrillogenesis. Cell Motil. Cytoskeleton 28, 1–24 (1994). [DOI] [PubMed] [Google Scholar]
- 17.Du A., Sanger J. M., Sanger J. W., Cardiac myofibrillogenesis inside intact embryonic hearts. Dev. Biol. 318, 236–246 (2008). [DOI] [PMC free article] [PubMed] [Google Scholar]
- 18.Fulton A. B., Alftine C., Organization of protein and mRNA for titin and other myofibril components during myofibrillogenesis in cultured chicken skeletal muscle. Cell Struct. Funct. 22, 51–58 (1997). [DOI] [PubMed] [Google Scholar]
- 19.Fan X., et al. , Dynamic alterations to α-actinin accompanying sarcomere disassembly and reassembly during cardiomyocyte mitosis. PLoS One 10, e0129176 (2015). [DOI] [PMC free article] [PubMed] [Google Scholar]
- 20.Vogler T. O., et al. , TDP-43 and RNA form amyloid-like myo-granules in regenerating muscle. Nature 563, 508–513 (2018). [DOI] [PMC free article] [PubMed] [Google Scholar]
- 21.Dabiri G. A., Turnacioglu K. K., Sanger J. M., Sanger J. W., Myofibrillogenesis visualized in living embryonic cardiomyocytes. Proc. Natl. Acad. Sci. U.S.A. 94, 9493–9498 (1997). [DOI] [PMC free article] [PubMed] [Google Scholar]
- 22.Du A., Sanger J. M., Linask K. K., Sanger J. W., Myofibrillogenesis in the first cardiomyocytes formed from isolated quail precardiac mesoderm. Dev. Biol. 257, 382–394 (2003). [DOI] [PubMed] [Google Scholar]
- 23.Ng D. C. H., Gebski B. L., Grounds M. D., Bogoyevitch M. A., Myoseverin disrupts sarcomeric organization in myocytes: An effect independent of microtubule assembly inhibition. Cell Motil. Cytoskeleton 65, 40–58 (2008). [DOI] [PubMed] [Google Scholar]
- 24.Bang M. L., et al. , The complete gene sequence of titin, expression of an unusual approximately 700-kDa titin isoform, and its interaction with obscurin identify a novel Z-line to I-band linking system. Circ. Res. 89, 1065–1072 (2001). [DOI] [PubMed] [Google Scholar]
- 25.Zou J., et al. , An internal promoter underlies the difference in disease severity between N- and C-terminal truncation mutations of titin in zebrafish. eLife 4, e09406 (2015). [DOI] [PMC free article] [PubMed] [Google Scholar]
- 26.Turnacioglu K. K., Mittal B., Dabiri G. A., Sanger J. M., Sanger J. W., An N-terminal fragment of titin coupled to green fluorescent protein localizes to the Z-bands in living muscle cells: Overexpression leads to myofibril disassembly. Mol. Biol. Cell 8, 705–717 (1997). [DOI] [PMC free article] [PubMed] [Google Scholar]
- 27.Ayoob J. C., Turnacioglu K. K., Mittal B., Sanger J. M., Sanger J. W., Targeting of cardiac muscle titin fragments to the Z-bands and dense bodies of living muscle and non-muscle cells. Cell Motil. Cytoskeleton 45, 67–82 (2000). [DOI] [PubMed] [Google Scholar]
- 28.Lange S., et al. , The kinase domain of titin controls muscle gene expression and protein turnover. Science 308, 1599–1603 (2005). [DOI] [PubMed] [Google Scholar]
- 29.Gotthardt M., et al. , Conditional expression of mutant M-line titins results in cardiomyopathy with altered sarcomere structure. J. Biol. Chem. 278, 6059–6065 (2003). [DOI] [PubMed] [Google Scholar]
- 30.Hinze F., Dieterich C., Radke M. H., Granzier H., Gotthardt M., Reducing RBM20 activity improves diastolic dysfunction and cardiac atrophy. J. Mol. Med. (Berl.) 94, 1349–1358 (2016). [DOI] [PMC free article] [PubMed] [Google Scholar]
- 31.Richter K. N., et al. , Glyoxal as an alternative fixative to formaldehyde in immunostaining and super-resolution microscopy. EMBO J. 37, 139–159 (2018). [DOI] [PMC free article] [PubMed] [Google Scholar]
- 32.Schindelin J., et al. , Fiji: An open-source platform for biological-image analysis. Nat. Methods 9, 676–682 (2012). [DOI] [PMC free article] [PubMed] [Google Scholar]
Associated Data
This section collects any data citations, data availability statements, or supplementary materials included in this article.
Supplementary Materials
Data Availability Statement
All data discussed in the paper are available within the article text.


