Abstract
Theory is presented for the analysis of excited-state reactions by fluorescence phase shift and demodulation methods. Initially, a two-state model with spectral overlap is considered to illustrate most simply the effects of excited-slate reactions on the expected phase and modulation values. Secondly, a multistate model is described to illustrate the probable effects of a fluorophore interacting with several solvent molecules. We note the following unique features of phase-modulation data expected from a fluorophore whose emission spectrum shifts during the lifetime of the excited state: (1) The modulation frequency dependence of the apparent phase (τp) and modulation (τm) lifetimes of the reacted species is opposite to that of a heterogeneous population of fluorophores. (2) For the reacted species τp > τm. For a heterogeneous sample τp < τm. (3) The phase angle of the reacted species can exceed 90°. For a heterogeneous sample phase angles are always less than 90°. Thus, phase and modulation measurements can distinguish between time-dependent processes and spectral heterogeneity by observation of any feature described above. Additionally: (4) The lifetime of the product species can be measured directly. (5) Reverse relaxation can be identified, and the reverse relaxation rates calculated. (6) The wavelength-dependent phase and modulation data can be used to resolve the individual spectra from a two-state reaction. (7) And finally, under favorable conditions, a two-state excited-state process can be distinguished from a continuous multiple-state process. In each instance, model calculations are presented to illustrate the unique potentials of phase-modulation fluorometry for investigations of excited-state processes.
Keywords: Fluorescence phase shift, Fluorescence demodulation, Excited-state process, Fluorophore
1. Introduction
The kinetics of excited state reactions are widely utilized to investigate the structural and dynamic properties of proteins and membranes. We note the following examples. Excimer formation in membranes has been used to estimate membrane microviscosity and the rates of lateral diffusion of lipids [1,2]. The rates of energy transfer between fluorophores have revealed distances between fluorophores and the distances of closest approach [3–5]. Gain or loss of protons by fluorophores in the excited state has revealed the accessibility of biopolymer-bound fluorophores to the solvent and the presence of nearby proton donors or acceptors [6,7]. And, finally, the rates of spectral relaxation of polarity-sensitive fluorophores have recently been used to estimate the relaxation rates of proteins and membranes around the excited-state dipole moments of fluorophores [8–12]. Such excited-state processes have been widely studied by pulse time-resolved methods [13–15]. In contrast, only a few reports describe the use of phase shift and demodulation methods to investigate excited-state processes [16–19]. One hindrance to the use of phase-modulation methods is the absence of a detailed theory. Here, we present theory and model calculations which describe the effects of excited-state processes on fluorescence phase shift and demodulation data.
Initially, a simple model is presented for a reversible two-state reaction in which the emission of the relaxed species (R) is shifted to longer wavelengths relative to the initially excited state (F). Also described are the effects of spectral overlap of F and R on the wavelength-dependent phase and modulation values, which are the experimentally observable quantities. A still simpler model, an irreversible reaction, is described in detail. Model calculations are presented which illustrate the interesting features and potentials of phase-modulation analysis of excited-state reactions.
In the two-state model described above we assume each state has wavelength-independent emissive and relaxation rates. This model may be inadequate to represent a fluorophore in a polar medium where there are several solvent-fluorophore interactions. A continuous relaxation model, such as that described by Bakhshiev et al. [16], may be more appropriate. In this model, it is assumed that the total decay of fluorescence intensity is wavelength independent but that the center of gravity of the spectral distribution shifts exponentially with time subsequent to excitation. To approximate the effects of multiple solvent-fluorophore interactions, we present a more general model in which the fluorescence spectrum shifts from the initial wave number νF to the final wave number νR by a series of smaller spectral shifts. This extension is not simply a mathematical exercise, but is necessitated by the complex nature of solvent relaxation around the excited states of fluorophores. The individual shifts may be visualized as being due to the interaction of the fluorophore with each of many polar solvent molecules [20]. Although not proven in this report, it has been demonstrated for the case of pulse fluorometry that this multistep model becomes equivalent to the continuous model as the number of states is increased [21].
The model calculations reveal a number of interesting predictions for both the two-state and the multiple-state model. Most of these predictions have in fact been observed in this laboratory and are described in the following paper [22]. For example, comparison of the two-state and the multiple-state models yields an interesting contrast. On the high wave number side of the spectrum the two-state model predicts a constant lifetime. In contrast, the multistate model predicts a lifetime which decreases continuously with increasing observation wave number. Depending upon the sample under investigation, both results have been observed in this laboratory and by others [10,23,24]. Thus, wavelength-dependent phase and modulation measurements should aid in determining the kinetics and complexity of excited-state processes for fluorophores in homogeneous solutions and for fluorophores which are bound to biopolymers.
2. Theory
2.1. Reversible one-step reactions
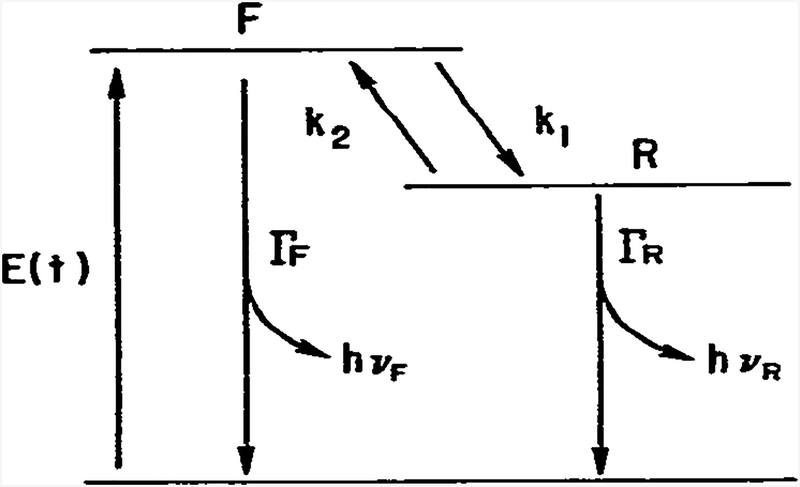
Consider the model shown in fig. 1. The initially excited Franck-Condon state F is assumed to decay to the ground state with a rate constant ΓF and by relaxation (k1) to a lower energy state R. The relaxed state R can decay to the ground state with a rate-constant ΓR or by the reverse reaction (k2). The decay rates (ΓF, and ΓR) contain both the rates of radiative decay (λF and λR) and the rates of nonradiative decay (kF and kR) to the ground state. For simplicity these individual decay rates are shown only in the combined form (ΓF = λF + kF, ΓR = λR + kR). Nonequivalence of the decay rates for F and R is a common occurrence for excited-state reactions [7,25]. Generally, we expect reverse relaxation to be less important. However, at increased temperatures fluorescence spectra shift to higher energies [20,26]. These shifts may indicate reverse relaxation, or alternatively prevention of solvent alignment with the excited-state dipole by thermal energy. The model in fig. 1 can be described by the following kinetic equations:
| (1) |
| (2) |
where F and R are the concentrations of fluorophore in each state and E(t) is the excitation pumping function. For sinusoidally modulated excitation the excitation pumping function can be written as
| (3) |
where ejωt = cos ωt + j sin ωt and . After the transient terms have decayed, the solutions must be of the form
| (4) |
| (5) |
where ϕF and ϕR are the respective phase shifts and mF = MF/M0 and mR = MR/M0 are the demodulation factors. Eqs. 4 and 5 can be substituted into eqs. 1 and 2 to obtain expressions containing either ejϕF or ejϕR. These expressions are
| (6) |
| (7) |
where γF = ΓF + k1 and γR = ΓR + k2. To derive these expressions we used the following relations for the time-independent terms
| (8) |
| (9) |
Eqs. 6 and 7 can be modified to take the form
| (10) |
or
| (11) |
Then the tangents and modulations of F and R may be obtained using
| (12) |
| (13) |
These expressions are listed in tables 1 and 2.
Fig. 1.
Energy-rate diagram for a two-state (one-step) reversible reaction.
Table 1.
Expressions for phase shifts for a two-state reaction
| Model | tan ϕF | tan ϕR | tan Δϕ |
|---|---|---|---|
|
k2 = 0 ΓF = ΓR |
ω/Γ | ||
|
k2 = 0 ΓF ≠ ΓR |
ω/ΓR | ||
|
k2 ≠ 0a ΓF ≠ ΓR |
ω/(ΓR + k2) |
The following definitions were used α = ΓF + ΓR + k1 + k2, β = ΓFΓR + ΓRk1 + ΓFk2, and γR = ΓR + k2.
Table 2.
Demodulation factors for a two-state reaction
| Model | mF | mR |
|---|---|---|
|
k2 = 0 ΓF = ΓR |
||
|
k2 = 0 ΓF ≠ ΓR |
||
|
k2 ≠ 0a ΓF ≠ ΓR |
See footnote to table 1.
2.2. Irreversible one-step reaction
For simplicity we first consider the irreversible reaction (k2 = 0) width equal decay rates (Γ = ΓR = ΓF). As an example, solvent relaxation around an excited-state dipole may result in a spectral shift without a substantial change in the decay rate. For this case we have
| (14) |
| (15) |
| (16) |
| (17) |
Several points are worthy of mention. Since we have initially assumed that F and R are separately observable, and the reverse reaction does not occur, the decay of F is a single exponential in the presence of relaxation. Hence, for the F state we find the usual expressions for calculation of lifetimes from phase and modulation data [27]. These expressions are
| (18) |
| (19) |
In the absence of relaxation the lifetime is τ0 = Γ−1. In the presence of relaxation the lifetime of F is shortened to τF = (Γ + k)−1, as described by eqs. 14 and 16. Thus, observed values of ϕF and mF can be used to calculate the true lifetimes of the unrelaxed state. In contrast, eqs. 18 and 19 Cannot be used directly with the observed phase (ϕR) and modulation (mR) values of the relaxed state, relative to the exciting light, to calculate the fluorescence lifetimes. However, phase (τP) and modulation (τm) lifetimes are reported directly by commercially available instrumentation, and these apparent values are easier to visualize than are phase angles and demodulation factors. For these reasons most of the model calculations will be described in terms of apparent phase and modulation lifetimes.
Examination of eq. 15 reveals important properties of ϕR. Let ϕ0 be the phase angle observed in the absence of relaxation, tan ϕ0 = ωτ0. Then using the law for the tangent of a sum we find tan(ϕF + ϕ0) = tan ϕR or
| (20) |
Hence, the phase angle of the relaxed state, relative to the excitation, is the sum of the phase angle of the unrelaxed state (ϕF) and the phase angle of the relaxed state if this state could be directly excited (ϕ0). This relationship may be understood intuitively by recognizing that in our simple model the F state is populating the R state. Another important property of ϕR is its ability to exceed 90° of phase shift. If ω2 exceeds Γ(Γ + k) then tan ϕR < 0 or ϕR > 90°. In contrast, the phase angles of directly excited species, or the angles resulting from a heterogeneous population of fluorophores, Cannot exceed 90° [24]. Hence, observation of phase angles in excess of 90° constitutes proof of an excited-state reaction.
It is important to note that the observable quantities are the phase angle (ϕ) and the demodulation factor (m). Using a phase fluorometer one can measure directly the difference in phase angle between the red and blue regions of the emission spectrum. This quantity, tan(ϕR − ϕF) = tan Δϕ, can be derived using the law for the tangent of a difference, and eqs. 14 and 15. One obtains
| (21) |
Hence, measurement of Δϕ reveals directly the intrinsic lifetime of the relaxed or reacted fluorophore, unaffected by relaxation processes. This result was described previously [24,38]. Initially, this ability appeared to be a unique advantage of phase fluorometric studies of excited-state reactions. However, we recently demonstrated that similar results could be obtained using pulsed time-resolved data [31]. In particular, we were able to directly measure the lifetime of the acridinium cation which formed subsequent to excitation. Instead of using the lamp pulse for deconvolution we used the decay of acridine observed on the blue edge of the emission. This differential wavelength deconvolution appears to facilitate the analysis of excited-state processes by time-resolved methods.
A further interesting aspect of this differential measurement is the potential of measuring the reverse reaction rate k2. Division of eq. 6 by eq. 7 yields
| (22) |
Rearrangement of this expression yields
| (23) |
| (24) |
These expressions are similar to the usual expressions for the dependence of phase shifts and demodulation factors on the depopulation rates of an excited state (eqs. 18 and 19) except that the depopulation rates are those for the reacted species (ΓR + k2). The initially excited state populates the relaxed state but the kinetic constants of the F state do not affect the measurement of tan(ϕR − ϕF) or mR/mF. Hence, measurement of either the phase or modulation of the relaxed state, relative to the unrelaxed state, yields a lifetime of the relaxed state. This lifetime is decreased by the reverse reaction. If the intrinsic emissive rate (ΓR) is known, k2 may be calculated. This result for Δϕ was originally described by Weber [28] and we recently utilized measurement of Δϕ to detect the reversible excited-state protonation of the naphtholate anion [39]. If the emission results from a single species which displays one lifetime, then ϕ and m are constant across the emission and ϕR − ϕF = 0 and mR/mF = 1. Furthermore, we note that both tan(ϕR − ϕF) and mR/mF are each independently measurable.
Returning to the irreversible model, we note from eq. 17 that the demodulation of the relaxed state (mR) is the product of the demodulation of the unrelaxed state (mF) and that due to emission alone (m0). That is
| (25) |
This multiplicative property of the demodulation factors and the additive property of the individual phase angles (eq. 20) are the origin of a reversed frequency dependence of the apparent phase shift and demodulation lifetimes, and the inversion of apparent phase and modulation lifetimes at a single frequency, when compared to a heterogeneous emitting population. Consider the apparent phase lifetime () as calculated from the measured phase (ϕR) of the relaxed state.
| (26) |
Recalling the law for the tangent of a sum we obtain
| (27) |
Because of the term ω2τpτ0 an increase in the modulation frequency can result in an increase in the apparent phase lifetime. This result is opposite to that observed for a heterogeneous emitting population where the individual species are excited directly. In the latter case au increase in frequency yields a decrease in the apparent lifetimes [27]. Hence, the frequency dependence of the apparent phase lifetimes can be used to differentiate the emission of a heterogeneous sample from the emission of the product of an excited-state reaction. Consider now the apparent modulation lifetime
| (28) |
Recalling eq. 21 we obtain
| (29) |
Again, increasing ω yields an increased apparent modulation lifetime. This frequency dependence is opposite to that resulting from a heterogeneous emission, and is useful in proving that an emission results from some excited-state process. However, in practice the dependence of upon modulation frequency is less dramatic than that of . We again stress that the calculated lifetimes are apparent and not true lifetimes. The information derived from phase-modulation fluorometry is best presented in terms of the observed quantities ϕ and m. For an exponential decay, as is expected for the unrelaxed state if relaxation is irreversible, mF = cos ϕF or m0 = cos ϕ0, in the presence or absence of relaxation, respectively. A convenient indicator of an excited state process is the ratio m/cos ϕ. This ratio is unity for a single exponential decay, and is less than one for a heterogeneous emission_ In contrast, m/cos ϕ > 1 if the emitting species forms subsequent to excitation, as pointed out originally by Veselova et al. [23]. Consider the relaxed state. Using eqs. 18 and 20, and the law for the cosine of a sum, we obtain
| (30) |
Dividing numerator and denominator by cos ϕ0, cos ϕF we obtain
| (31) |
If relaxation is much slower than emission, significant relaxation does not occur and the R state cannot be observed. If relaxation is much faster than emission, ϕF = 0 and mR/cos ϕR = 1. However, if relaxation and emission occur on comparable time scales the ratio mR/cos ϕR exceeds unity. Observation of m/cos ϕ > 1 proves the occurrence of an excited-state reaction.
2.3. Phase angles and demodulation factors for spectra which overlap
In the previous section, we assumed F and R were each separately observable by choice of the observation wavelength Assume now that F and R each have a spectral distribution, and that these spectra overlap. We ask how the observed phase angles and demodulation factors depend upon the relative contributions of F and R at a given wave number ν. In general, regardless of the complexity of the emission, and irrespective of heterogeneity or time-dependent processes, the total intensity at any given wave number ν can be described by a phase angle ϕ(ν) and demodulation factor m(ν). Hence
| (32) |
where I0(ν) is a time-independent spectral distribution and m(ν) = M(ν)/M0. For emission from n species
| (33) |
where ϕi is the phase angle of the i-th state and mi = Mi/M0 is the demodulation factor. At wave number ν, the fractional contribution of each state to the steady-state emission spectrum is given by
| (34) |
| (35) |
or
| (36) |
| (37) |
For the two-state model
| (38) |
| (39) |
where
| (40) |
Eqs. 38 and 39 readily yield the desired expressions for the wave number-dependent phase angles and demodulation factors [29].
| (41) |
| (42) |
It is instructive to stress again the meaning of the terms described above. For overlapping spectra, the phase angles ϕ(ν) and demodulation factors m(ν) are dependent on the fractional contributions of each state to the total intensity at the observation frequency. For the two-state model, the phases and demodulation factors of the F and R states are dependent only on Γi, ki and ω. Hence, we expect characteristic values (eqs. 14–17 and tables 1 and 2) to be observed on the blue and red edges of the emission, irrespective of the extent of overlap. This is not the case for a continuous model [23], in which the spectrum shifts continuously with time. In this case, the fluorometric parameters ϕ and m may not reach limiting values on the blue and red edges of the spectrum. Since the resolution and sensitivity of all experiments are limited, the two-state and continuous-relaxation models may not be distinguishable where the emission shows significant spectral overlap.
A heterogeneous sample in which two species with different lifetimes are excited directly can be described by equations similar to eqs. 38 and 39. The factors mF and mR are replaced by the terms cos ϕF and cos ϕR. Hence
| (43) |
| (44) |
2.4. Resolution of unrelaxed and relaxed emission spectra from ϕ(v) and m(v)
Examination of eqs. 38 and 39 suggests that m(ν) and ϕ(ν) could be used to recover αF(ν) and αR(ν). These fractional intensities, in conjunction with the emission spectrum, allow calculation of I0R(ν) and I0F(ν) from the phase and demodulation spectra of the emission. Application of Cramer’s rule to obtain αR(ν) and αF(ν), and the law for the sine of a difference between two angles, yields
| (45) |
and
| (46) |
The individual spectra can then be obtained from the steady-state emission spectra
| (47) |
| (48) |
Eqs. 45 and 46 have been described previously by Veselova et al. [23]. We note that these expressions would also be applicable to a heterogeneous emission where R is formed by direct excitation rather than relaxation. Alternative forms of eqs. 45 and 46 may be derived from eqs. 38 and 39 by noting αF(ν) + αR(ν) = 1.
| (49) |
| (50) |
Resolution of states requires knowledge of ϕ and m for both states. In favorable circumstances, these may be obtained from measurements on the high or low wave number regions of the emission where a single species dominates the emission. Alternatively, control experiments in the absence or presence of any reaction may be adequate.
2.5. Model calculations for the two-state reaction
Before proceeding with the more complex multiple-step model, it is instructive to consider the expected phase and modulation data for an irreversible two-state reaction. To illustrate the expected data we assumed the spectra were described by Gaussian distributions
| (51) |
where fi is the relative quantum yield and σi the standard deviation of the i-th distribution. At any given wave number, the fractional contributions of the unrelaxed (αF(ν)) and relaxed (αR(ν)) states are given by eq. 40. The relative quantum yields are
| (52) |
| (53) |
For simplicity, we have again ignored the rates of nonradiative decay. The F and R states were assumed to have emission maxima of 25 kK * (400 nm) and 20 kK (500 nm), respectively. The widths (σi) of each spectrum were assumed to be equal to 2.5 kK, which corresponds to a full-width at half-height of about 100 nm. In addition, we assumed Γ = 2 × 10⁸ s−1 or τ0 = 5 ns. These assumed parameters are comparable with those observed for solvent-sensitive fluorophores and were chosen to illustrate the data expected for fluorophores where the F and R states display significant spectral overlap. For example, the lifetime of 2-(p-toluidinyl)-6-naphthalenesulfonic acid (TNS) is near 8 ns in glycerol, and vitrification of the solvent shifts the emission maximum from 450 to 395 nm [11]. 6-Propionyl-2-dimethylaminonaphthalene (PRODAN) is more sensitive to solvent than is TNS. Increasing solvent polarity results in a shift of the emission maximum from 400 to 530 nm. The lifetime of PRODAN is about 3 ns [30].
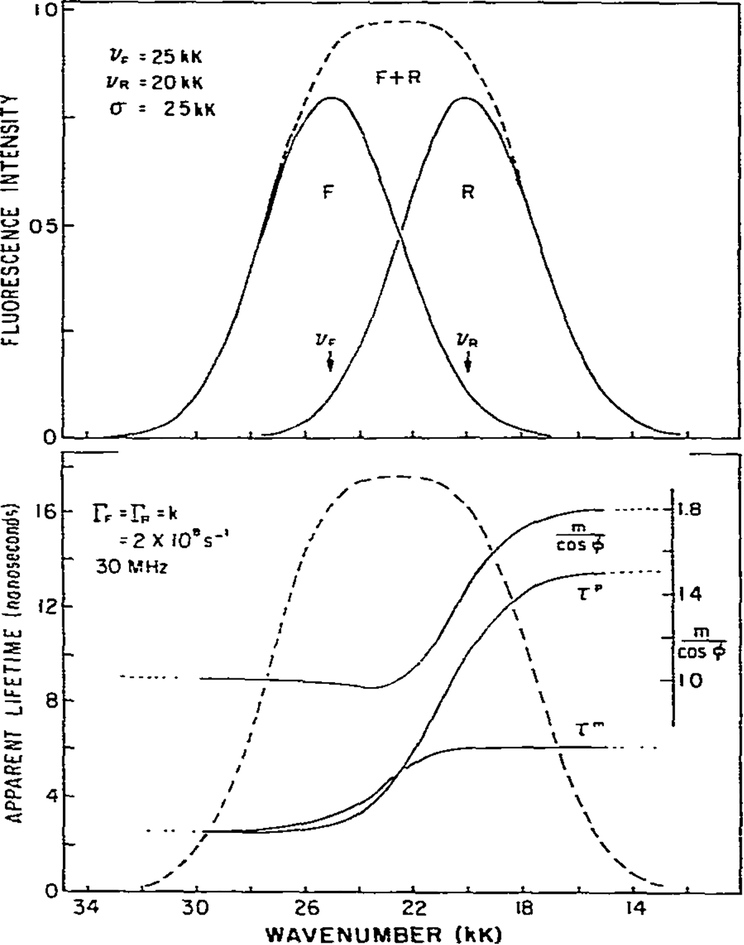
To illustrate the effects of solvent relaxation on the apparent phase and modulation lifetimes we assumed the decay and relaxation rates to be equal; i-e., Γ = k (fig. 2). This situation is comparable to that encountered in viscous solvents. Several features of these simulated data are worthy of discussion.
Fig. 2.
Theoretical calculation of apparent phase and modulation lifetimes and m/cos ϕ for an excited-state process. The assumed parameters are shown on the figure.
(1) A characteristic of an excited-state reaction is the decreased apparent lifetime on the high wave number side of the emission. In the absence of relaxation the lifetime would be 5 ns. Relaxation is an additional rate process competing with emission and results in a decrease of the lifetime to 2.5 ns (eq. 14). As discussed earlier, for an irreversible two-state reaction the phase and modulation values yield actual lifetimes for the unrelaxed state. If relaxation were much more rapid than emission then only the relaxed state, and its characteristic lifetime, would be observed.
(2) At the high and low wave number regions of the spectrum the apparent phase and modulation lifetimes approach constant values. This occurs because one species dominates the emission on each side of the spectrum. In the two-state model this result will always be obtained, but in practice may not be observable if spectral overlap is more pronounced (see fig. 7 and the related discussion). The dotted lines in figs. 2–7 indicate those regions where the intensity is 10% or less of the maximum intensity. Experimental data are less reliable in these spectral regions.
Fig. 7.
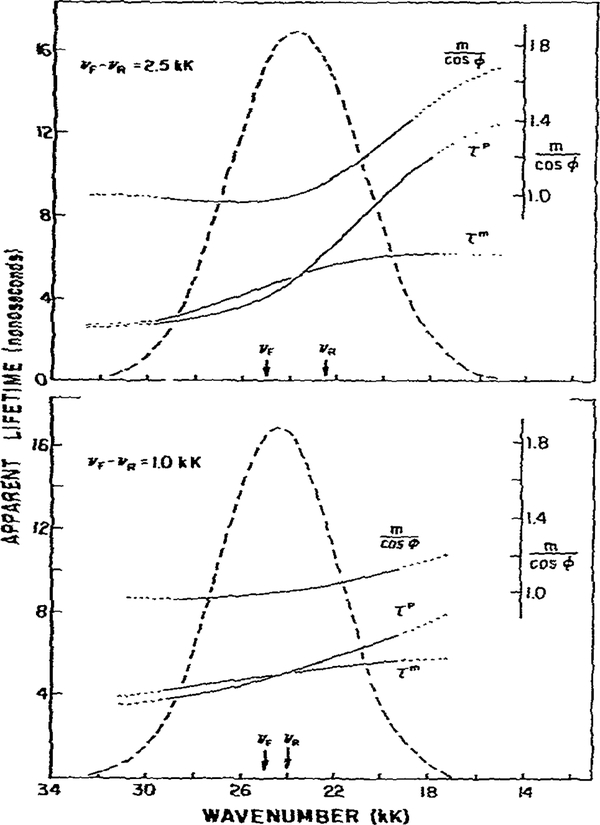
Effect of spectral overlap on m/cos ϕ and on the apparent phase and modulation lifetimes. The central frequency of the directly excited state was 25 kK. For the relaxed state these values were assumed to be 22.5 kK (top) and 24 kK (bottom). Hence, the spectral shifts were 2.5 and 1.0 kK, respectively. All other parameters are the same as in fig. 2.
(3) An important feature of phase-modulation data for an excited-state process is the prediction of apparent phase lifetimes which are larger than the modulation lifetimes on the low wave number side of the emission. In this spectral region the emission results from molecules in the R state which formed subsequent to excitation from molecules excited into the F state. τp > τm cannot be a result of a heterogeneous emitting population [27] and observation of τp > τm proves that an excited-state process occurred to yield the emission. Such observations have been made for fluorophores in viscous solvents, and for fluorophores bound to membranes and proteins [10,11].
Using this simple irreversible two-state model we can make two additional predictions. On the high wave number side of the emission we expect τp = τm, as predicted by eqs. 14 and 16. In addition, the phase-modulation data reveal heterogeneity (τp < τm) in the central wave number region where emission results from both species. Both predictions were observed for the excited-state protonation of acridine [22].
As emphasized above, except for the short-wavelength region, the apparent phase and modulation lifetimes are not true lifetimes. In some instances it may be preferable to present the observed quantities, ϕ(ν) and m(ν), rather than the interpretations of these values, τp and τm. The use of ϕ(ν) and m(ν) is especially useful for identifying an excited-state process. As shown by eq. 31 the ratio m/cos ϕ will exceed unity for emission resulting from the product of our excited-state process. Where the emission is homogeneous, on the short-wavelength side, m/cos ϕ = 1 (fig. 2). As the wave number is decreased we find m/cos ϕ < 1. which is indicative of a heterogeneous emission. On the low energy side of the emission we find m/cos ϕ > 1. Hence, the ratio m/cos ϕ provides a sensitive indicator of the nature of the emission, and has the advantage of being a ratio of observable quantities.
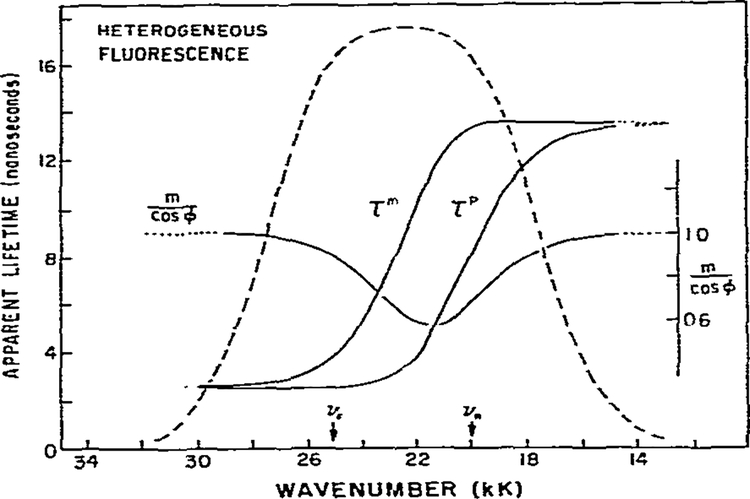
In fig. 3 we present the ϕ(ν) and m(ν) values expected for a heterogeneous emitting population. These results are to be compared with fig. 2, which presents these same quantities for an excited-state process. The comparison is somewhat arbitrary, since it was necessary to select the intrinsic lifetimes of the F and R state. We chose τF = (Γ + k1)−1 = 2.5 ns, which is identical with the τF = value in fig. 2. For the lifetime of the R state, directly excited in this instance, we chose τr = ω−1 tan ϕR, where ϕR is identical to the phase angle of the relaxed state from fig. 2. Our purpose for this choice was to have the model calculations comparable to the experimental situation where ϕF and ϕR were observed without prior knowledge of the origin of the multiple emissions. In contrast to the excited-state reaction, the heterogeneous model yields τp = τm and m/cos ϕ = 1 on both the high and low wave number regions of the emission where spectral overlap is minimal. In the overlap region τp < τm and m/cos ϕ < 1. Thus, distinct wave number profiles of ϕ(ν) and m(ν) allow one to infer whether relaxation or heterogeneity is the cause of wave number-dependent phase and modulation lifetimes.
Fig. 3.
Calculated values of τp, τm and m/cos ϕ for a heterogeneous sample. The lifetimes of the directly excited species were assumed lo be τF = 2.5 ns and τR = 13.5 ns. These values can be calculated using eqs. 14 and 15, and the parameters in fig. 2.
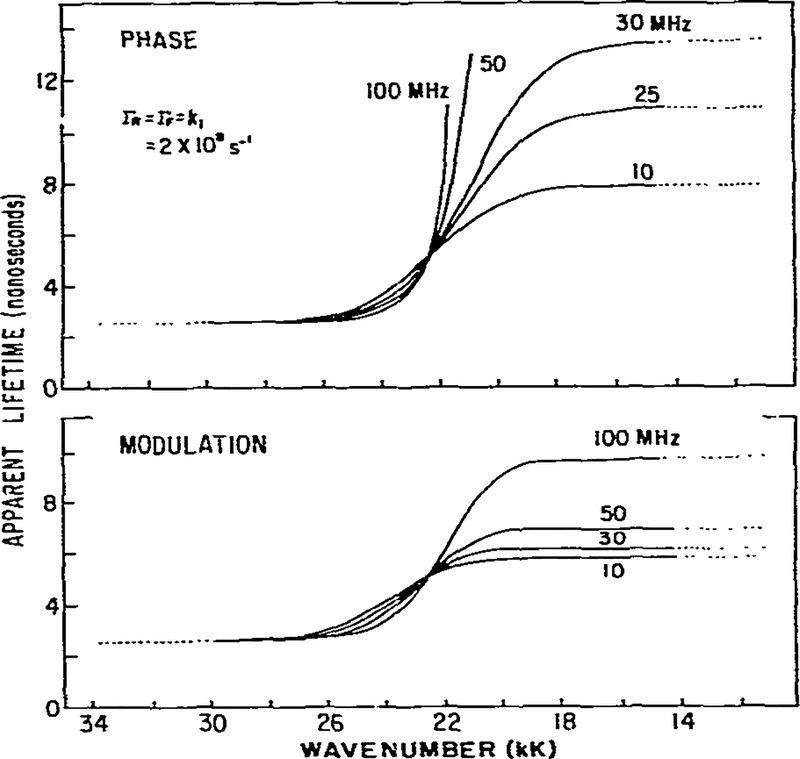
For excited-state processes ϕ(ν) and m(ν) are highly dependent upon modulation frequency, and this dependence should aid in the analysis of such reactions. We modeled the frequency dependence using the same parameters as were used in fig. 2 (fig. 4). For this irreversible reaction τp = τm in the high wave number region of the emission, irrespective of modulation frequency. Again, heterogeneity is revealed in the overlap region. The most striking feature of the frequency dependence is the increase in both τp and τm with modulation frequency in the low wave number region of the spectrum. These increases were predicted by eqs. 27 and 29. Clearly, the τp values are more sensitive to modulation frequency than are the τm values. Although not shown, a heterogeneous emitting population would display decreases in τp and τm with increasing modulation frequency, i.e., an opposite dependence upon modulation frequency. Hence, the modulation frequency dependence of τp and τm can reveal the occurrence of an excited-state reaction. Although not shown, the modulation frequency dependence of m/cos ϕ is also opposite for excited-state processes and heterogeneous emissions. Increased modulation frequencies result in increased values of m/cos ϕ for the product of a reaction. However, we note that at low modulation frequencies m/cos ϕ can be close to unity even in the presence of significant relaxation and the failure to observe m/cos ϕ > 1 does not prove that a reaction has not occurred if the modulation frequency is too small.
Fig. 4.
Frequency dependence of the apparent phase and modulation lifetimes for an excited-state process. The frequency dependence is opposite to that expected for a heterogeneous population. The assumed parameters are given in fig. 2.
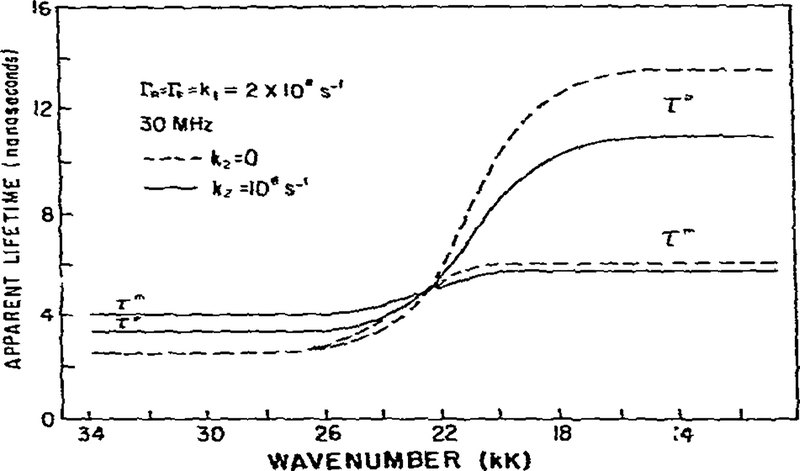
In the model calculations discussed above we assumed the reverse reaction (k2) did not occur. In fig. 5 we compare the expected phase and modulation lifetimes with k2 = 0 and with k2 = 108 s−1, which is equal to one-half of the assumed decay and relaxation rates. Reverse reaction can yield several interesting and observable effects. On the high wave number side of the emission the increased rate of. reverse reaction results in increased apparent phase and modulation lifetimes. In addition, these lifetimes become heterogeneous, with τm being more sensitive than τp. A comparison of these results with the irreversible model (fig. 2) reveals an important contrast. If the reaction is irreversible, τm = τp for the F state. This nonequivalence suggests that τp and τm on the blue edge of the emission can be used to test for reverse relaxation. A similar distinction between reversible and irreversible reaction was found for pulsed time-resolved fluorescence data [32]. Ir. this instance an irreversible reaction results in a single-exponential decay of F. Significant reverse reaction results in a double-exponential decay of the F state. On the low wave number side of the spectrum, reverse reaction decreases the apparent lifetimes and can eliminate phase shifts which are in excess of 90°.
Fig. 5.
Effect of reverse relaxation of the apparent phase and modulation lifetimes. See fig. 2 for additional details.
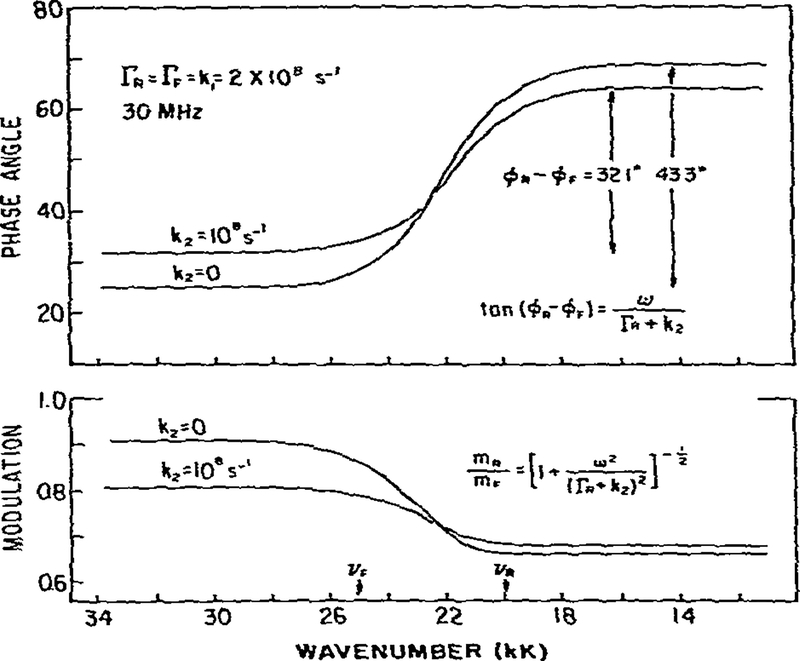
An advantage of phase-modulation measurements is the ability to directly measure the properties of the species formed subsequent to excitation. This ability originates from the instrumental capability of measuring directly the phase difference and demodulation between any two regions of the emission. We illustrate this potential in fig. 6, where we present the phase angles and demodulation factors assuming the same parameters as for the reversible reaction described above (fig. 5). If measured directly, the phase angle between the F and R states would be 43° for k2 = 0 and 32.1° for k2 = 108 s−1. These phase angles correspond to lifetimes of 5 and 3.33 ns, respectively (eq. 18), which are the values expected from τR = (ΓR + k2)−1. Similarly, the directly observed demodulation factors between the F and R states would be 0.73 and 0.85 for k2 = 0 and k2 = 108, respectively Again these correspond to lifetimes of the R state of 5 and 3.33 ns (eq. 19) As indicated by eqs. 23 and 24, measurement of tan(ϕR − ϕF) or mR/mF yields the intrinsic lifetime of the R state, modified by the rate of reverse relaxation.
Fig.6.
Fffect of reverse relaxation on the measured phase angles and demodulation factors. See fig. 5 for additional details.
In a later section we present a more complex multiple-step model. When these steps are irreversible, measurement of the phase difference or demodulation between any two adjacent states reveals the intrinsic lifetime of the lower energy state (eq. 60). This general result is found because the higher energy state is the source of molecules in the next lower state, just as the exciting light is the source of molecules in the highest energy state.
In all the above modeling we chose a 5 kK separation between the F and R states. This choice resulted in easily recognized regions where the phase and modulation lifetimes were constant. Frequently, the spectral shifts between F and R will be smaller. Thus, we examined the effects of smaller shifts on the predicted values of τP, τm and m/cos ϕ (fig. 7). The energy losses due to relaxation were decreased to 2.5 kK (top) and 1.0 kK (bottom). The dotted lines indicate those regions of the emission when the emission intensities are less than 10% of the peak intensities. Reliable data are difficult to obtain in these regions, and the likely observable data are indicated by solid lines. As the energy loss due to relaxation is decreased, constant values of τP, τm and m/cos ϕ become less apparent. Nonetheless, m/cos ϕ > 1 is still observed. In instances of small relaxation losses, it will become difficult to distinguish between the two-state model and the more complex multiple-state model which we describe below.
2.6. Multiple-step relaxation model
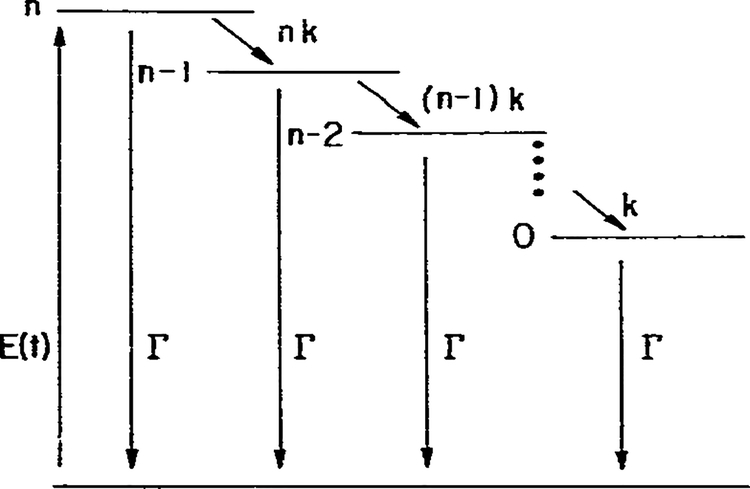
Consider the n-step model shown in fig. 8. For simplicity, we assumed that each relaxation step results in an equivalent energy loss equal to hc(νF − νR)/n and that the reverse reaction does not occur. In addition, we assumed that the rate of relaxation decreases as the extent of relaxation approaches completion. In particular, the rate of relaxation of the q-th state is given by kq = qk, q = 1,…,n, where k is a constant and n the number of steps. There are n + 1 energy levels. In the limit of large n these assumptions result in an exponential decay of the emission spectrum from νF to νR with a rate constant k [21], which is the model for solvent relaxation of Bakhshiev et al. [16]. One may imagine that n is the number of solvent molecules surrounding the fluorphore and q is the number which are not aligned with the dipole moment of the excited fluorophore. Let Nq, represent the number of excited fluorophores in the q-th state. These populations obey the following equations,
| (54) |
The excitation pumping function E(t) is given by eq. 3 and the individual populations are given by
| (55) |
where mq = Mq/M0.
Fig. 8.
Energy-rate diagram for an n-step relaxation.
Let ϕq be the phase angle of the q-th state relative to the exciting light and be the phase angle of this state which would be observed if it could be excited directly. From the discussion of the one-step model it follows that
| (56) |
| (57) |
The solutions to eq. 54 can be obtained in a manner similar to that used to derive eqs. 14–17. We obtain
| (58) |
Analysis of these equations using eqs. 10–12 results in
| (59) |
| (60) |
One can readily see the similarities of the n-step model to the one-step model. The phase angle and demodulation factor of the initially excited state (n) are given by the usual expressions for an exponential decay with a total depopulation rate of nk + Γ. The demodulation of the q-th state relative to the exciting light is the product of the demodulation factors of all states leading to and including q (eq. 59). Similarly, the phase angle of the q-th state relative to the exciting light is the sum of the phase angles of all states leading to q, plus its intrinsic phase angle (eq. 60). Hence, the additivity of the individual phase angles and the multiplicative properties of the individual demodulation factors are general properties of an irreversible n-state model.
From eqs. 59 and 60, or alternatively by division of any two sequential equations in eq. 58, we notice
| (61) |
| (62) |
Hence, the phase shift of any state q, measured relative to the next higher state q + 1, reveals the intrinsic lifetime of the q-th state. These results are analogous to those obtained for the irreversible one-step model (eqs. 23 and 24).
Consider a two-step model. The explicit equations are
| (63) |
| (64) |
Now consider measurement of the phase shift and demodulation factor of the red side (0) of the emission relative to the blue side (2). The observed ratio of m/cos ϕ will be
| (65) |
Of course this expression is analogous to eq. 30, with the important exception that the measurement of m/cos ϕ is relative to the blue edge of the spectrum rather than the exciting light. The physical significance of this is as follows. If the low energy emission is derived directly from the high energy emission then m/cos ϕ = 1, since the latter emission is the exciting function. However, if an intermediate state exists between the blue and red sides of the emission then an excited state process must occur to produce the red emission and m/cos ϕ > 1. Thus, a ratio m/cos ϕ > 1, when measured relative to the blue side of the emission, can prove an excited-state process is more complex than a one-step process. However, the number of steps is likely to be elusive.
2.7. Theoretical calculations for the irreversible n-state model
We also performed model calculations for phase-modulation measurements in the presence of an n-step relaxation. Steady-state solution of the kinetic equations yields the relative quantum yield fq of each state
| (66) |
Gaussian distributions (eq. 51) were again assumed for the individual spectral distributions. The fractional intensities at any given wave number are then given by eq. 34. Phase angles and demodulation factors can be calculated from eqs. 41 and 42 using
| (67) |
| (68) |
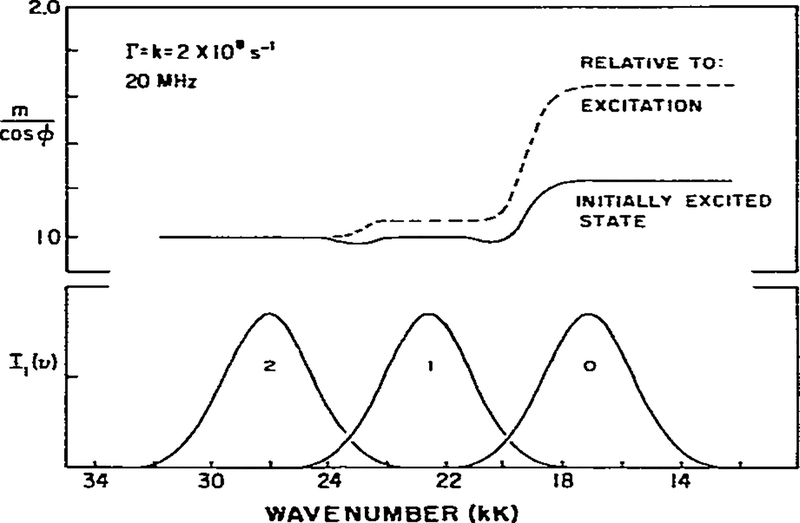
In fig. 9 we show model calculations for a two-step reaction. As discussed above (eq. 65), one can use the phase difference and demodulation factor between the high and low wave number regions of the spectrum to prove that spectral relaxation requires more than a single step. The spectral widths of the individual spectra were adjusted so that the m/cos ϕ values of each state were clearly visible. In particular, m/cos ϕ values are shown relative to the exciting light (dashed line) and relative to the initially excited state (unbroken line). If one observes m/cos ϕ relative to the initially excited state, and if this ratio exceeds unity, then the spectral relaxation must be a result of more than a single-step process. Clearly, if there were only a single-step relaxation then the lowest energy state (0) would not be observable, and m/cos ϕ, relative to the initially excited state, would be unity.
Fig. 9.
Calculated values of m/cos ϕ for a two-step model. The assumed values for v00, v01, and v02 were 17, 22.5 and 28 kK. Respectively. All σi were assumed to be equal to 1.5 kK.
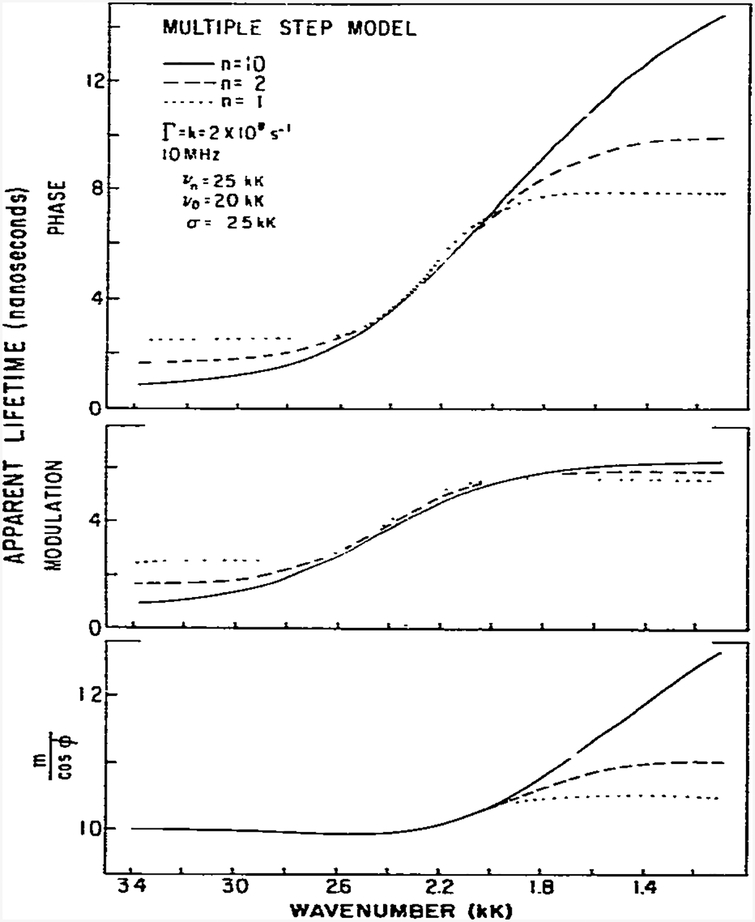
We examined the expected effects of the number of steps on the apparent phase and modulation lifetimes and on the ratio m/cos ϕ (fig. 10). We assumed a modulation frequency of 10 rather than 30 MHz because at 30 MHz the phase angle exceeds 90° for n > 1. The τp values (top) on the low wave number side of the spectra are highly dependent upon n, as is the ratio m/cos ϕ (bottom). The apparent modulation lifetimes are less sensitive to n (middle). The most obvious effect of an increase in the number of steps is the appearance of phase lifetimes which decrease and increase continuously as the wave number increases and decreases, respectively. More specifically, for a one-step reaction τP is constant on the blue side of the emission. In contrast, as the number of steps is increased τp approaches zero in this spectral region (eq. 56). Such behavior may be regarded as characteristic of a multistep or continuous-relaxation process, and thus the wave number-dependent phase angles can be used to distinguish between the one-step and the continuous relaxation models. Perhaps the differential dependence of τp and τn upon modulation frequency and n can be used to indicate the number of significant fluorophore-solvent interactions. However, one will certainly need to reduce the number of variable parameters by obtaining more detailed information on the spectral distributions of the fluorophore in question. More detailed model calculations are required to clarify this point.
Fig. 10.
Effect of the number of steps on the apparent phase and modulation lifetimes and m/cos ϕ.
Inthis laboratory we have noticed that for some fluorophores the apparent lifetimes decrease with increasing wave number on the blue side of the emission. In other cases these lifetimes appear to reach constant values. These phenomena were observed for TNS in glycerol and PRODAN in butanol, respectively [10]. More detailed data and discussion are presented in the following paper [22]. Similar observations were apparent on the blue side of the emission (fig. 10) showing that as n increases these lifetimes approach zero. In fact, Veselova et al. [23] claim that for the continuous model these limiting values must be zero, as can be judged by eqs. 56 and 57. Hence, in favorable circumstances one can use the wave number dependence of the lifetimes to judge whether spectral relaxation is a one-step or a multistep process.
From all the model calculations presented above it is apparent that the information which can be derived is dependent upon the modulation frequency. More properly, the critical factor is the frequency-lifetime product. Thus, the power of phase-modulation methods for analysis of excited-state processes will be increased greatly using variable frequency modulation.
3. Discussion
In the preceding sections we showed the theory and expected results of phase-modulation measurements on fluorophores which undergo excited-state reactions. Essentially all the predicted results have been observed, and these are described in the following paper [22]. In combination, these two reports reveal the potential and practical usefulness of phase-modulation measurements of excited-state processes. We now wish to compare the general features of pulse and phase-modulation data for samples which display time-dependent spectral shifts and to describe a novel method of analyzing pulsed time-resolved data which became apparent as we developed the phase-modulation theory.
In tables 1 and 2 we listed the expressions for differential-wavelength phase (Δϕ) and modulation (mRF = mR/mF) measurements. It is apparent that measurements of Δϕ and mRF reveal the intrinsic properties of the relaxed state. This result is obtained because the R state is populated via the F state, and this general result was also obtained for the n-step model (eqs. 61 and 62) Upon reflection it became intuitively obvious that the same principle can be applied to time-resolved data. For example, deconvolution of the time-resolved data obtained for R with the time-resolved data obtained for F will reveal the intrinsic lifetime of R, or more correctly, the impulse response of the R state (IR(t)). It appears that differential wavelength deconvolution can result in considerable simplification of the derived impulse response function, and thus an increased ability to successfully analyze complex decays. For example, for the reversible or irreversible one-step model, deconvolution of IR(t) with the lamp response results in a double-exponential decay. In contrast, it can be shown that deconvolution with IF(t), irrespective of its single- or double-exponential character, results in a single exponential with a decay rate of ΓR + k2. More significant simplication can result for the irreversible two-step model. In this case, deconvolution of the time-resolved data for a relaxed state with the time-resolved data for the next higher energy state results directly in the intrinsic lifetime of the observed relaxed state. This result is formally equivalent to eqs. 61 and 62 which describe a similar result using either phase or modulation measurements.
Differential-wavelength deconvolution also simplifies the calculation of the emission spectra of the initially excited and the relaxed states from the time-resolved data. As is described below, this calculation is difficult when the data are deconvoluted relative to the exciting pulse. In contrast, the fractional intensities of the F and R states are revealed directly by differential-wavelength deconvolution. The former appears as a component with a zero lifetime and the latter as a component with a single lifetime which is equal to the intrinsic lifetime of the directly excited relaxed species. We note that these concepts were confirmed by experiments [31].
Assuming the F and R states can be observed on the blue and red edges of the emission, the pulse and phase-modulation methods differ in the resolution of individual spectra from the wavelength-dependent data. Eqs. 45–50 can be used to calculate the individual emission spectra from the wavelength-dependent phase and modulation data. These equations apply to both reversible and irreversible excited-state reactions. As examples of such reactions, we note that the excited-state protonation of acridine is essentially irreversible [7,22] and excited-state proton loss by 2-naphthol is readily reversible [32]. In addition, these equations also apply to samples which show simple ground-state heterogeneity, i.e., a mixture of two species which each show a single-exponential decay. Of course, one must be able to observe the properties of the individual species by selection of the appropriate wavelengths. Hence, eqs. 45–50 are generally applicable to a variety of experimental situations.
The situation is somewhat more complicated for the time-resolved data. For simple ground-state heterogeneity one can calculate the individual spectra (Fi(λ)) from
| (69) |
where F(λ) is the steady-state emission spectrum [33,34] and the time-resolved decay is described by
| (70) |
Eqs. 69 and 70 apply irrespective of the extent of spectral overlap. It is assumed that τ1 and τ2 are independent of wavelength, and of course one must be able to assign these lifetimes to the species of interest. Eq. 69 cannot be applied to excited-state reactions, as may be concluded from the following considerations. Assume a reaction is reversible and that the F state can be selectively observed on the blue side of the emission. For a reversible reaction the decay of F will be doubly exponential [32], and hence the fractional intensity term in eq. 69 will be less than one, even though this emission is due only to the F state. If the reaction is reversible the decay of R will be double exponential at all wavelengths and again eq. 69 cannot be used. Hence, more complex procedures are required to calculate the individual spectra under these circumstances. Such procedures may shortly become available (ref. 35 and Knutson and Brand, personal communication), but for the present such procedures are not generally available. We note that the method of differential-wavelength deconvolution described above allows for a simple decomposition of time-resolved data to reveal the spectra of the unrelaxed and relaxed states.
It is informative to describe in detail the wavelength-dependent data expected from samples which undergo excited-state reactions. Consider first the two-state reaction. On the blue edge of the emission, if this emission was only from the initially excited state, we noted that τp = τm for a irreversible reaction and that τ = (ΓF + k1)−1. If the reaction were reversible then τp < τm. Analysis of time-resolved data yielded an analogous result [32]. For the irreversible reaction the decay of F is a single exponential with τ = (ΓF + k1)−1. If the reaction is reversible then the decay of F is doubly exponential and these lifetimes are complex functions of all the rate constants. It is apparent that both pulse and phase-modulation methods can discriminate between a reversible and an irreversible reaction from the data obtained on the blue side of the emission. However, evaluation of these data to obtain all the rate constants for a reversible reaction is complex, as may be judged by the expression listed in tables 1 and 2. The methods of differential-wavelength deconvolution and phase-modulation measurements of the F versus the R states appear to provide significant simplications. As may be observed from tables 1 and 2, measurement of Δϕ or mR/mF allows ΓR and k2 to be determined, and these values can be used in the further analysis of ΓF and mF.
It is interesting to note that the inability of obtaining directly the individual decay times by phase measurements alone at a single frequency is not without its benefit. The inability to use phase measurements alone results from the nature of the phase-shift experiment. Irrespective of the complexity of the decay law the emission at any wavelength displays only a single phase angle. This angle can be a complex function of the relative intensities and the lifetimes of each state. For example, consider the reversible one-step reaction. Even though the time-resolved decay of each species is doubly exponential, each species displays a unique phase angle. This fact allows direct recording of the emission spectrum of each species by phase-sensitive detection of fluorescence [36,37].
Such direct recording of the individual emission spectra is possible for both the case of ground-state heterogeneity and for excited-state reactions. The occurrence of a single phase angle for the emission of each species, irrespective of the origin of the emission, allows the detector to be out of phase with each species. The emission of this species is suppressed and the spectrum of the other species can be recorded directly. Such spectra can be collected in times comparable to that required to collect a steady-state emission spectrum, and these phase-sensitive spectra have comparable signal-to-noise ratios. The ability to obtain phase-sensitive spectra at two phase angles, which sum to yield the steady-state spectra, proves that a sample displays two wavelength-independent lifetimes.
On the red edge of the emission the fluorescence intensity is frequently dominated by the emission from the relaxed or reacted species. Then, the time-resolved intensity is described by a doubly exponential decay with equal and opposite preexponential factors, regardless of whether the reaction is reversible or irreversible. Spectral overlap of emission from the F state with the R state results in nonequal preexponential factors. Equivalent and opposite preexponential factor prove that emission from F does not make a significant contribution. Irrespective of the equivalence or nonequivalence of these factors, observation of a significant exponential term with a negative preexponential factor proves that an excited-state process has occurred. Failure to observe this negative term does not prove a reaction has not occurred [9].
Similar conclusions may be obtained from measurements of m/cos ϕ. If an excited-state process has occurred to yield emission at a given wavelength then m/cos ϕ can be calculated from eq. 31. Spectral overlap of the F emission at long wavelength can decrease the magnitude of the measured value of m/cos ϕ. Heterogeneity of the emission can have a similar effect. As for the negative preexponential factor, observation of m/cos ϕ > 1 proves an excited-state process has occurred. However, failure to observe m/cos ϕ > 1 does not prove an excited-state process has not occurred. Thus, pulse and phase-modulation methods provide comparable information on the existence of an excited-state process.
In conclusion, both pulse and phase-modulation measurements can provide detailed information on excited-state processes. In the previous sections we attempted to summarize the complementary nature of these experimental protocols, and to explain how similar information appears in different manner, depending upon the method employed.
Acknowledgements
This work was supported by Grant PCM 80-41320 from the National Science Foundation. J.R.L. is an Established Investigator of the American Heart Association. A.B. is on leave from Nicholas Copernicus University, Institute of Physics, Torun, Poland.
References
- 1.Vanderkooi JM and Callis JB, Biochemistry 13 (1974) 4000. [DOI] [PubMed] [Google Scholar]
- 2.Galla HJ and Hartman W, Chem. Phys. Lipids 27 (1980) 199. [DOI] [PubMed] [Google Scholar]
- 3.Styer L, Annu. Rev. Biochem 47 (1978) 819. [DOI] [PubMed] [Google Scholar]
- 4.Thomas DD, Carlsen WF and Stryer L, Proc. Natl. Acad. Sci. U.S.A 75 (1978) 5746. [DOI] [PMC free article] [PubMed] [Google Scholar]
- 5.Yeh SM and Mears CM Biochemistry 19 (1980) 5057. [DOI] [PubMed] [Google Scholar]
- 6.Loken MR, Hayes JW, Gohlke JR and Brand L, Biochemistry 11 (1972) 4779. [DOI] [PubMed] [Google Scholar]
- 7.Gafni A and Brand L, Chem. Phys. Lett 58 (1978) 346. [Google Scholar]
- 8.Easter JH, DeToma RP and Brand L Biochim. Biophys. Acta 508 (1978) 27. [DOI] [PubMed] [Google Scholar]
- 9.Gafni A, DeToma RP, Manrow RE and Brand L Biophys. J 17 (1977) 155. [DOI] [PMC free article] [PubMed] [Google Scholar]
- 10.Lakowicz JR, Cherek H and Bevan DR, J. Biol. Chem 255 (1980) 4403. [PubMed] [Google Scholar]
- 11.Lakowicz JR and Cherek H, Biochem. Biophys. Res. Commun 99 (1981) 1173. [DOI] [PubMed] [Google Scholar]
- 12.Lakowicz JR and Cherek H, J. Biol. Chem 255 (1980) 831. [PubMed] [Google Scholar]
- 13.Turro NJ, Gratzel M and Braun AM, Angew. Chem 19 (1980) 675. [Google Scholar]
- 14.Badea MG and Brand L. Methods Enzymol 61 (1979) 378. [DOI] [PubMed] [Google Scholar]
- 15.Lakowicz JR, J. Biochem. Biophys. Methods 2 (1980) 91. [DOI] [PubMed] [Google Scholar]
- 16.Bakhshiev NG, Mazurenko Yu.T. and Piterskaya IV. Optics Spectrosc 21 (1966) 307. [Google Scholar]
- 17.Veselova TV, Obyknovennaya IE, Cherknsov AS and Shirokov VI. Optics Spectrosc 33 (1972) 488. [Google Scholar]
- 18.Bauer RK, Kowalczyk A and Balter A, Z. Naturforsch 32a (1977) 560. [Google Scholar]
- 19.Birks JB, Dyson DJ and Munro IH. Proc. Soc. Land. Ser. A 275 (1963) 575. [Google Scholar]
- 20.Macgregor RB and Weber G. Ann. N.Y. Acad. Sci 366 (1981) 140. [Google Scholar]
- 21.Rapp W, Klingenberg HH and Lersing HE. Ber. Bunsenges 75 (1971) 883. [Google Scholar]
- 22.Lakowicz JR and Balter A. Biophys. Chem 16 (1982) 117. [DOI] [PMC free article] [PubMed] [Google Scholar]
- 23.Veselova TV, Limareva LA, Cherkasov AS and Shirokov VI, Opt. Spectrosc 19 (1965) 39. [Google Scholar]
- 24.Bazilevskaya NS, Limareva LA, Cherkasov AS and Shirokov VI. Opt. Spectrosc 18 (1965) 202. [Google Scholar]
- 25.Gafni A, Modlin RL and Brand L, J. Phys. Chem 80 (1976) 898. [Google Scholar]
- 26.Cherkasov AS and Dragneva GI, Optics Spectrosc 10 (1961) 238. [Google Scholar]
- 27.Spencer RD and Weber G, Ann. N.Y. Acad. Sci 158 (1969) 361. [Google Scholar]
- 28.Weber G, in: Excited states of biological molecules ed. Birks JB (John Wiley and Sons, New York, 1976) p. 363. [Google Scholar]
- 29.Weber G, J. Phys. Chem 85 (1981) 949. [Google Scholar]
- 30.Weber G and Farris FJ, Biochemistry 18 (1979) 3075. [DOI] [PubMed] [Google Scholar]
- 31.Lakowicz JR and Balter A, Biophys. Chem (1982) in the press. [Google Scholar]
- 32.Laws WR and Brand L, J. Phys. Chem 83 (1979) 795. [Google Scholar]
- 33.Ross JBA, Rousslang KW and Brand L, Biochemistry 20 (1981) 4369. [DOI] [PubMed] [Google Scholar]
- 34.Cockle SA and Szabo AG, Photobiol. 34 (1981) 23. [DOI] [PubMed] [Google Scholar]
- 35.Knutson JR, Walbridge DG and Brand L, Am. Soc. Photobiol., Abstr (1981) 63. [Google Scholar]
- 36.Lakowicz JR and Cherek HC, J. Biochem. Biophys. Methods 5 (1981) 19. [DOI] [PubMed] [Google Scholar]
- 37.Lakowicz JR and Cherek H, J. Biol. Chem 246 (1981) 6348. [PubMed] [Google Scholar]
- 38.Veselova TV, Cherkasov AJ and Shirokov VI, Optics Spectrosc 42 (1977) 39. [Google Scholar]
- 39.Lakowicz JR and Balter A, (1982) Detection of reversibility of an excited state reaction by phase-modulation fluorometry. Submitted for publication. [Google Scholar]


