Abstract
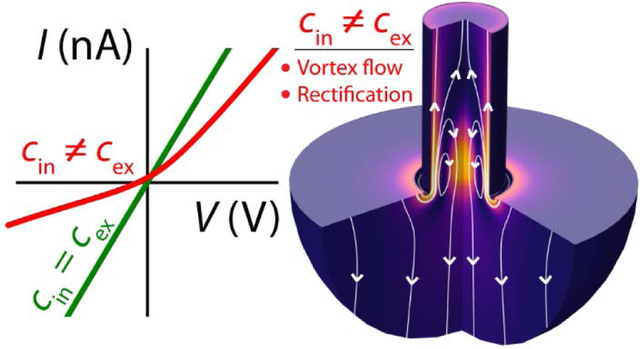
Ion current rectification (ICR) is a transport phenomenon in which an electrolyte conducts unequal currents at equal and opposite voltages. Here, we show that nanoscale fluid vortices and nonlinear electroosmotic flow (EOF) drive ICR in the presence of concentration gradients. The same EOF can yield negative differential resistance (NDR), in which current decreases with increasing voltage. A finite element model quantitatively reproduces experimental ICR and NDR recorded across glass nanopipettes under concentration gradients. The model demonstrates that spatial variations of electrical double layer properties induce the nanoscale vortices and nonlinear EOF. Experiments are performed in conditions directly related to scanning probe imaging and show that quantitative understanding of nanoscale transport under concentration gradients requires accounting for EOF. This characterization of nanopipette transport physics will benefit diverse experimentation pushing the resolution limits of chemical and biophysical recordings.
Graphical Abstract
INTRODUCTION
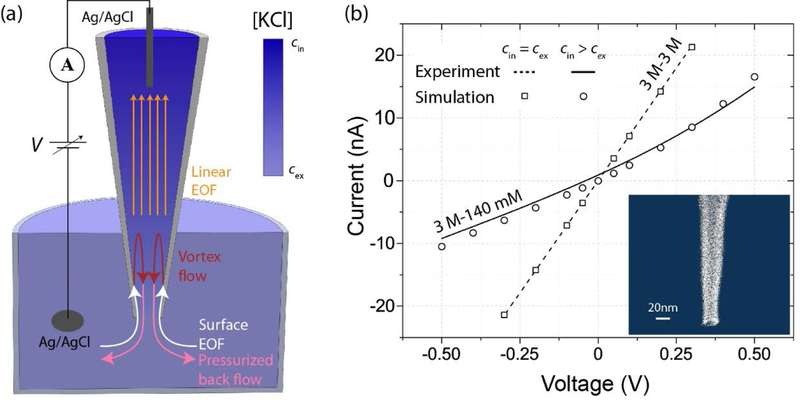
Nanopipettes are tools for studying nanofluidics1 and probing highly localized signals, with diverse applications in scanning probe microscopy,2–5 electrophysiology,6–9 electrochemistry,10,11 molecular detection,12–14 chemical delivery,15,16 and iontophoresis.17 Across these applications, the smallest pipettes offer the best spatial resolution, and the potential drawback of low current signals can be mitigated by filling pipettes with high-concentration solutions (e.g., 3 M). During experimentation, such pipettes are typically immersed in less concentrated solutions (e.g., 140 mM), creating a concentration gradient at the pipette tip. Due to the concentration gradient, pipettes conduct unequal currents at equal and opposite voltages, favoring one direction of current over the other (see Figure 1)—an effect known as ion current rectification (ICR).18–25 In this work, we use nanopipettes to characterize ICR in the presence of concentration gradients so that we can properly interpret physical signals recorded under these conditions.
Figure 1.
(a) Experimental schematic depicting voltage application and KCl gradient (color), as well as electroosmotic flow (EOF) streamlines, when V < 0 V. (b) Experimental (curves) and simulated (symbols) current-voltage recordings for a pipette when cin = cex = 3 M (dashed curve, squares) and cin = 3 M, cex = 140 mM (solid curve, circles). (Inset) Scanning electron micrograph of representative nanopipette (note: not pipette corresponding to experimental data).
In the case of uniform concentrations, ICR has been extensively studied and characterized.1,26–30 We refer to the ICR mechanism in these works as Debye-overlap ICR because measurements occur under low-κa conditions, where κa is a dimensionless parameter characterizing the ratio of channel radius (a) to Debye length (κ−1), calculated for a symmetric monovalent electrolyte as , where ε is solution permittivity, kB is the Boltzmann constant, e is the elementary charge, NA is the Avogadro number, and c∞ is bulk solution concentration. Under low-κa conditions, the electrolyte inside a charged nanochannel contains an ionic space charge such that the net ion concentration exceeds that of the electroneutral filling solution;31,32 in the presence of a nanochannel asymmetry (usually, conical shape), this space charge ion concentration can be polarized (e.g., enriched or depleted) with applied voltage, resulting in ICR.27–30
Debye-overlap ICR is restricted to intermediate solution concentrations. At low concentrations, the ionic space charge becomes fixed, voltage-induced concentration polarization ceases, and ICR vanishes, with the limiting concentration dependent on the surface charge magnitude in the channel.33 In the high-κa limit, Debye length is negligibly small, the ionic space charge no longer contributes appreciably to conduction, and ICR vanishes.29 By analyzing nanopipette measurements with a finite element model, we elucidate how a concentration gradient overcomes this high-κa ICR limitation.
Under intermediate concentrations (e.g., mM), a glass nanopipette exhibits Debye-overlap ICR by conducting more current when negative voltage is applied to the capillary than when positive voltage is applied, with respect to a reference voltage in an external bath solution.1,27,29,30,34 Taking directional sense from biological ion channels that only permit K+ influx,35 we refer to channels conducting more current at negative (positive) voltage as “inward” (“outward”) rectifying.
Numerical modeling has verified the Debye-overlap ICR mechanism through calculations of voltage and concentration distributions described by the Poisson and Nernst-Planck equations, respectively.27–30 Theoretical transport calculations accurately reproduce experimental results with surface charge as the only fitting parameter. Minimal discrepancies are observed when comparing the results of simulations incorporating and ignoring Navier-Stokes physics, demonstrating that electroosmotic flow (EOF) does not significantly contribute to Debye-overlap ICR.29,36–38
Yet reports of ICR in the presence of concentration or viscosity gradients point to an alternate, EOF-governed ICR mechanism, which we call “flow ICR.”18–25 High-κa ICR18,21,23,24 and tunable ICR (e.g., inward or outward)21,22,24 are inconsistent with two corollaries of the Debye-overlap mechanism: (1) ICR should vanish in highly concentrated solutions,1,29 and (2) surface charge polarity should determine whether a channel is inward or outward rectifying.34,39 During flow ICR, EOF in the presence of concentration or viscosity gradients results in more conductive solution being driven into or out of the channel, depending on the voltage polarity.21,24 Under sufficiently large gradients, flow ICR can induce negative differential resistance (NDR), in which an increase in voltage results in a decrease in current.40,41
In contrast with Debye-overlap ICR, analyses of flow ICR have yet to thoroughly explain the mechanisms underlying the effect. Extant work either does not reproduce experimental data with a numerical model incorporating EOF,19,21 or neglects EOF within models that only qualitatively match data.20,22,23 Only twice have simulations reproduced high-κa ICR. In the first case, larger pipettes are considered within a radially independent model (precluding scaling to the low-nm range);42 in the second case, EOF reversal is identified as contributing to flow ICR, but a limited explanation is provided for the observation.25
Here, we characterize flow ICR based on agreement between experimental data and simulations showing high-κa ICR, tunable ICR, and NDR in glass nanopipettes under concentration gradients. We investigate the physics governing flow ICR in conditions directly relevant to scanning probe imaging of biological systems by filling pipettes with near-saturated KCl solutions (cin = 3 M) and recording currents in physiologically-comparable KCl solutions (cex = 140 mM). When reversing the concentration gradient (cin = 30 mM, cex = 300 mM), we show that flow ICR can induce NDR. Finite element analysis of the coupled Poisson-Nernst Planck-Navier Stokes equations describes the nonlinear EOF underlying flow ICR, including characteristic nanovortex fluid flows.
METHODS
Pipette Fabrication.
Quartz glass capillaries with filaments and 1.0 mm outer and 0.5 mm inner diameters are pulled into nanopipettes using a single step program on a P-2000 micropipette puller: HEAT=850; FIL=5; VEL=55; DEL=145; PUL=195. Scanning electron microscope inspection of many pipettes reveals consistent generation of a nm-scale tip. Typical geometry (Figure 1b, inset) is a ~25 nm tip diameter with a cylindrical portion of height ~100 nm, followed by a small-degree conical taper that extends for multiple cm.
Experimental Pipette Recordings.
After fabrication, pipettes are filled with neutral-buffered KCl solutions and loaded into a micropipette holder containing an internal Ag/AgCl wire electrode. Pipettes are then immersed in an external neutral-buffered KCl solution containing an Ag/AgCl disk electrode. Voltage is applied to the internal wire with respect to the ground reference potential in the external solution (Figure 1a). The pipette voltage is swept using an Axon Multiclamp 700B current amplifier connected to the internal wire through a unity gain headstage. The voltage is swept from −1 V to 1 V at a rate of 2 V/s with a 10 kHz sampling rate. During experimentation, five voltage sweeps are recorded for a single set of conditions. Displayed data represents the average current values across the sweeps. Error bars are determined from the standard deviations of the recordings and are on the order of the plotted linewidths.
Simulation Theory and Finite Element Modeling.
The Poisson (Equation S1, “P”), Nernst-Planck (Equation S2, “NP”), and Navier-Stokes (Equation S3, “NS”) equations are evaluated in a cylindrical coordinate system using commercial finite element solver COMSOL Multiphysics 5.3a. The P-NP-NS evaluations describe voltage (P), concentration (NP), and velocity and pressure (NS) profiles inside the nanopipette (z > 0) and the external solution (z < 0). The coupled P-NP-NS equations are self-consistently evaluated with boundary conditions describing experimental conditions. Detailed description and verification of the numerical methods are provided in the Supporting Information Part 1 (Figures S1–S4, Tables S1–S4). A COMSOL-generated report outlining the implementation of the finite element model is provided in the Supporting Information Part 2.
During modeling, pipette geometry (Figure S1) is fit to experimental data based on analytical expressions for electrolyte resistors at high concentrations (Equations S4–S6). The surface charge (σ) is then fit to the measured ICR.
RESULTS AND DISCUSSION
Electroosmosis-governed ion current rectification (ICR) when cin ≠ cex.
When pipette currents are recorded in high-κa conditions with cin = cex = 3 M, the current-voltage relationship is linear. The pipette of Figure 1b exhibits constant resistance, Rpip = 14 MΩ (dashed line). Upon reducing cex to 140 mM (while maintaining cin = 3 M), the same pipette exhibits a nonlinear current-voltage relation (solid curve), where Rpip = 29 MΩ at V = −0.5 V and Rpip = 52 MΩ at V = 0.5 V (noting that Rpip increases due to reducing cex, and voltage-dependent Rpip arises due to flow ICR). We quantify ICR with the current rectification ratio (RR), defined as the larger current over the smaller current at V = ± 0.5 V. The pipette of Figure 1b exhibits RR = 1.6 when cin = 3 M and cex = 140 mM. Recordings from five additional pipettes demonstrate the qualitative consistency of the recordings in Figure 1b, with RR ranging from 1.6–3.4 (Figure S5). Smaller pipettes (larger Rpip, Figure S5a) generally rectify more than larger ones (Figure S5b), with variability due to pipette variations during fabrication.
The outward ICR of Figure 1b must be EOF-governed if the pipette surface is negatively charged and measurements are made in high-κa conditions. We confirm negative surface charge by recording pipette currents in less concentrated solutions without concentration gradients, where pipettes exhibit inward Debye-overlap ICR (Figure S6). We confirm high-κa conditions based on concentration-dependent scaling of RR and Rpip in the absence of concentration gradients, which indicate a transition from high-κa to low-κa conditions between 3 M and 300 mM (Figure S7).
We further confirm the ICR of Figure 1b to be EOF-governed by measuring both inward and outward ICR across a single pipette, depending on the direction of the concentration gradient (Figure S8). The measured dependence of ICR on the concentration gradient fits our qualitative understanding of flow ICR: when cin > cex, a positive (negative) voltage across a negatively charged channel drives outward (inward) EOF, pushing concentrated (dilute) solution into the channel and decreasing (increasing) resistance.
When fitting a simulation to the pipette in Figure 1b, we determine reasonable values of a = 12 nm and σ = −8 mC/m2 (complete parameters provided in Table S2) based on excellent quantitative agreement between simulated current-voltage data (Figure 1b, symbols) and experimental recordings. Within the simulations of Figure 1b, only cex is altered between the data sets. If EOF is neglected, experimental behavior cannot be reproduced. Relevant EOF streamlines when cin = 3 M, cex = 140 mM, and V < 0 V are qualitatively depicted in Figure 1a.
Fluid vortices and nonlinear EOF drive flow ICR.
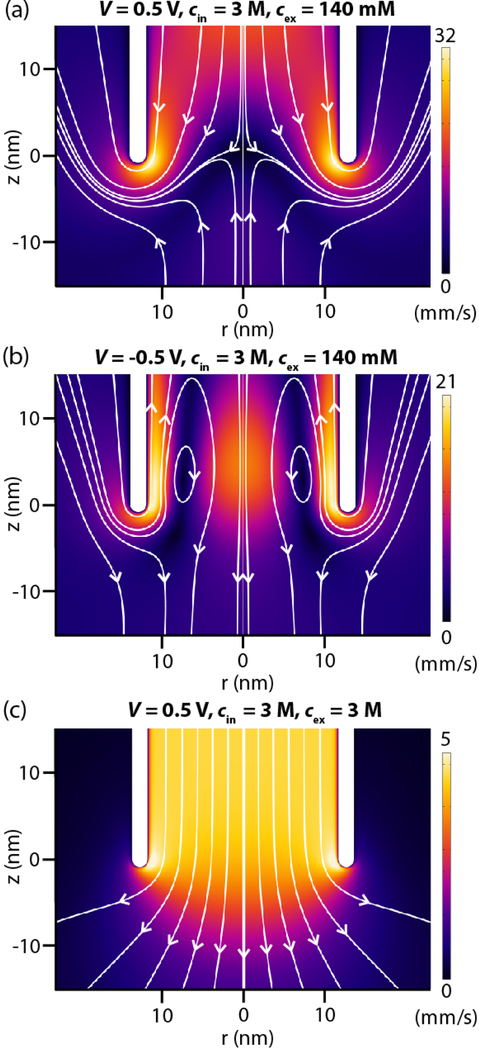
We employ the finite element model to further study the EOF inducing experimental ICR. In the presence of the concentration gradient, simulated fluid flow at the tip of the pipette in Figure 1b reveals vortex EOF patterns (Figures 2a,b), a hallmark of nonlinear EOF.43–49 The flows starkly contrast with the linear EOF pattern observed in the absence of the concentration gradient (Figure 2c). In Figures 2a,b, EOF streamlines depict vortex flows where centerline (r = 0 nm) velocities at the tip oppose EOF near the walls and EOF far into the pipette. We observe that vortex shapes and locations depend on the voltage polarity, pipette geometry, and concentration gradient. As voltage increases, vortices spin faster but do not move.
Figure 2.
Simulated EOF velocity heatmaps and streamlines at the tip of the pipette in Figure 1b. (a,b) A concentration gradient induces fluid vortices and nonlinear EOF. Vortex shapes are dependent on voltage polarity and are independent of voltage magnitude. (c) Under uniform concentration conditions, no vortex develops. Note that unequal scales are used to visualize flow rates and a concentration gradient increases EOF velocity.
The vortices and centerline flow reversals result from the combination of fast nonlinear EOF near pipette sidewalls and fluid continuity constraints. When examining the radial velocity distributions across Figure 2, we observe that EOF is fastest along the sidewalls when flow is nonlinear (Figure S9) and fastest at the center when flow is linear (Figure S10). In the nonlinear vortex case, fast EOF along sidewalls at the tip would drive local volumetric fluid flow exceeding the volumetric flow rate far into the pipette, if not for the centerline flow reversal. Thus, the vortex flows ensure that the net volumetric flow rate is equal throughout the pipette, preserving fluid continuity. Further, the nonlinear EOF induced by the concentration gradient increases EOF velocity as compared to uniform concentration conditions (Figure S11). Large hydrostatic pressures develop within the pipette to drive the reversed flows (Figure S12), which we call hydrostatic back flows. The flow reversal mechanism we propose differs from prior explanations of nanopore flow reversals.25,50
A concentration gradient induces nonlinear EOF by creating a spatially varying zeta potential, where zeta potential describes the voltage drop across the diffuse part of the electrical double layer.32 Because this voltage depends on the distance (~ 3κ−1) that the diffuse layer extends from the pipette wall, zeta potential is nonuniform in the presence of a concentration gradient. In the absence of a concentration gradient, zeta potential is spatially uniform and vortex EOF patterns are not observed. Likewise, the two mechanisms for describing nonlinear EOF require spatially varying zeta potentials.51 In induced charge electroosmosis (ICEO), a voltage polarizes charge along a surface, thereby inducing or exacerbating a nonuniform zeta potential, driving supplemental EOF, and culminating in vortex flows.46,48,49 In electroosmosis of the second kind, a voltage depletes co-ion concentration at a permselective membrane, thereby inducing or exacerbating a nonuniform zeta potential, compounding the space charge, and culminating in vortex flows.43–45,47
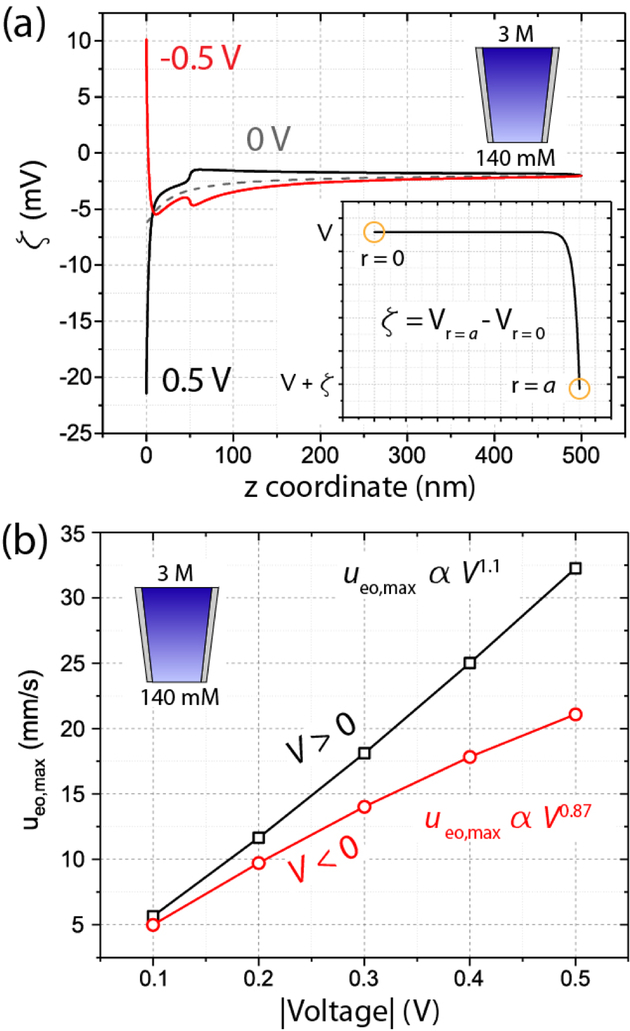
In Figure 3a, we simulate the zeta potential along the wall of the pipette. We calculate the zeta potential based on the radial voltage drop between the pipette wall and the pipette centerline, as the wall represents the double layer slip plane and the centerline represents a point outside the diffuse part of the double layer. Throughout the simulation domain, the radial voltage profile flattens before the centerline (as shown in the inset), such that the centerline voltage is an appropriate reference against which to measure the zeta potential. With this approach, we follow the conventional definition for zeta potential, while assuming that the Stern layer is coincident with the immobile part of the electrical double layer.32
Figure 3.
Simulated nonlinear EOF for the pipette in Figure 1b, with cin = 3 M and cex = 140 mM. (a) Nonuniform zeta potential (ζ) distributions drive nonlinear EOF. When V = 0 V (gray), moderate zeta potential nonuniformity arises due to the concentration gradient. When V = ± 0.5 V, induced charge polarization exacerbates zeta potential nonuniformity and drives ICEO. (Inset) Radial voltage distribution showing calculation of zeta potential from simulation. (b) Maximum fluid velocity (ueo,max) scales superlinearly with voltage when V > 0 V (black curve) and sublinearly when V < 0 V (red curve), due to the contributions of ICEO flows.
Experimental pipettes exhibit ICEO based on the zeta potential nonuniformity that arises due to the concentration gradient and is exacerbated by induced charge polarization. When cin = 3 M and cex = 140 mM, in the absence of an electric field (V = 0), the charged pipette walls and Debye length scaling induce a 3-fold zeta potential increase between the simulation boundary and the pipette tip (Figure 3a, gray curve). When applying V = 0.5 V, the axial electric field induces charge polarization, increasing the negative charge magnitude at the tip and driving a 10-fold zeta potential increase (Figure 3a, black curve). When applying V = −0.5 V, the tip becomes positively charged and zeta potential correspondingly changes sign (Figure 3a, red curve). We further support the ICEO mechanism by quantifying the induced surface charge polarization at the pipette tip (Figure S13). Consistent with the charge polarization, we observe slightly more anions than cations at the tip when V = −0.5 V (Figure S14). Interestingly, the streamlines of Figures 2a,b remain qualitatively consistent with electroosmosis of the second kind in microchannels.52
The ICEO fluid velocity (ueo) due to charge polarization superimposes over the linear fluid velocity due to intrinsic pipette charge,46 with the latter given by the Smoluchowski relation (ueo = −εζE/η, with E as voltage gradient and η as solution viscosity). The cumulative flow yields a power-law relationship between voltage and EOF velocity. In Figure 3b, we quantify EOF nonlinearity by plotting the maximum simulated EOF velocity (ueo,max) versus voltage. We find that the vortex flow of Figure 2a yields superlinear velocity scaling as ueo,max ∝ V1.1 (Figure 3b, black curve), while the vortex flow of Figure 2b yields sublinear velocity scaling as ueo,max ∝ Vo.87 (Figure 3b, red curve). The velocity scaling is consistent with ICEO and the zeta potential distributions of Figure 3a: when V > 0 V, the zeta potential increase drives ICEO flow concurrent to distal EOF, enhancing velocity scaling; when V < 0 V, the zeta potential sign change drives ICEO flow opposing distal EOF, suppressing velocity scaling. Voltage-dependent velocity scaling has previously been reported as EOF rectification.29,30,53,54
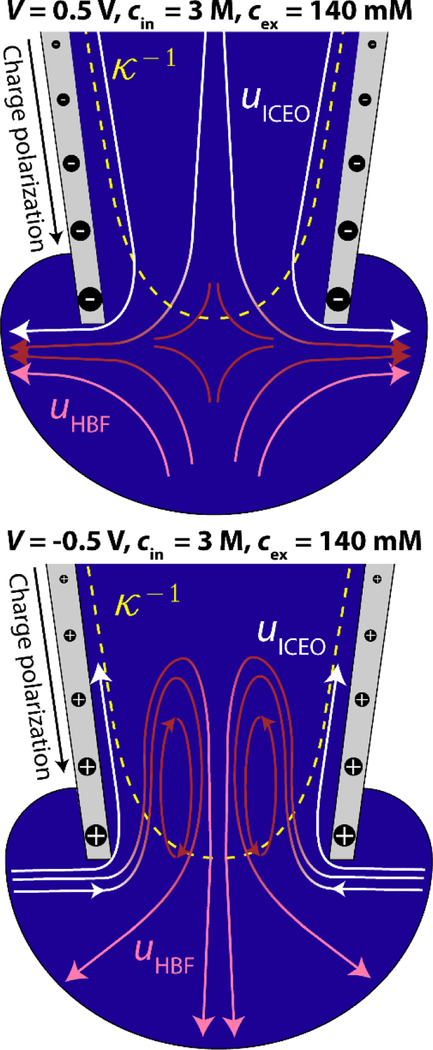
Scheme 1 provides a qualitative summary of the velocity streamlines in Figures 2a,b and the zeta potential distributions in Figure 3a. In Scheme 1, white streamlines represent ICEO flows along the polarized sidewalls (uICEO), pink streamlines represent hydrostatic back flows (uHBF) along the center axes, and red streamlines represent vortex mixing flows. The nonuniform zeta potential arises due to spatial variations in Debye length and charge polarization, respectively indicated by the dashed yellow line and symbols within the gray sidewalls (not to scale). Far into the pipette, zeta potential is approximately uniform (Figure 3a), driving linear EOF (qualitatively similar to Figure 2c).
Scheme 1.
Characterizing nonlinear EOF at the nanopipette tip. When cin ≠ cex, a spatially varying Debye length (dashed yellow line) induces a nonuniform zeta potential. An electric field exacerbates this nonlinearity through induced charge polarization (indicated by sizes and signs of black symbols). Together, the effects drive amplified EOF near sidewalls (uICEO). In the presence of fast sidewall flow, hydrostatic back flows (uHBF) develop to preserve fluid continuity. Vortex flows (red) connect ICEO and back flow streamlines. Far from the tip, EOF is linear (Figure S9).
Comparing flow ICR and Debye-overlap ICR.
Both flow ICR and Debye-overlap ICR arise from voltage-dependent enrichment and depletion of ion concentrations inside a nanochannel. When ICR occurs, reduced resistance is measured for voltages that enrich concentration and increased resistance is measured for voltages that de plete concentration (resistance scales inversely with ion concentration). This effect has been quantified a handful of times during flow ICR25,42,55 and is well understood during Debye-overlap ICR.27,29,30
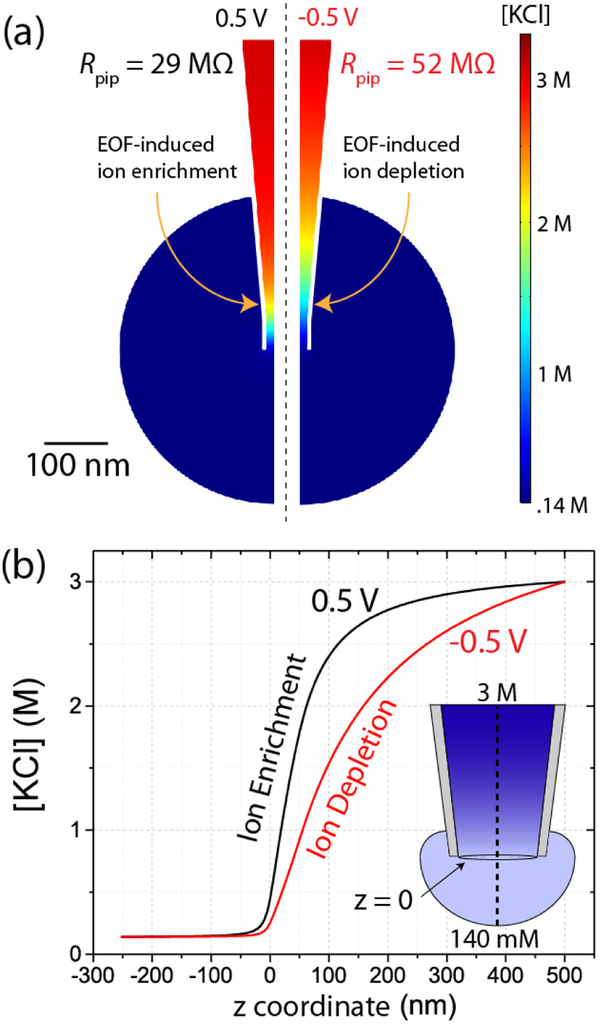
We quantify ion enrichment and depletion during flow ICR by plotting the concentration distributions for the pipette of Figure 1b with concentration maps (Figure 4a) and centerline profiles (Figure 4b). When V = 0.5 V, outward EOF drives concentrated cin = 3 M solution into the pipette tip, enriching concentration and reducing Rpip to 29 MΩ (Figure 4a, left; Figure 4b, black curve). When V = −0.5 V, inward EOF drives dilute cex = 140 mM solution into the pipette tip, depleting concentration and increasing Rpip to 52 MΩ (Figure 4a, right; Figure 4b, red curve). We simulate the same pipette under low-κa conditions, similar to measurements in Figure S6, to illustrate that concentration polarization also underlies Debye-overlap ICR (Figure S15a).
Figure 4.
Simulated ion distributions for the pipette in Figure 1b, when cin = 3 M and cex = 140 mM. (a) Concentration maps and (b) centerline profiles, when V = ± 0.5 V. Voltage-dependent ion concentration enrichment and depletion arise due to EOF, inducing ICR. Space charge is negligible, such that [K+] = [Cl−] = [KCl].
The discrepancies between flow ICR and Debye-overlap ICR are informed by the different mechanisms inducing concentration enrichment and depletion: electroosmosis governs the former and electrophoresis governs the latter. During flow ICR, introducing a solution asymmetry across a channel yields a conductivity gradient and EOF fills the channel with more or less conductive solution, rectifying current.21,25,40–42 During Debye-overlap ICR, low-κa conditions yield an ionic space charge in the channel and a geometric asymmetry introduces voltage-dependent transport restrictions, rectifying current.1,27–29,31 In flow ICR, surface charge is required to induce EOF, while in Debye-overlap ICR, surface charge is required to induce a space charge electrolyte; in both, an asymmetry is required to yield voltage-dependent resistance. These qualities of flow ICR and Debye-overlap ICR, including the consequences of the disparate mechanisms, are compared in Scheme 2.
Scheme 2.
Comparison of flow and Debye-overlap ICR.
A useful outcome of the concentration gradient in flow ICR is control over ion transport selectivity,55 as shown in Figure S16. During flow ICR when cin > cex, both ions diffuse from the pipette and the voltage can be set to draw in as many ions as exit via diffusion. For example, when V ≈ −80 mV, voltage-driven influx of K+ opposes diffusive efflux, such that the current from the pipette in Figure 1b is primarily comprised of Cl−. During scanning probe imaging of neurons, the ability to tune ionic selectivity is particularly beneficial, as large K+ flux will desensitize membrane ion channels but Cl− flux is less detrimental.56 In contrast, the space charge within the Debye-overlap ICR pipette (Figure S15b) results in preferential transport of cations throughout experimental voltages, though precise selectivity does vary with voltage (Figure S16).
EOF influences transport amidst concentration gradients.
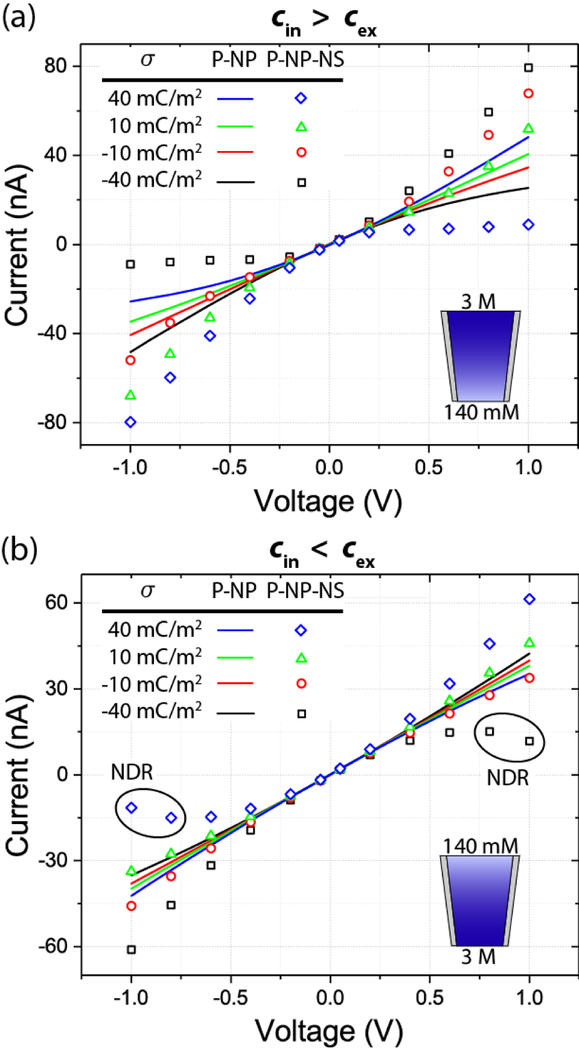
Extended simulations show that EOF influences transport for all moderate surface charge conditions in the presence of mismatched mM and M concentrations. In Figure 5a, we compare current-voltage simulations incorporating EOF (P-NP-NS, symbols) and ignoring EOF (P-NP, curves) for the pipette of Figure 1b (cin = 3 M, cex = 140 mM) across a range of surface charges (σ = −40 to 40 mC/m2). These surface charge modifications are achievable through chemical treatment of the glass capillary. Figure 5b shows analogous simulations with the concentrations inverted (cin = 140 mM, cex = 3 M). For both concentration gradient directions, ignoring EOF inverts the relationship between surface charge polarity and ICR direction and underestimates RR due to losing ICEO transport. Thus, if EOF is not considered during modeling of experimental transport in the presence of a concentration gradient, it is likely to misrepresent surface charge polarity.
Figure 5.
Simulated pipette current-voltage relationships with (symbols, P-NP-NS) and without (curves, P-NP) EOF, when sweeping surface charge (σ), with (a) cin > cex and (b) cin < cex. Simulations ignoring EOF invert the relationship between ICR and surface charge polarity and underestimate RR. (b) Vortex flows can induce negative differential resistance (NDR) under sufficient voltage and surface charge. When cin = cex, ignoring EOF is valid (Figure S18).
Across a larger range of κa conditions and concentration gradients, we similarly find that EOF influences transport (Figure S17). When simulating current-voltage relations for pipettes with cin and cex ranging from 3 M to 3 mM, ignoring EOF yields quantitative disagreement across all conditions and often inverts the predicted direction of ICR. Accordingly, EOF must be included to quantitatively model experimental transport recorded amidst concentration gradients. Upon removing the concentration gradient, EOF negligibly influences transport when cin = cex = 3 M and cin = cex = 140 mM (Figure S18).
Negative differential resistance (NDR) when cin < cex.
Negative differential resistance (NDR) is an ICR-related phenomenon in which an increase in voltage is ac companied by a decrease in current. Two prior reports of NDR measured under viscosity40 and concentration (cin > cex)41 gradients required external pressure. The latter proposed exploiting NDR for chemical sensing. Elsewhere, reports of NDR required high voltages49,57 or low concentration and current levels.58 In Figure 5b, we highlight the predictions that when cin < cex, flow ICR can induce NDR in conditions distinct from these prior works, albeit at surface charge levels higher than observed experimentally. Because increasing surface charge reduces the ratio of ions in the electroneutral solution to ions in the diffuse double layer, we reproduce the simulated NDR through lowering the experimental κa while maintaining cin < cex.
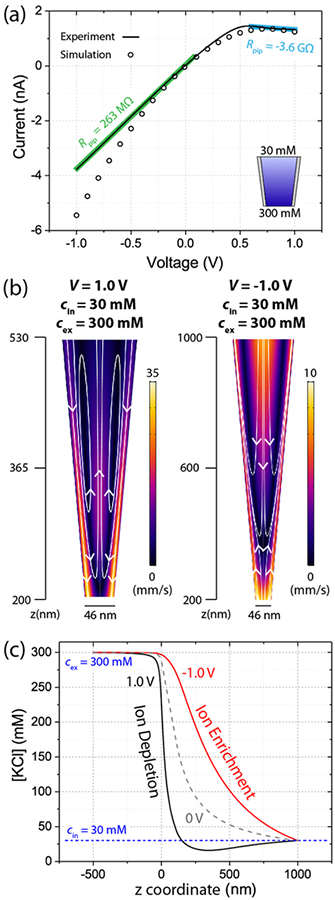
When pipette currents are recorded with cin = 30 mM and cex = 300 mM, we measure NDR in the V = 0.6–1.0 V range, as shown in Figure 6a (curve). The measured NDR agrees with simulations for a pipette with a = 15 nm and σ = −12 mC/m2 (Figure 6a, circles; complete parameters provided in Table S2). Moderate variations in surface charge across experimental SiO2 devices have been observed previously,59,60 and we attribute our increase in surface charge to fabrication variability. Simulations indicate that NDR occurs only at certain combinations of geometry and surface charge (Figure S19), consistent with referenced work41 and experimental NDR being recorded in only 3 of ~30 pipettes tested with cin = 30 mM and cex = 300 mM.
Figure 6.
(a) Experimental (line) and simulated (symbols) negative differential resistance (NDR) for a pipette when cin = 30 mM and cex = 300 mM. (b) Simulated EOF velocity heatmaps and streamlines for the pipette in (a). When V = 1.0 V (left), the vortex flows induce NDR. (c) Simulated centerline concentrations for the pipette in (a). EOF enriches (red) or depletes (black) concentration; during NDR, depletion reduces internal concentration below the levels of the filling solutions.
Mechanistically, NDR is attributed to the influence of the vortex flow pattern on ion concentrations and can thus be considered a natural extension of the flow ICR discussion. In Figure 6b, we depict simulated fluid velocity heatmaps and streamlines at the tip of the pipette in Figure 6a, where the ICEO streamlines near the wall (see uICEO, Scheme 1) carry ion-enriched diffuse double layer fluid (Figure S20). As voltage increases and vortices spin faster, the hydrostatic back flows (see uHBF, Scheme 1) progressively deplete of ions to preserve mass continuity, analogous to the fluid continuity arguments made previously.
The vortex flow pattern induces NDR when the hydrostatic back flows deplete ion concentrations within the pipette below the levels of the filling solutions. The concentration depletion is depicted in Figure 6c, which shows simulated concentration distributions for the pipette of Figure 6a. When V = 1.0 V, the intermediate pipette concentration reduces below cin (Figure 6c, black curve), an effect that does not occur in simulation until EOF is sufficiently fast (V = 0.8 V, Figure S21) and coincides with the onset of NDR. When the internal pipette concentration depletes below the levels of the filling solutions, the low-concentration region displaces the small tip aperture as the greatest contributor to resistance and NDR is measured.
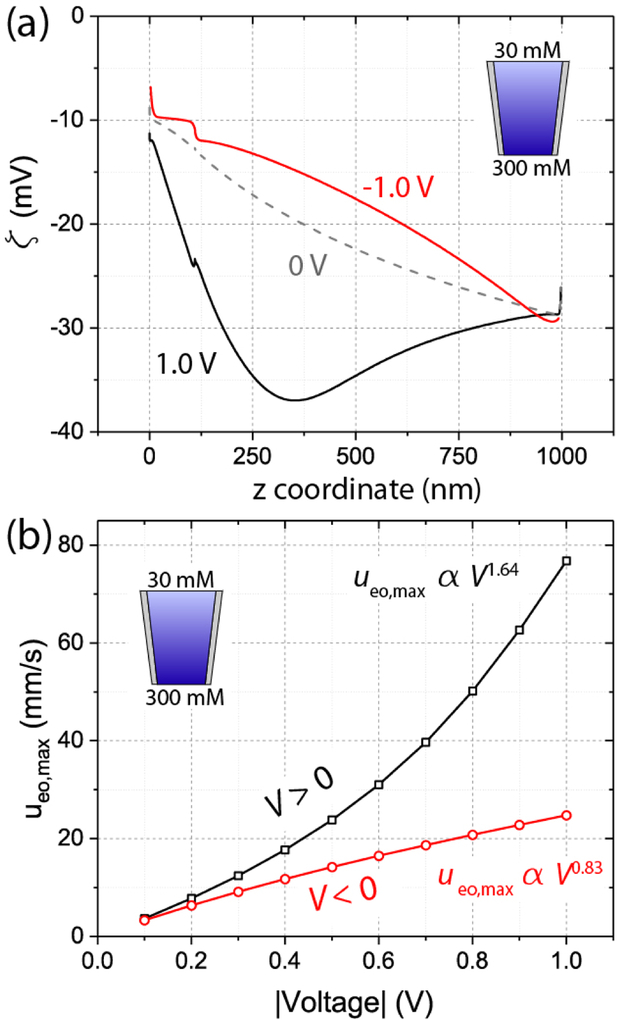
Simulated zeta potential distributions for the pipette in Figure 6a show severe nonuniformity (Figure 7a), as expected. The profiles are consistent with the vortex locations in Figure 6b, which are much further into the pipette than those of Figures 2a,b. When V = 1.0 V (black curve), negative charge polarization induces a zeta potential maximum at z ≈ 350 nm, near the center of the vortex flow in Figure 6b (left). When V = −1.0 V (red curve), positive charge polarization results in a zeta potential maximum at the simulation boundary (z = 1,000 nm), around which the vortex flow remains centered. It is therefore conceivable to engineer systems with carefully placed vortex flows, with possible applications in nanoscale mixing or single molecule trapping, if a surface can be selectively patterned with a charged coating.61 Downstream of the internal vortices, flow is linear (Figure S22).
Figure 7.
Simulated nonlinear EOF for the pipette in Figure 6a (cin = 30 mM, cex = 300 mM). (a) Zeta potential (ζ) distribution when V = 1.0 V (black), 0 V (gray), and −1.0 V (red). Vortex flows in Figure 6b center around zeta potential maxima. (b) Maximum fluid velocity (ueo,max) scales superlinearly with voltage when V > 0 V (black curve) and sublinearly when V < 0 V (red curve).
We lastly demonstrate that EOF rectification is responsible for the pipette of Figure 6a only exhibiting NDR when V > 0 V. In Figure 7b, we simulate the maximum EOF velocity (ueo,max) versus voltage, observing EOF rectification with exacerbated nonlinearity as compared to Figure 4b. Through the NDR regime (V > 0, black curve), velocity scales superlinearly as ueo,max ∝ V1.62. Through the more conductive regime (V < 0, red curve), velocity scales sublinearly as ueo,max ∝ V0.82. The sublinear EOF scaling prevents the vortex from spinning fast enough for hydrostatic back flows to deplete internal ion concentrations below the levels of the filling solutions.
We note that the velocity scaling of Figure 7b is qualitatively consistent with charge polarization in Figure 7a and comparable measurements when cin > cex (Figure 3b). These similarities indicate that a negatively charged surface in the presence of a concentration gradient can be expected to exhibit EOF rectification with higher flowrates for positive voltages, independent of the direction of the concentration gradient, due to the induced charge effect.
CONCLUSIONS
We characterize EOF-governed ICR (“flow ICR”) through quantitative agreement between experimental and simulated current-voltage relationships for nanopipettes under concentration gradients. During flow ICR, current rectifies based on EOF driving more or less concentrated solution into the nanochannel, with a preferred current direction that is tunable and inverts with the concentration gradient. We demonstrate that the concentration gradient and surface charge polarization induce a spatially varying zeta potential that drives nanoscale fluid vortices, nonlinear EOF, and EOF rectification. The same mechanisms can result in NDR when vortex flows thoroughly deplete ion concentrations inside the nanochannel. Through simulations, we show that for mM and/or M solutions, EOF influences ion and fluid transport in the presence of any concentration gradient.
The effects studied herein are applicable to many nanopipette applications. In scanning probe microscopy and electrophysiology, filling pipettes with highly concentrated solutions improves signal-to-noise ratio, but could distort signals if these nonlinear effects are not considered. In electrochemistry and molecular detection, concentration gradients can facilitate localized concentration enrichment or depletion of desired analytes. In chemical delivery and iontophoresis, concentration gradients can improve transport efficiency and selectivity. Further, exploitation of the vortex flows we present may afford additional opportunities in nanoscale mixing.
Finally, we speculate that these mechanisms may contribute to intracellular rectification of ion and fluid transport. Though our experiments contain many simplifications compared to natural systems, the voltage and concentration gradients considered in this work are comparable to those found in certain cells. For example, during synaptic integration, large spatial ionic gradients are known to occur across the dendritic spine apparatus,62 conditions where nonlinear EOF may contribute to the ensuing ion transport and voltage dynamics.
Supplementary Material
ACKNOWLEDGMENTS
This work is supported in part by a grant from the W. M. Keck Foundation. We thank R. Yuste for use of his laboratory facilities for nanopipette preparation. We thank the Electron Microscopy facility within the Columbia Nano Initiative for nanopipette imaging.
Footnotes
SUPPORTING INFORMATION AVAILABLE
Supporting Information Part 1 contains simulation theory and verification, experimental pipette characterization, and supplemental analysis. Supporting Information Part 2 contains a COMSOL-generated report describing finite element model implementation. This information is available free of charge via the Internet at http://pubs.acs.org.
REFERENCES
- (1).Wei C; Bard AJ; Feldberg SW Current Rectification at Quartz Nanopipet Electrodes. Anal. Chem 1997, 69, 4627–4633. [Google Scholar]
- (2).Novak P; Li C; Shevchuk AI; Stepanyan R; Caldwell M; Hughes S; Smart TG; Gorelik J; Ostanin VP; Lab MJ; et al. Nanoscale Live-Cell Imaging Using Hopping Probe Ion Conductance Microscopy. Nat. Methods 2009, 6, 279–281. [DOI] [PMC free article] [PubMed] [Google Scholar]
- (3).McKelvey K; Kinnear SL; Perry D; Momotenko D; Unwin PR Surface Charge Mapping with a Nanopipette. J. Am. Chem. Soc 2014, 136, 13735–13744. [DOI] [PubMed] [Google Scholar]
- (4).Perry D; Page A; Chen B; Frenguelli BG; Unwin PR Differential-Concentration Scanning Ion Conductance Microscopy. Anal. Chem 2017, 89, 12458–12465. [DOI] [PubMed] [Google Scholar]
- (5).Choi M; Baker LA Biphasic-Scanning Ion Conductance Microscopy. Anal. Chem 2018, 90, 11797–11801. [DOI] [PubMed] [Google Scholar]
- (6).Schrlau MG; Dun NJ; Bau HH Cell Electrophysiology with Carbon Nanopipettes. ACS Nano 2009, 3, 563–568. [DOI] [PubMed] [Google Scholar]
- (7).Novak P; Gorelik J; Vivekananda U; Shevchuk AI; Ermolyuk YS; Bailey RJ; Bushby AJ; Moss GWJ; Rusakov DA; Klenerman D; et al. Nanoscale-Targeted Patch-Clamp Recordings of Functional Presynaptic Ion Channels. Neuron 2013, 79, 1067–1077. [DOI] [PMC free article] [PubMed] [Google Scholar]
- (8).Jayant K; Hirtz JJ; Plante I. J. La; Tsai DM; De Boer WDAM; Semonche A; Peterka DS; Owen JS; Sahin O; Shepard KL; et al. Targeted Intracellular Voltage Recordings from Dendritic Spines Using Quantum-Dot-Coated Nanopipettes. Nat. Nanotechnol 2017, 12, 335–342. [DOI] [PMC free article] [PubMed] [Google Scholar]
- (9).Jayant K; Wenzel M; Bando Y; Hamm JP; Mandriota N; Rabinowitz JH; Plante I. J. La; Owen JS; Sahin O; Shepard KL; et al. Flexible Nanopipettes for Minimally Invasive Intracellular Electrophysiology In Vivo. Cell Rep. 2019, 26, 266–278. [DOI] [PMC free article] [PubMed] [Google Scholar]
- (10).Mirkin MV; Fan FRF; Bard AJ Direct Electrochemical Measurements inside a 2000 Angstrom Thick Polymer Film by Scanning Electrochemical Microscopy. Science. 1992, 257, 364–366. [DOI] [PubMed] [Google Scholar]
- (11).Shao Y; Mirkin MV; Fish G; Kokotov S; Palanker D; Lewis A Nanometer-Sized Electrochemical Sensors. Anal. Chem 1997, 69, 1627–1634. [Google Scholar]
- (12).Karhanek M; Kemp JT; Pourmand N; Davis RW; Webb CD Single DNA Molecule Detection Using Nanopipettes and Nanoparticles. Nano Lett. 2005, 5, 403–407. [DOI] [PubMed] [Google Scholar]
- (13).Piper JD; Clarke RW; Korchev YE; Ying L; Klenerman D A Renewable Nanosensor Based on a Glass Nanopipette. J. Am. Chem. Soc 2006, 128, 16462–16463. [DOI] [PubMed] [Google Scholar]
- (14).Umehara S; Karhanek M; Davis RW; Pourmand N Label-Free Biosensing with Functionalized Nanopipette Probes. Proc. Natl. Acad. Sci 2009, 106, 4611–4616. [DOI] [PMC free article] [PubMed] [Google Scholar]
- (15).Wang Y; Cai H; Mirkin MV Delivery of Single Nanoparticles from Nanopipettes under Resistive-Pulse Control. ChemElectroChem 2015, 2, 343–347. [Google Scholar]
- (16).McKelvey K; Edwards MA; White HS Resistive Pulse Delivery of Single Nanoparticles to Electrochemical Interfaces. J. Phys. Chem. Lett 2016, 7, 3920–3924. [DOI] [PubMed] [Google Scholar]
- (17).Herr NR; Kile BM; Carelli RM; Wightman RM Electroosmotic Flow and Its Contribution to Iontophoretic Delivery. Anal. Chem 2008, 80, 8635–8641. [DOI] [PMC free article] [PubMed] [Google Scholar]
- (18).Fåhraeus C; Borglid K; Grampp W Properties of Electrolyte-Filled Glass Microelectrodes: An Experimental Study. J. Neurosci. Methods 1997, 78, 15–28. [DOI] [PubMed] [Google Scholar]
- (19).Siwy Z; Fuliński A A Nanodevice for Rectification and Pumping Ions. Am. J. Phys 2004, 72, 567–574. [Google Scholar]
- (20).Cheng LJ; Guo LJ Rectified Ion Transport through Concentration Gradient in Homogeneous Silica Nanochannels. Nano Lett. 2007, 7, 3165–3171. [DOI] [PubMed] [Google Scholar]
- (21).Yusko EC; An R; Mayer M Electroosmotic Flow Can Generate Ion Current Rectification in Nano- and Micropores. ACS Nano 2010, 4, 477–487. [DOI] [PubMed] [Google Scholar]
- (22).Cao L; Guo W; Wang Y; Jiang L Concentration-Gradient-Dependent Ion Current Rectification in Charged Conical Nanopores. Langmuir 2012, 28, 2194–2199. [DOI] [PubMed] [Google Scholar]
- (23).Deng XL; Takami T; Son JW; Kang EJ; Kawai T; Park BH Effect of Concentration Gradient on Ionic Current Rectification in Polyethyleneimine Modified Glass Nano-Pipettes. Sci. Rep 2014, 4, 4005. [DOI] [PMC free article] [PubMed] [Google Scholar]
- (24).Qiu Y; Lucas RA; Siwy ZS Viscosity and Conductivity Tunable Diode-like Behavior for Meso- and Micropores. J. Phys. Chem. Lett 2017, 8, 3846–3852. [DOI] [PubMed] [Google Scholar]
- (25).Qiu Y; Siwy ZS; Wanunu M Abnormal Ionic-Current Rectification Caused by Reversed Electroosmotic Flow under Viscosity Gradients across Thin Nanopores. Anal. Chem 2019, 91, 996–1004. [DOI] [PubMed] [Google Scholar]
- (26).Siwy Z; Fuliński A Fabrication of a Synthetic Nanopore Ion Pump. Phys. Rev. Lett 2002, 89, 4–7. [DOI] [PubMed] [Google Scholar]
- (27).Woermann D Electrochemical Transport Properties of a Cone-Shaped Nanopore: High and Low Electrical Conductivity States Depending on the Sign of an Applied Electrical Potential Difference. Phys. Chem. Chem. Phys 2003, 5, 1853–1858. [Google Scholar]
- (28).Cervera J; Schiedt B; Ramírez P A Poisson/Nernst-Planck Model for Ionic Transport through Synthetic Conical Nanopores. Europhys. Lett 2005, 71, 35–41. [Google Scholar]
- (29).White HS; Bund A Ion Current Rectification at Nanopores in Glass Membranes. Langmuir 2008, 24, 2212–2218. [DOI] [PubMed] [Google Scholar]
- (30).Lan WJ; Edwards MA; Luo L; Perera RT; Wu X; Martin CR; White HS Voltage-Rectified Current and Fluid Flow in Conical Nanopores. Acc. Chem. Res 2016, 49, 2605–2613. [DOI] [PubMed] [Google Scholar]
- (31).Plecis A; Schoch RB; Renaud P Ionic Transport Phenomena in Nanofluidics: Experimental and Theoretical Study of the Exclusion-Enrichment Effect on a Chip. Nano Lett. 2005, 5, 1147–1155. [DOI] [PubMed] [Google Scholar]
- (32).Schoch RB; Han J; Renaud P Transport Phenomena in Nanofluidics. Rev. Mod. Phys 2008, 80, 839–883. [Google Scholar]
- (33).Cervera J; Schiedt B; Neumann R; Mafá S; Ramírez P Ionic Conduction, Rectification, and Selectivity in Single Conical Nanopores. J. Chem. Phys 2006, 124, 104706. [DOI] [PubMed] [Google Scholar]
- (34).Umehara S; Pourmand N; Webb CD; Davis RW; Yasuda K; Karhanek M Current Rectification with Poly-L-Lysine-Coated Quartz Nanopipettes. Nano Lett. 2006, 6, 2486–2492. [DOI] [PMC free article] [PubMed] [Google Scholar]
- (35).Kubo Y; Baldwin TJ; Nung Jan Y; Jan LY Primary Structure and Functional Expression of a Mouse Inward Rectifier Potassium Channel. Nature 1993, 362, 127–133. [DOI] [PubMed] [Google Scholar]
- (36).Ai Y; Zhang M; Joo SW; Cheney MA; Qian S Effects of Electroosmotic Flow on Ionic Current Rectification in Conical Nanopores. J. Phys. Chem. C 2010, 114, 3883–3890. [Google Scholar]
- (37).Lin DH; Lin CY; Tseng S; Hsu JP Influence of Electroosmotic Flow on the Ionic Current Rectification in a PH-Regulated, Conical Nanopore. Nanoscale 2015, 7, 14023–14031. [DOI] [PubMed] [Google Scholar]
- (38).Hsu JP; Yang ST; Lin CY; Tseng S Ionic Current Rectification in a Conical Nanopore: Influences of Electroosmotic Flow and Type of Salt. J. Phys. Chem. C 2017, 121, 4576–4582. [Google Scholar]
- (39).Siwy Z; Heins E; Harrell CC; Kohli P; Martin CR Conical-Nanotube Ion-Current Rectifiers: The Role of Surface Charge. J. Am. Chem. Soc 2004, 126, 10850–10851. [DOI] [PubMed] [Google Scholar]
- (40).Luo L; Holden DA; Lan WJ; White HS Tunable Negative Differential Electrolyte Resistance in a Conical Nanopore in Glass. ACS Nano 2012, 6, 6507–6514. [DOI] [PubMed] [Google Scholar]
- (41).Luo L; Holden DA; White HS Negative Differential Electrolyte Resistance in a Solid-State Nanopore Resulting from Electroosmotic Flow Bistability. ACS Nano 2014, 8, 3023–3030. [DOI] [PubMed] [Google Scholar]
- (42).Fåhraeus C; Grampp W Properties of Electrolyte-Filled Glass Microelectrodes: A Model Analysis. J. Neurosci. Methods 1997, 78, 29–45. [DOI] [PubMed] [Google Scholar]
- (43).Dukhin SS Electrokinetic Phenomena of the Second Kind and Their Applications. Adv. Colloid Interface Sci 1991, 35, 173–196. [Google Scholar]
- (44).Rubinstein I; Zaltzman B Electro-Osmotically Induced Convection at a Permselective Membrane. Phys. Rev. E Stat. Phys. Plasmas Fluids Relat. Interdiscip. Topics 2000, 62, 2238–2251. [DOI] [PubMed] [Google Scholar]
- (45).Ben Y; Chang HC Nonlinear Smoluchowski Slip Velocity and Micro-Vortex Generation. J. Fluid Mech 2002, 461, 229–238. [Google Scholar]
- (46).Squires TM; Bazant MZ Induced-Charge Electro-Osmosis. J. Fluid Mech 2004, No. 509, 217–252. [Google Scholar]
- (47).Kim SJ; Wang YC; Lee JH; Jang H; Han J Concentration Polarization and Nonlinear Electrokinetic Flow near a Nanofluidic Channel. Phys. Rev. Lett 2007, 99, 044501. [DOI] [PMC free article] [PubMed] [Google Scholar]
- (48).Gregersen MM; Andersen MB; Soni G; Meinhart C; Bruus H Numerical Analysis of Finite Debye-Length Effects in Induced-Charge Electro-Osmosis. Phys. Rev. E Stat. Nonlin. Soft Matter Phys 2009, 79, 066316. [DOI] [PubMed] [Google Scholar]
- (49).Park S; Yossifon G Induced-Charge Electrokinetics, Bipolar Current, and Concentration Polarization in a Microchannel-Nafion-Membrane System. Phys. Rev. E 2016, 93, 062614. [DOI] [PubMed] [Google Scholar]
- (50).Laohakunakorn N; Thacker VV; Muthukumar M; Keyser UF Electroosmotic Flow Reversal Outside Glass Nanopores. Nano Lett. 2015, 15, 695–702. [DOI] [PMC free article] [PubMed] [Google Scholar]
- (51).Bazant MZ In Encyclopedia of Microfluidics and Nanofluidics; Li D Ed.; Springer: New York, 2015; pp 2416–2426. [Google Scholar]
- (52).Dydek EV; Zaltzman B; Rubinstein I; Deng DS; Mani A; Bazant MZ Overlimiting Current in a Microchannel. Phys. Rev. Lett 2011, 107, 118301. [DOI] [PubMed] [Google Scholar]
- (53).Jin P; Mukaibo H; Home LP; Bishop GW; Martin CR Electroosmotic Flow Rectification in Pyramidal-Pore Mica Membranes. J. Am. Chem. Soc 2010, 132, 2118–2119. [DOI] [PubMed] [Google Scholar]
- (54).Laohakunakorn N; Keyser UF Electroosmotic Flow Rectification in Conical Nanopores. Nanotechnology 2015, 26, 275202. [DOI] [PubMed] [Google Scholar]
- (55).Yeh LH; Hughes C; Zeng Z; Qian S Tuning Ion Transport and Selectivity by a Salt Gradient in a Charged Nanopore. Anal. Chem 2014, 86, 2681–2686. [DOI] [PubMed] [Google Scholar]
- (56).Hill RW; Wyse GA; Anderson M Animal Physiology; Sinauer Associates: Sunderland, 2012. [Google Scholar]
- (57).Yossifon G; Mushenheim P; Chang YC; Chang HC Nonlinear Current-Voltage Characteristics of Nanochannels. Phys. Rev. E Stat. Nonlin. Soft Matter Phys 2009, 79, 046305. [DOI] [PubMed] [Google Scholar]
- (58).Cheng LJ; Guo LJ Ionic Current Rectification, Breakdown, and Switching in Heterogeneous Oxide Nanofluidic Devices. ACS Nano 2009, 3, 575–584. [DOI] [PubMed] [Google Scholar]
- (59).Schoch RB; Renaud P Ion Transport through Nanoslits Dominated by the Effective Surface Charge. Appl. Phys. Lett 2005, 86, 253111. [Google Scholar]
- (60).Karnik R; Fan R; Yue M; Li D; Yang P; Majumdar A Electrostatic Control of Ions and Molecules in Nanofluidic Transistors. Nano Lett. 2005, 5, 943–948. [DOI] [PubMed] [Google Scholar]
- (61).Stroock AD; Whitesides GM Controlling Flows in Microchannels with Patterned Surface Charge and Topography. Acc. Chem. Res 2003, 36, 597–604. [DOI] [PubMed] [Google Scholar]
- (62).Lagache T; Jayant K; Yuste R Electrodiffusion Model of Synaptic Potentials in Dendritic Spines. bioRxiv 2018, 274373. [DOI] [PMC free article] [PubMed] [Google Scholar]
Associated Data
This section collects any data citations, data availability statements, or supplementary materials included in this article.


