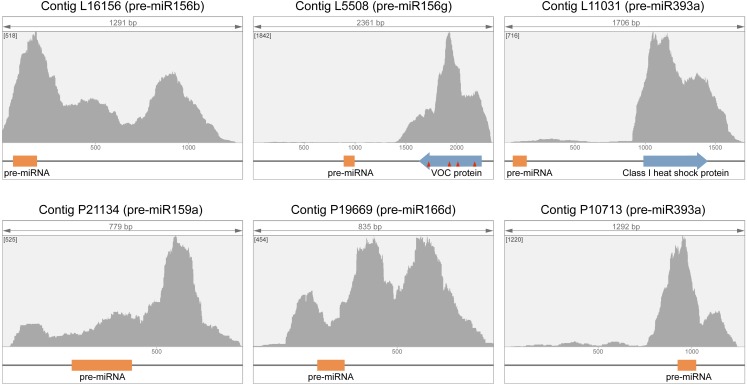
Figure 2. Analysis of primary reads distribution in contigs with highest average coverage (AC) value in leaf and phloem transcriptomes.
In presented graphs, the number of reads covering each contig position (Y axis) is plotted against the position in contig (X axis). Pre-miRNA regions are shown as orange boxes, ORFs are shown by blue arrows. Sites of splicing (exon–exon junctions) revealed by comparisons with respective genomic sequences are indicated by red triangles. The maximum coverage value for each graph is indicated in square brackets.

