Abstract
We describe the fabrication and characterization of an optical CO2 sensor based on the change in fluorescence lifetimes due to fluorescence resonance energy transfer from a pH-insensitive donor, sulforhodamine 101, to a pH-sensitive acceptor, either m-cresol purple or thymol blue, entrapped in an ethyl cellulose film. A phase transfer agent allows incorporation of the dyes and water into the film, while providing an initially basic environment for the acceptor. Diffusion of CO2 into the water entrapped in the film produced carbonic acid, causing a pH-dependent decrease in the spectral overlap of the acceptor absorbance with the donor emission, and decreased energy transfer, resulting in increased SR101 donor lifetimes. The lifetime changes were detected as a change in the phase of the emission, relative to the modulated excitation, and were insensitive to excitation intensities and emission signal levels. In addition to an externally modulated 442-nm light source, we excited the sensor with a directly modulated 635-nm laser diode and detected the anti-Stokes emission. The CO2 sensor is not fragile and can provide stable readings for weeks. The use of fluorescence resonance energy transfer, along with the simple entrainment procedure, allows facile change of the CO2 response range through change of the acceptor dye and the use of laser diode excitation sources.
The quantitative measurement of gaseous carbon dioxide is important in clinical health care and biomedical research. Previously, measurement of gaseous CO2 has been accomplished directly by infrared absorption (1) or by using a pH electrode to measure the change in pH resulting from CO2 dissolution in an aqueous solution, usually buffered with sodium bicarbonate (2). While direct absorption measurements produce quick response times, they require bulky and/or expensive excitation sources and typically are invasive, requiring direct sample access. In addition, absorption measurements can be affected by substances with optical density at the excitation wavelength. The alternate methodology requires a sodium bicarbonate solution, resulting in a bulky sensor with a slow response time. Additionally, the electrode is subject to the various drawbacks of the pH electrode, including temperature effects, slow response times, alkalinity and acidity errors, electrical resistance problems, liquid junction fouling, and reference electrode contamination (3). To avoid these drawbacks, optical CO2 sensors have been developed, initially relying on the pH-induced change in fluorescence intensity in a bicarbonate-buffered solution contained behind a gas-permeable membrane (4). While avoiding problems inherent in the pH electrode, they retain the drawbacks of a sodium bicarbonate buffer solution.
Recently, an optical pH sensor was developed that replaced the previously required sodium bicarbonate solution with a phase transfer agent (5). The phase transfer agent allowed a pH-sensitive dye to be incorporated into a hydrophobic cellulose film, along with the water required for production of carbonic acid and deprotonation of the dye. In addition, the phase transfer agent provided an initially basic environment. The range of CO2 concentration that could be measured with this system was less than that of a buffered system, but the range could be changed with different pH-sensitive dyes. The use of absorbance detection required the formation of films with a precisely defined thickness to overcome the need for individual sensor calibration.
We present a CO2 sensor based on the Mills et al. sensor, with an improved chemical system and detection methodology, demonstrated by Lakowicz et al. (6). In addition to the pH-sensitive dye, a fluorescent dye is also incorporated into the film, allowing more sensitive fluorescence detection to replace absorbance measurements. Importantly, fluorescence lifetimes, rather than intensities, are used to indicate CO2 concentrations. The operation of the sensor can be summarized as follows: CO2 diffusing into the sensor encounters the water associated with the phase transfer agent, producing an equilibrium concentration of carbonic acid, which lowers the local pH. This change in pH induces a color change in the pH-sensitive dye, decreasing the overlap of its absorbance spectrum with the emission spectrum of the fluorescent dye. This decrease in spectral overlap decreases the rate of fluorescence resonance energy transfer (FRET)2 from the excited fluorescent donor dye to the pH-sensitive acceptor dye, resulting in an increase of both the fluorescence intensity and lifetime (7). Previously, we have used FRET in a sol-gel film pH sensor (8), and this methodology has also been used in a CO2 sensor with a sodium bicarbonate buffer (6). FRET is a nonradiant energy transfer arising from dipole-dipole interactions. For the present sensors, the primary factors affecting the rate of energy transfer are the distance between the donor and acceptor and the overlap of the donor and acceptor spectra (9). The overlap of donor and acceptor is maximized by suitable choice of dyes; in the present case, the basic form of the acceptor dye is used. The average distance between donor and acceptor, and extent of energy transfer, is controlled by adjusting the concentration of the acceptor (10,11) and is usually in the range of 1–10 mM in solution, resulting in distances less than 40 Å. The donor concentration is less than that of the acceptor to prevent donor-donor FRET.
The increase in lifetime of the donor is detected in the frequency, rather than the time domain, as a change in the phase angle between the modulated excitation and the forced oscillation of the fluorescence (12). When excited by a modulated source, the emission will also exhibit modulation at the same frequency, but the finite lifetime of the fluorophore will introduce a phase shift (θ) and will also reduce the amount of the modulation (m) compared with the phase and modulation of the excitation light. Either the phase or the modulation can be used to determine the lifetime, although we have found the phase to be more insensitive to changes in the excitation and emission intensities. The present study reports the change in phase shift with a change in CO2. In addition, a modulated source is more easily achieved than a pulsed source.
The use of fluorescence detection, rather than absorbance, results in higher sensitivity, selectivity, and compatibility with laser excitation sources. Furthermore, use of lifetime measurements, rather than intensity measurements, avoids signal instability due to bleaching of the fluorophore, scattering or absorbance of the excitation light, or interference from other light sources, such as stray room light, which will affect the measured intensity of the fluorescence, resulting in false readings. Unlike an absorbance or fluorescence intensity measurement, the fluorescence lifetime is not affected by the thickness of the sensor film, allowing a simple coating methodology to be employed. In fact, a film is not required, allowing the sensor material to be applied to the end of single optical fibers or fiber-optic bundles. The sensor we present here demonstrates the feasibility of a lifetime-based optical CO2 gas sensor. Future development of a long-lifetime donor will permit the use of lower modulation frequencies, allowing a substantial reduction in the cost of electronics and the development of a simple to use CO2 sensor. We have previously developed an oxygen sensor based on phase detection of lifetimes (13) which is currently being commercialized by Process Technologies, Inc. (Ijamsville, MD). Through the use of a donor with a far red emission, sensing of CO2 could be performed subcutaneously, since skin is transparent to wavelengths in the range 600 to 1300 nm (14).
EXPERIMENTAL
Apparatus.
Absorption spectra were measured using a Hewlett-Packard 8452A UV/VIS diode array spectrophotometer (Palo Alto, CA). Fluorescence and lifetime measurements were performed on an ISS K2 multi-frequency phase fluorometer (Champaign, IL). The excitation source was a Liconix 4240 uv helium cadmium laser (Sunnyvale, CA) operated at the 441.6-nm line or a Toshiba TOLD9520 diode laser (Edison, NJ) mounted in an aluminum heat sink thermoelectrically maintained at 17°C with an ILX Lightwave (Bozeman, MT) Model LDT-5412 temperature controller. The diode laser was biased with 105 mA supplied by an ILX Lightwave (Bozeman) Model LDX-3412 precision current source. Modulation (1.0 dBm) was supplied by the Marconi Instruments (Allendale, NJ) Model 2022A signal generator provided with the ISS K2 fluorometer. Both the bias and modulation currents were applied to the laser diode through a Picosecond Pulse Labs (Boulder, CO) Model 5580 bias tee. Glass slides coated with the sensor film were placed against a glass fixture oriented at a 45° angle away from the detector in a 1-cm cuvette. Gas mixtures were supplied to the cuvette through a square rubber stopper, with inlet and outlet holes, fitted to the top of the cuvette. For response time measurements, increased rates of gas displacements were achieved by providing an outlet hole in the side of the cuvette. When using the HeCd laser, an Andover 500FH90–50S long-wave pass filter (Salem, NH), with a cutoff of 500 nm, was placed between the sample and detector. When using the diode laser, discrimination between the excitation and emission was provided by the Instruments, SA (Metuchen, NJ) Model H-10 monochromator (visible grating) supplied with the ISS K2 fluorometer. Scattered excitation was detected at 635 nm and the emission was detected at 602 nm, both using 16-nm slits. For both sources, the reference scattering solution consisted of du Pont Ludox HS-30 colloidal silica diluted with water and was attenuated using various Andover neutral density filters.
Materials.
All chemicals were from the Aldrich Chemical Co. or Sigma Chemical Co. and were used without further purification. The silicone rubber was General Electric Silicone II sealant, stock number GE 5000, obtained at a local hardware store. Glass substrates for the sensor slides were DESAG catalog number AF 45, obtained from Abrisa Industrial Glass (Ventura, CA). USP-grade carbon dioxide and NF-grade nitrogen were obtained from Potomac Airgas (Linthi-cum, MD). Mixtures of defined percentage CO2 composition were obtained by metering with a Series 150 two-tube gas blender from Advanced Specialty Gas Equipment Corp. (South Plainfield, NJ). Standard ±5% calibration charts were used to determine flow rates. The nitrogen gas was humidified before blending by bubbling through a water-filled reservoir. Buffer solutions used for the pH-dependent absorbance spectra were 80 mM N-[2-hydroxyethyl]piperazine-N’-[2-ethanesulfonic acid] for the pH range 6.0 to 6.8, tris[hydroxymethyl]aminomethane for the pH range 7.0 to 9.0, 2-amino-2-methyl-1-propanol for the pH range 9.2 to 10.6, and sodium bicarbonate for the pH range 10.8 to 11.0.
Procedure.
The CO2 sensors were prepared by mixing donor and acceptor dyes, along with a phase transfer agent and a plasticizer, with an ethyl cellulose (EC) solution, which was coated onto a glass slide. A silicone coating was subsequently added for sensors used in liquids. The sensor preparation is adapted from Mills et al. (5). A stock EC solution was prepared by dissolving 10 g EC in 20 ml ethanol and 80 ml toluene, giving a viscous solution with a density of 0.82 g/ml. Quantities of the EC solution were determined by weight instead of volume because of its viscous nature. The tetraoctylammonium hydroxide (TOAH) phase transfer agent solution was prepared as needed by adding 164 mg tetraoctylammonium bromide and 139 mg silver oxide to 0.6 ml methanol and 35 μl water. This solution was agitated for 30 min and then centrifuged to remove residual silver oxide. The acceptor dye solutions were prepared by dissolving either 12.0 mg thymol blue (TB) in 1.202 ml methanol and 548 μl of the previously prepared TOAH solution or 12.0 mg of m-cresol purple (MCP) in 1.250 ml methanol and 500 μl of the previously prepared TOAH solution. The donor dye solution was a 5.0 mM solution of sulforhodamine 101 (SR101) in methanol. The mixture used to prepare the sensor film consisted of 658 mg of the EC solution, 40 μl of the donor dye solution, 65.5 μl tributyl phosphate, 65.5 μl of the phase transfer agent solution, and 65.5 μl of the acceptor solution. These mixtures were coated onto the 0.022-inch-thick glass substrates by placing an excess of the mixture on the substrate and drawing the slide under a utility knife blade held fixed above the slide with appropriate spacers (a stack of three cover slips with a total thickness of about 0.027 inches), producing a wet film which dried to a thickness of approximately 0.001 inches, as determined by the difference in the thickness of the substrate and the coated substrate. Above thickness measurements were obtained with a micrometer. Films produced by the above method were thicker toward the edges of the substrate, as indicated by the darker color. All measurements were taken at the center of the film, away from the edges. The sensor slides were allowed to dry for about 20 min before storage in a humidor. The humidor consisted of a desiccator with damp cotton replacing the desiccant and provided 100% relative humidity. Sensors to be used in liquid were coated with a 1:4 volume to volume mixture of silicone resin in chloroform. As in the cellulose film, an excess of the silicone solution was placed on a sensor, and the substrate was quickly drawn under a utility knife blade fixed at about 0.026 inches above the sensor, producing a wet film about 0.004 inches thick which dried to a thickness of approximately 0.001 inches. After another drying period of 20 min, the coated sensors were placed in a humidor for storage.
RESULTS AND DISCUSSION
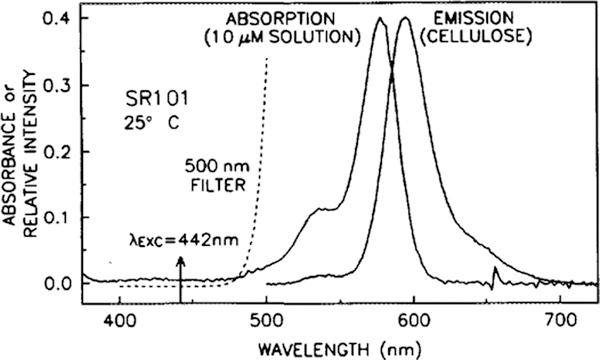
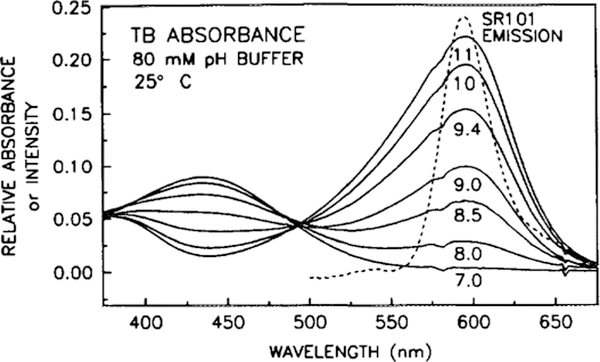
The absorption spectrum of SR101, obtained in methanol, and the emission spectrum, obtained in the EC matrix without the acceptor present, are shown in Fig. 1. Due to the thinness of the coating, absorption spectra of SR101 in the EC matrix had a low signal to noise. Included in this figure is the measured transmission spectrum of the Andover 500FH90–50S long-wave pass filter, which was used in obtaining both the fluorescence spectra and the phase angle and modulation measurements. The emission spectrum of SR101 in the EC matrix exhibits little change with changes in CO2 concentration (not shown). The pH-dependent absorption spectra of TB and MCP, taken in various buffer solutions, are shown in Figs. 2 and 3, respectively. For reference, the emission spectrum of SR101 is included in both figures. In solution, MCP exhibits a color change from yellow at pH 7.4 to purple at pH 9.0, while TB changes color from yellow to blue at the slightly more basic range of 8.0 to 9.6 (15). As the pH becomes more basic, the spectra indicate the appearance of a second species, with a maximum of 570 nm for MCP and 594 nm for TB, with isosbestic points of approximately 488 and 494 nm, respectively. The increased spectral overlap of the basic forms of the acceptor dyes with the emission of SR101 results in an increased rate of FRET, decreasing the fluorescence intensity and lifetime. Control measurements of the acceptor alone in the EC film indicate that TB has no detectable fluorescence, while MCP has a very weak fluorescence, which may result from the 10% impurity as commercially supplied. This weak fluorescence had detectable effects only in sensors with a high acceptor concentration and only at very low CO2 concentrations. Reducing the acceptor concentration reduced the interference below the limit of detection, due to the decrease in the amount of impurity fluorescence and the increase in donor fluorescence resulting from diminished quenching.
FIG. 1.
Absorption (in solution) and emission (in EC film) spectra of SR101. The dashed line shows the transmission profile of the 500-nm cutoff filter used in the emission and lifetime measurements.
FIG. 2.
Absorption spectra of the TB acceptor, obtained in various pH buffers, demonstrating the pH-dependent overlap with the emission spectrum of SR101 donor.
FIG. 3.
Absorption spectra of the MCP acceptor, obtained in various pH buffers, demonstrating the pH-dependent overlap with the emission spectrum of SR101 donor.
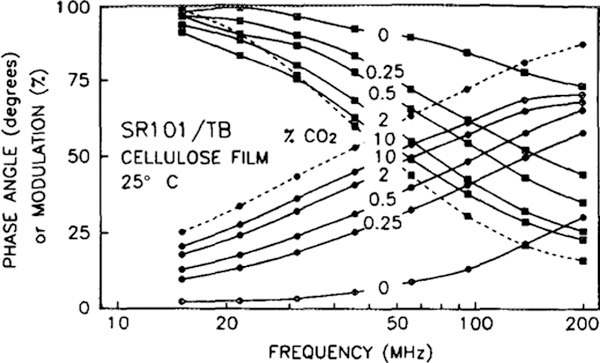
The phase and modulation response versus frequency at increasing CO2 concentrations is shown in Figs. 4 and 5 for the TB and MCP acceptors, respectively. For reference, the dashed line indicates the frequency response of a sensor produced without adding the acceptor solution. As expected, the response of this donor-only film exhibits no discernible phase change with CO2 concentration (not shown). As the CO2 concentration increases, the frequency response curves for the CO2 sensors shift to lower frequencies, indicating an increase in the mean lifetime. The lifetime dependence arises from the change in spectral overlap of the SR101 emission spectrum with the TB or MCP absorption spectrum, which affects the efficiency of FRET and thus the mean lifetime of the SR101. The lifetime change can be detected as a change in either the phase angle or modulation level of the fluorescence relative to the modulated excitation. The measurements presented in Fig. 5 are for a SR101/MCP sensor with twice the usual amount of acceptor, to demonstrate the previously mentioned effects of the weak MCP fluorescence. This interference is detectable only when CO2 levels are less than 0.5%, allowing the large concentration of acceptor to quench most of the donor fluorescence. Reducing the acceptor concentration by half reduced this interference below our levels of detectability (not shown), and subsequent measurements were performed with this sensor. Additionally, the modulation values were affected by a cyclic variation in the intensity of the HeCd laser used to obtain the data in Fig. 5 and by the method used by the ISS phase fluorometer of repetitively measuring first the sample and then a scattering reference. The time delay between measurements allows the intensity variation to be interpreted as a modulation variation. As shown later, the phase values do not vary with this cyclic intensity variation.
FIG. 4.
The frequency response of SR101 (dashed lines) and SR101/TB (solid lines) in EC film at increasing concentrations of CO2 in humid N2. Phase values are indicated with circles, modulation values with squares.
FIG. 5.
The frequency response of SR101 (dashed lines) and SR101/MCP (solid lines) in EC film at increasing concentrations of CO2 in humid N2. Phase values are indicated with circles, modulation values with squares. Note that data shown are for a sensor with twice the normal concentration of acceptor, to demonstrate the effect of excessive quenching on sensor response, especially at CO2 concentrations under 0.5%.
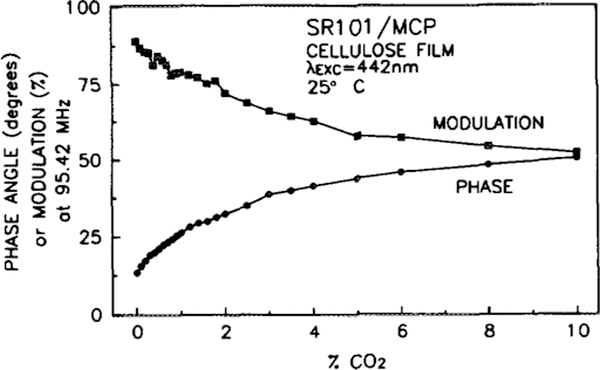
Optical CO2 sensing does not require measurement of the entire frequency range or both the phase and modulation. The phase and modulation data provide redundant information, and once characterized, phase measurements need only be made at one frequency. Typically, a fixed frequency is chosen which optimizes the response of the sensor. For a given modulation frequency, the phase angle increases with increasing CO2 concentration. The magnitude of this phase angle change with a change in CO2 concentration will increase with increasing modulation frequency, reach a maximum, and then decrease. For the SR101 donor, this maximum occurs in the range of 100 to 150 MHz. By measuring the phase angle at a series of CO2 concentrations, at a fixed frequency, a calibration curve can be generated. Figure 6 is the calibration curve for the SR101/TB sensor, taken at a frequency of 138 MHz, and Fig. 7 is the calibration curve for the SR101/MCP sensor, taken at a frequency of 95 MHz. The SR101/TB sensor is more sensitive (phase angle change with CO2 concentration) to lower concentrations of CO2, giving a usable range of approximately 0 to 2% CO2. The SR101/MCP sensor is less sensitive, but has an expanded range of 0 to 5% CO2. The differences in range are due to the different pKa values for the acceptor dyes, since more CO2 gas is needed to produce the lower pH value required for the color change of the lower pKa acceptor dye. Since the acceptor dyes are simply mixed into the sensor matrix, and not covalently bound, facile substitutions of dyes and thus CO2 concentration ranges are possible. Similarly, facile change of donor dyes allows the use of solid-state light sources, which can be easily modulated (16). The maximum phase change can be increased somewhat by increasing the acceptor concentration, but results in increased quenching that reduces the amount of fluorescence and will eventually allow fluorescence from other species to interfere with the measurements. The acceptor concentration in the present SR101/MCP sensor has been adjusted to eliminate interferences while maximizing the phase change due to CO2.
FIG. 6.
Calibration curve for the SR101/TB CO2 sensor when excited with 442-nm light modulated at a frequency of 138.14 MHz. Phase values are indicated with circles, modulation values with squares.
FIG. 7.
Calibration curve for the SR101/MCP CO2 sensor when excited with 442-nm light modulated at a frequency of 95.42 MHz. Phase values are indicated with circles, modulation values with squares.
Since the response curves are not linear, the precision of the CO2 concentration determinations will vary with the concentration. With our current instrument, we can typically measure the phase to 0.2°. At low concentrations, the SR101/TB sensor would indicate a CO2 concentration change of about 0.002% with a change of 0.2°. At the upper end of this sensor’s range, a change of 0.2° would represent a change of 0.06% in the concentration measurement. For the SR101/MCP sensor, changes of 0.2° represent changes in the measured CO2 concentration of 0.01 and 0.09% at the lower and upper range limits.
The response times of the SR101/TB and SR101/ MCP sensors are shown in Figs. 8 and 9, respectively. The sensors were kept under a constant humid N2 gas flow of approximately 3.5 liters/min, with periodic addition of CO2 to produce a 2% concentration for the SR101/TB sensor and a 5% concentration for the SR101/MCP. The times at which the CO2 flow was started and stopped are indicated by arrows along the time axis. For the SR101/MCP sensor, the response time (10 to 90%) to increasing CO2 is approximately 4.5 s, and the response time (90 to 10%) to decreasing CO2 is approximately 8.5 s, with most of the increase resulting from longer equilibration times at low CO2 concentrations. For the SR101/TB sensor, these values are 7.1 and 19.2 s, respectively. The actual response times may be somewhat faster than those reported here, since they depend on the flow rate of the purge gas and the configuration of the sample chamber. Initial measurements with lower flow rates (approximately 0.85 liters/min) and an unimproved flow configuration resulted in longer response times. For the SR101/MCP sensor, increasing CO2 response time was about a second longer, and the decreasing CO2 response time was doubled. The small lag time between the flow changes and the sensor response is due to the dead volumes between the flow gauges and the sensor. If an application requires shorter response times, they could be achieved with a thinner sensor film or by exposing both sides of the film. The above measurements were performed with a sensor film coated on a glass substrate (one side exposed). Reducing the film thickness will not involve any recalibration, since the lifetimes depend on FRET between donor and acceptor, which varies with spectral overlap and concentration of the acceptor. Neither of these factors is affected by the film thickness. If detection had been based on the fluorescence intensity, the sensor would require recalibration upon any change in film thickness, since the intensity of the fluorescence depends on the quantity (film thickness) of fluorophore. Response times could also be decreased by reducing the amount of phase transfer agent in the sensor film, but this may reduce the long-term stability.
FIG. 8.
The phase response time, at 138.14 MHz, of SR101/TB in an EC film between 0 and 2% CO2 in humid N2. Arrows indicate CO2 concentration changes.
FIG. 9.
The phase response time, at 95.42 MHz, of SR101/MCP in an EC film between 0 and 5% CO2 in humid N2. Arrows indicate CO2 concentration changes.
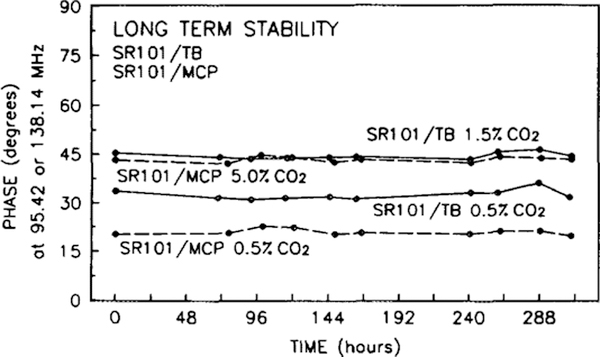
The stability of the CO2 sensors over a period of 2 weeks is shown in Fig. 10. Phase measurements were taken at 0.5 and 1.5% CO2 in humid N2 for the SR101/ TB sensor (solid line) and at 0.5 and 5.0% CO2 in humid N2 for the SR101/MCP sensor (dashed line). Both sensors were stored in a humidor between measurements. Variations in the phase are the result of varying placement of the sensor and excitation path in the instrument. Significantly, there is no general drift in the phase values. As the sensors age, there is a gradual fading of the blue color of the acceptor dye. If the sensors are not stored in a humidor, they will change color from blue to pink in 1 to 2 days. The color change is due to the acceptor dyes changing to the acidic form (yellow), which allows the fluorescence (pink) of the donor dye to predominate. This will result in a gradual increase in the phase value at a given frequency and CO2 concentration. The fading of the blue color is related to the amount of water in the film. Storage in the humidor will slow but not eliminate this fading. We have not made extensive studies of the effect of a hydrophobic coating on the long-term stability.
FIG. 10.
The long-term stability of the CO2 sensors. The solid lines show the phase angle, at 95.42 MHz, of the SR101/TB at 0.5 and 1.5% CO2 in humid N2. The dashed lines show the phase angle, at 138.14 MHz, of the SR101/MCP at 0.5 and 5.0% CO2 in humid N2.
Although we developed the present sensors to be used in the gas phase, they can be used in the liquid phase if hydrogen ions are excluded from the EC film, since slightly acidic solutions will cause a color change that will interfere with the change induced by CO2. A thin layer of silicone rubber coated on the sensor eliminates the pH response while retaining a response to dissolved CO2, although response times are increased. We present these data solely to demonstrate the feasibility of using this type of a sensor in the liquid phase, since the liquid-phase CO2 sensor is still under development. The calibration of a liquid-phase sensor will differ from that of a gas-phase sensor. N2 gas was bubbled in an 80 mM bicarbonate buffer solution, pH 10.0, for 1 h, and the phase of a silicone-coated SR101/MCP sensor was measured to be 20.5°. The solution was then bubbled with 5% CO2 in nitrogen gas, and the phase was then measured as 35.0°. Purging with pure N2 gave the original phase value. As expected, the response time of the silicone-coated sensor was longer than the uncoated version, but could be shortened by coating with a thinner layer of silicone or using a silicone that is more permeable to CO2.
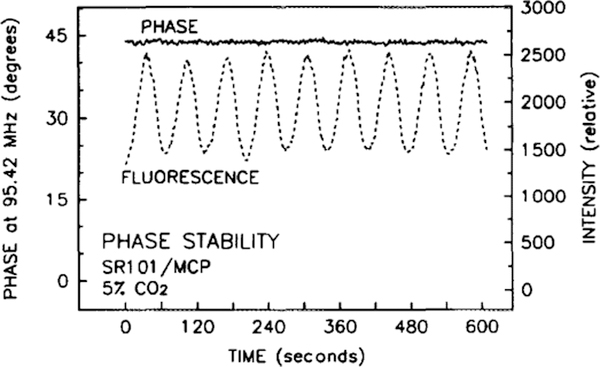
A significant advantage of using lifetime-based sensing over an intensity measurement is graphically shown in Fig. 11. The intensity of the fluorescence (dashed line) is oscillating with a time period of approximately 1 min, due to the same oscillation in the intensity of the helium-cadmium laser. This intensity oscillation can be correlated with the cadmium reservoir heater cycling on and off. If intensity was used to measure the CO2 concentration, then source variations would be erroneously interpreted as concentration variations. Although the source intensity varies by 40%, there is no correlated variation in the phase, dramatically demonstrating the advantage of lifetime measurements over intensity measurements. Sensing in environments that scatter light, such as a bioreactor or a subcutaneous implant, precludes the use of absorbance or fluorescence intensity-based methods, since ratiometric detection cannot correct for the scatter.
FIG. 11.
Comparison of the variation in the phase angle (solid line) and the fluorescence intensity (dashed line) of the SR101/TB sensor to changes in the excitation intensity. Excitation intensity varied with the cycling of the laser’s cadmium reservoir heater.
The instrument used to obtain the phase and modulation data presented here is bulky and expensive, since it is variable frequency and relies on externally modulating a HeCd laser or xenon arc lamp. We have shown that once a sensor is characterized, it can be used with a fixed frequency of modulated excitation light, which will allow the excitation and detection electronics to be simpler and less expensive. We now present data obtained from the same SR101/MCP CO2 sensor previously described, with excitation by a directly modulated 635-nm laser diode. By using a laser diode for excitation, the need for a large and expensive rf amplifier driving a Pockel’s cell to modulate the excitation light is avoided. In addition, laser diodes are smaller and much less expensive than other lasers and require much less power to produce the same intensity of modulated light (17). For example, with a 7.3-mW output from the HeCd laser, only 15 μW of modulated blue light is available after the Pockel’s cell (70% modulation at 25 MHz). Since the output of a laser diode is directly modulated, all of the light output is available.
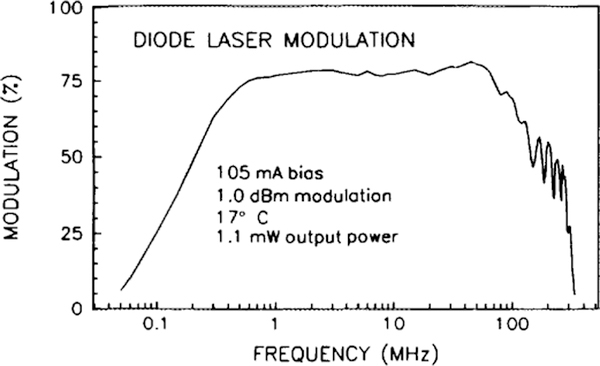
The amount of modulated light provided by a Toshiba laser diode at different modulation frequencies is shown in Fig. 12. The diode laser was biased to provide 1.1 mW of output power, and a sine wave modulation was superimposed on this bias current using the output of a frequency generator. Although a greater percentage modulation could be obtained by increasing the output of the frequency generator, the waveform would visually distort from a pure sine wave when viewed with a fast photodiode and oscilloscope. The modulation level dropped off at lower frequencies because of the frequency response of the bias tee and dropped off with oscillations at higher frequencies due to the frequency response of the detection photomultiplier tube. The diode laser was z mounted in a heat sink that was thermoelectrically maintained at 17.0°C. Although cooler temperatures g would lower the threshold even further, this temperature avoided the possibility of condensation on the output window, which would result in destruction of the laser diode. Operating at this temperature shifted the threshold from the rated 118.9 mA at 25.0°C to 99.7 mA and increased the efficiency from 0.2 to 0.25 W/A. Since the modulation level depends upon the optical output provided by the bias current, maintaining a stable threshold is necessary to avoid changes in the percentage modulation provided by the laser diode. Although the manufacturer states that no active cooling is required, we found that when the laser diode was mounted in a 2” × 2” × 0.25” aluminum heat sink, the lifetime of the laser diode was reduced to under 20 h. We have not experienced a failure since actively cooling the heat sink.
FIG. 12.
Modulation of the opt ical output of the 635 nm laser diode by application of a sine wave to the bias current. The-3-dB bandwidth is approximately 0.15 to 275 MHz.
The absorbance spectrum of a 2.5 μM solution of SR101 in methanol is shown in Fig. 13. Also included in the figure are the emission spectra of a 50 μM methanol solution of SR101 when excited with a 635-nm laser diode (solid line) and a 442-nm HeCd laser (dashed line). For reference, the dotted line shows the spectrum of the scatter of the laser diode from a Ludox solution. A small peak due to scatter of the 635-nm excitation light is also present in the red-excited SR101 emission spectrum. All emission spectra were obtained with 4-nm slits. It can be seen that there is little difference in the emission spectrum whether excitation is with red or blue light. When excited with blue light, the excited states populated quickly decay through interactions with solvent molecules to the ground vibrational state of the first excited electronic state. Red excitation will also populate this same state, although the molecules excited will not be in the same ground state as most of those excited by blue light. Only molecules that are solvated in a fashion that produces a relatively low energy difference between the ground and excited state absorb the red light. The fraction of these molecules in the ground state is low, because of the Boltzmann distribution of molecules in the energy levels of the ground state. The energy required for the anti-Stokes emission is obtained from the molecular motions of the solution. Thus, the emission obtained with red excitation replicates that obtained with blue excitation. Although the normalized spectra are essentially the same, the intensity of the emission when excited with blue light is much greater than the intensity of the emission when excited with red light, due to the larger population, as demonstrated by the larger extinction coefficient at the blue wavelength.
FIG. 13.
Absorbance spectrum of a 2.5 μM methanol solution of SR101, along with the emission spectrum of a 50 μM solution obtained with 635-nm laser diode excitation (solid line) and 442-nm excitation (dashed line). Included is the spectrum of the laser diode emission scattered with Ludox colloidal silica (dotted line).
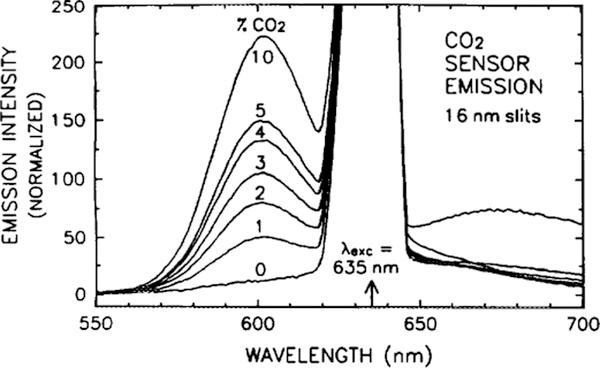
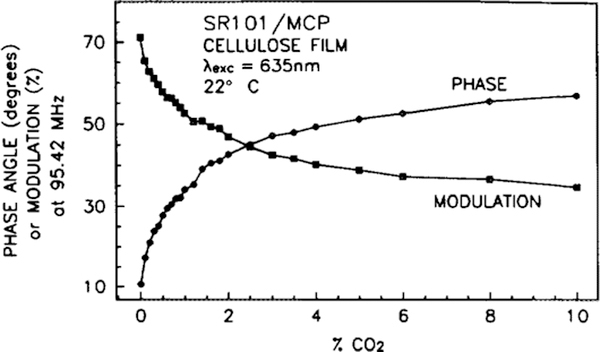
Figure 14 demonstrates the quenching of the anti-Stokes SR101 fluorescence by the pH-dependent overlap with the acceptor absorbance. The spectra were obtained with 635-nm diode laser excitation, with 16-nm emission slits. Note that most of the emission is to the blue of the excitation. As the emission intensity is quenched, there is also a reduction in the lifetime of the SR101. In a fashion analogous to the blue excitation, a calibration curve can be generated at a fixed frequency, shown in Fig. 15. The phase and modulation of the emission at 600 nm were measured relative to scattered excitation light at 635 nm, with the excitation modulated at 95 MHz. Once the sensor has been calibrated, only the emission at 600 nm need be detected, since the phase can be determined relative to the electrical signal applied to modulate the laser diode. Thus, a monochromator would not be required, but could be replaced with a less-expensive optical filter. Since the detection wavelength is close to the excitation, a thin film interference filter would be required to provide the necessary discrimination.
FIG. 14.
Emission spectra of the CO2 sensor, at various concentrations of CO2 gas, when excited with a 635-nm laser diode. The peak from the scatter of the excitation light has been normalized to a maximum value of 1000.
FIG. 15.
Calibration curve for the SR101/MCP CO2 sensor when excited with a 635-nm laser diode modulated at a frequency of 95.42 MHz. Phase values are indicated with circles, modulation values with squares.
CONCLUSION
We have demonstrated an optical CO2 sensor based on the principle of FRET with frequency domain lifetime detection. Entrapment of the donor and acceptor dyes, rather than covalently bonding the dyes, allows facile substitution of acceptor dyes to change detection ranges and substitution of donor dyes to utilize various excitation sources. The use of FRET removes the limitation that the fluorescent dye must also be sensitive to changes in pH. The sensors are easily fabricated from inexpensive materials and are not fragile. Unlike colorimetric or fluorescence intensity-based detection, formation of a uniform thin coat is not required, since fluorescence lifetimes are not affected by sensor thickness. This allows the sensor film to be easily applied to a variety of substrates, including optical fiber tips. The sensitivity of fluorescence lifetime detection permits a thin sensor film, reducing response times to seconds for full-range response. We have shown that the sensors are stable for at least 2 weeks if stored in a humid environment. The sensor can be used in liquids if coated with a thin layer of silicone to eliminate the interfering response to pH. Future development of far-red-emitting long-lifetime donors will allow subcutaneous sensing of CO2 with inexpensive low-frequency electronics. These sensors may also be suitable for measurement of patient respiration and for bioprocess applications.
ACKNOWLEDGMENTS
This work was supported by grants (BCS-9209157, BES-9413262, and BCS-9157852) from the National Science Foundation, with support for instrumentation from the National Institutes of Health Grants RR-08119 and RR-07510. Additional funding was provided by Artisan Industries, Inc. and Genentech, Inc.
2. Abbreviations used:
- SR101
sulforbodamine 101
- MCP
m-cresol purple
- TB
thymol blue
- TOAH
tetraoctylammonium hydroxide
- EC
ethyl cellulose
- FRET
fluorescence resonance energy transfer
REFERENCES
- 1.Patel M. (1990) Chem. Br 26, 640. [Google Scholar]
- 2.Severinghaus JW, and Bradley AF (1958) J. Appl. Physiol 13, 515–520. [DOI] [PubMed] [Google Scholar]
- 3.McMillan GK (1991) Chem. Eng. Prog 87, 30–37. [Google Scholar]
- 4.Lubbers DW, and Opitz N. (1975) Z. Naturforsch. C 30, 532–533. [PubMed] [Google Scholar]
- 5.Mills A, Chang Q, and McMurray N. (1992) Anal. Chem 64, 1382–1389. [Google Scholar]
- 6.Lakowicz JR, Szmacinski H, and Karakelle M. (1993) Anal. Chim. Acta 272,179–186. [Google Scholar]
- 7.Bojarski C, and Sienicki K. (1989) in Photochemistry and Photophysics, Vol. 1 (Rabek JF, Ed.), pp. 1–57, CRC Press, Boca Raton, FL. [Google Scholar]
- 8.Bambot SB, Sipior J, Lakowicz JL, and Rao G. (1995) Sens. Actuators B 22, 181–188. [Google Scholar]
- 9.Lakowicz JR (1983) Principles of Fluorescence Spectroscopy, Plenum Press, New York. [Google Scholar]
- 10.Bennett RG (1964) J. Chem. Phys 41, 3037–3040. [Google Scholar]
- 11.Eisenthal KB, and Siegel S. (1964) J. Chem. Phys 41, 652–655. [Google Scholar]
- 12.Lakowicz JR, and Balter A. (1982) Biophys. Chem 16, 99–115. [DOI] [PMC free article] [PubMed] [Google Scholar]
- 13.Bambot SB, Holavanahali R, Lakowicz JR, Carter GM, and Rao G. (1994) Biotechnoi Bioeng 43, 1139–1145. [DOI] [PubMed] [Google Scholar]
- 14.Anderson RR, and Parrish JA (1982) in The Science of Photomedicine (Regan JD, and Parrish JA, Eds.), pp. 147–194, Plenum Press, New York. [Google Scholar]
- 15.Green FJ (1990) The Sigma-Aldrich Handbook of Stains, Dyes and Indicators, Aldrich Chemical Co., Milwaukee, WI. [Google Scholar]
- 16.Holavanahali R, Carter G, Bambot S, Rao G, Bierlein JD, and Lakowicz JR Lasers and Electro-Optics Society Annual Meeting Conference Proceedings, October 31-November 3, 1994, pp. 232–233, IEEE, Boston, MA. [Google Scholar]
- 17.Thompson RB, Frisoli JK, and Lakowicz JR (1992) Anal. Chem 64, 2075–2078. [DOI] [PMC free article] [PubMed] [Google Scholar]


