

SUMMARY
Cell growth is a complex process in which cells synthesize cellular components while they increase in size. It is generally assumed that the rate of biosynthesis must somehow be coordinated with the rate of growth in order to maintain intracellular concentrations. However, little is known about potential feedback mechanisms that could achieve proteome homeostasis, or the consequences when this homeostasis is perturbed. Here, we identified conditions in which fission yeast cells are prevented from volume expansion but nevertheless continue to synthesize biomass, leading to general accumulation of proteins and increased cytoplasmic density. Upon removal of these perturbations, this biomass accumulation drove cells to undergo a multi-generational period of “supergrowth” in which rapid volume growth outpaced biosynthesis, returning proteome concentrations back to normal within hours. These findings demonstrate a mechanism for global proteome homeostasis based on modulation of volume growth and dilution.
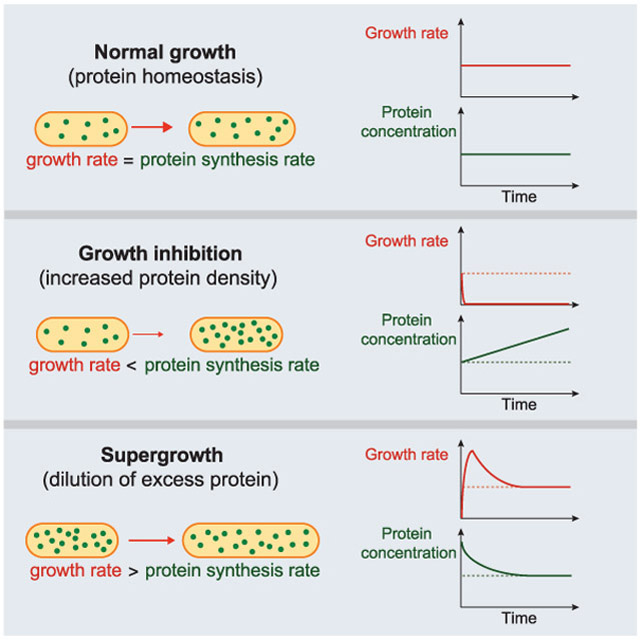
Graphical Abstract
Blurb
During cell growth, rates of protein synthesis and cellular expansion must somehow be coordinated to maintain global protein concentrations. We find in fission yeast that upon inhibition of volume growth, protein biosynthesis nevertheless continues, leading to global accumulation of proteins and increased cellular density. Upon release of growth inhibition, cells exhibit abnormally accelerated growth (supergrowth), which dilutes the excess protein. These phenomena demonstrate a proteome homeostasis mechanism based upon cell growth regulation.
INTRODUCTION
Proliferating cells generally increase their biomass and volume during the cell cycle before dividing. Although much is understood about how duplication of certain cellular components such as the chromosomes is accomplished, much less is known about how the proteome itself is duplicated. The concentrations of many proteins are thought to be maintained during cell growth (Newman et al., 2006; Schmoller et al., 2015; Zhou et al., 2015). While global mechanisms of proteome homeostasis have been identified (You et al., 2013), it is unknown the extent to which the concentrations of individual proteins are coordinated with cell volume (Padovan-Merhar et al., 2015), whether this coordination can be altered, and the effects of such a perturbation.
The rate of cellular growth, which we define here as the increase of cellular volume, is determined by numerous factors. The biosynthesis of cellular components has been speculated to set growth rate, as decreasing protein translation, for instance, can slow or halt growth. The rate of cellular growth is also affected by cell size; many organisms, including bacteria, fungi, and mammalian cells, exhibit exponential growth (Tzur et al., 2009; Willis and Huang, 2017) in which the absolute growth rate at steady-state is proportional to cell size. Although the mechanism(s) for achieving exponential growth remains to be determined, it may arise from the scaling of the biosynthetic machinery with cell size: if protein synthesis is coupled to cell size, and cell size is dictated by protein concentration, then exponential growth will result.
The fission yeast Schizosaccharomyces pombe is an established model for cell-cycle regulation and growth. The simple, rod-shaped morphology and regular growth and division patterns of these cells make them highly amenable to quantitative studies. During their cell cycle, S. pombe cells exhibit polarized tip growth at one or both cell tips during interphase (Abenza et al., 2015; Chang and Martin, 2009), and growth halts during mitosis and cytokinesis (Atilgan et al., 2015; Mitchison and Nurse, 1985). Like other tip-growing cells, the growth of the cell surface is directed by polarity machinery that ultimately mediates remodeling and insertion of new cell wall at the cell tips. Growth of the surface is further impacted by mechanical factors, such as the turgor pressure due to osmolyte concentration imbalances across the membrane that expands the elastic cell wall (Abenza et al., 2015; Atilgan et al., 2015). While exponential volume growth at the single-cell level has been observed in many cell types, whether individual fission yeast cells exhibit such behavior has been a source of controversy for decades; the current consensus is a bilinear growth behavior with an increased slope later in the cell cycle (Baumgartner and Tolic-Norrelykke, 2009; Cooper, 2006; Horvath et al., 2013, 2016; Mitchison and Nurse, 1985; Sveiczer et al., 1996).
Biomass synthesis (largely driven by protein synthesis) and volume increase (driven by membrane and cell-wall synthesis) are assumed to be coordinated during growth, but it is unknown how this fundamental coupling is achieved. Here, we present multiple ways of uncoupling the coordination between biomass and volume in S. pombe cells, and thus provide new insights into the role of proteome homeostasis in cell growth. We first establish that fission yeast cells exhibit cell size-dependent, exponential growth for a large fraction of the cell cycle. Through manipulation of turgor pressure or secretion, we decouple the rate of global protein synthesis from growth rate. These conditions produce a global excess of proteins within the cytoplasm, which in turn results in an extended period of extremely rapid growth. These findings thus provide new insights into the role of cytoplasmic density in cell growth and proteome homeostasis, whereby the rapid expansion of dense cells accelerates the re-equilibration of protein concentrations.
RESULTS
Fission yeast cells grow exponentially during a large fraction of the cell cycle
To determine the growth behavior of individual S. pombe cells, we imaged cells in time lapse in microfluidic chambers and implemented automated image analysis methods to quantify cellular dimensions at subpixel resolution (Figure 1A, S1A; STAR Methods). In agreement with previous studies, these rod-shaped cells elongated from ~8 μm to 14 μm before entering mitosis (Figure 1B, S1B), and maintained a constant width of ~4 μm (Figure 1B, S1C). Instantaneous growth rates (defined as dL/dt, where L is cell length) of wild-type cells ranged from 2-5 μm/h at 30 °C (Figure 1C), with cell length highly correlated with elongation rate, indicating that growth rate accelerates during the cell cycle. In purely exponential growth, absolute growth rate scales linearly with cell size, hence (size-normalized growth rate) is a constant. Quantification of revealed that fission yeast growth during the cell cycle is organized into at least three phases (Figure 1C): (I) growth acceleration for the first ~10-20% of the cell cycle (immediately after cell separation), (II) exponential growth for the majority of interphase (Figure S1D), in which = 0.35 ± 0.06 h−1 (corresponding to doubling biomass during interphase in 2.0±0.3 h), and (III) deceleration to zero growth in mitosis and cytokinesis. These data are inconsistent with simple linear or bilinear growth models (Figure S1E,F). We further tested the effect of cell size on growth rate by analyzing abnormally large cells (cdc25-22 cells at the semi-permissive temperature 30 °C, which divide at 30±4 μm in length). These large cells grew much faster than wild-type cells and followed a similar scaling of single-cell elongation rate with size, with a size-normalized growth rate of 0.30 ± 0.05 h−1 (Figure 1D, S1G,H). These findings establish exponential growth behavior in fission yeast, with absolute growth rates that scale with cell size over a wide range of volumes.
Figure 1: S. pombe cells grow exponentially.

A) Wild-type (WT) fission yeast cells imaged in phase contrast. Green outlines were obtained via automated segmentation (STAR Methods). Manual inspection revealed that segmentation was accurate for virtually all cells, regardless of cell crowding.
B) Population-averaged length and width of growing fission yeast cells, measured as a function of time after the mechanical separation of daughter cells after septation normalized by cell-cycle time (n = 1129 cells). Solid lines and shaded areas represent the mean ±1 standard deviation (S.D.). Cell width was essentially invariant, while length increased over the cell cycle until the cell reaches the division length of ~14 μm.
C) Instantaneous size-normalized growth rate of wild-type cells, as a function of normalized cell-cycle time as in (B). The size-normalized growth rate was constant for a large fraction of the cell cycle, signifying growth proportional to size (exponential growth). Cells had three phases of growth: (I) super-exponential acceleration, (II) steady-state exponential growth, and (III) deceleration as cells approach mitosis. Shading represents ±1 S.D. (n = 1129 cells).
D) Instantaneous growth rate dV/dt increases with cell size. The trend for wild-type (WT) cells (blue) continued for cdc25-22 cells (red), which are substantially longer. Black lines represent best linear fits for each strain (wildtype, n=1129 cells; cdc25-22, n=246 cells). Error bars are ±1 S.D.
Cells grow slowly during oscillatory osmotic shocks, and exhibit super-fast growth upon exit from oscillations
In terms of the mechanics of cell growth, internal turgor pressure provides physical force for expansion of the cell wall to increase cellular volume. Fission yeast cells have a thick (~200 nm), elastic cell wall inflated by high turgor pressures of ~1.5 MPa (15 atm) (Atilgan et al., 2015; Chang et al., 2014). Examining the effects of adding the osmotic agent D-sorbitol (hereafter sorbitol) to the media has proven useful for probing the mechanical effects of reducing turgor pressure (Atilgan et al., 2015; Basu et al., 2014; Minc et al., 2009; Proctor et al., 2012). We investigated the effect of mechanical perturbations on cell growth using osmotic oscillations in repeated cycles of hyper- and hypoosmotic shocks (STAR Methods) (Rojas et al., 2014). We exposed S. pombe cells in a microfluidic device to repeated switches between rich medium (YE5S) and YE5S+0.5 M D-sorbitol (Figure 2A, S2A). In these initial experiments, we applied 24 oscillatory cycles of 0.5 M sorbitol shocks with a 10-min period for 4 hours, then subsequently followed cells in YE5S media without sorbitol. Each acute addition of 0.5 M sorbitol caused rapid water efflux, loss of turgor pressure, and shrinkage in volume by ~20%, with mean longitudinal and radial contractions of 3.5% and 7%, respectively (Figure 2B) (Atilgan et al., 2015). During each 5-min hyperosmotic period, cells partially re-inflated (Figure 2B), dependent on osmotic adaption mechanisms (Figure S2B). Upon hypoosmotic shifts back to YE5S medium without sorbitol, cells rapidly returned to their normal width in the absence of shocks (Figure 2B, S2B), suggesting that S. pombe cells can rapidly downregulate turgor pressure to a preferred value when envelope stresses increase above a certain point.
Figure 2: Exit from osmotic shock oscillations induces robust supergrowth.

A) Cells were equilibrated to achieve steady-state growth in YE5S, and then exposed to cycles of hyperosmotic and hypoosmotic shocks with 500 mM sorbitol, with 5 min between shocks.
B) The length of a representative wild-type (WT) cell increased more rapidly during periods in YE5S+500 mM sorbitol, but returned to the value expected of growth in YE5S after hypoosmotic shocks. Width increased in YE5S+500 mM sorbitol, and was maintained at an approximately constant level in YE5S.
C) Lengths (top) and instantaneous growth rates (bottom) of wild-type cells (n = 45) before, during (yellow shading), and after 24 cycles of 0.5-M sorbitol osmotic shock oscillations with 10-min period. Cells are the same color in both plots. Cells were imaged every 5 min. After the oscillations, cells exhibited faster growth (supergrowth) for multiple generations. Traces that begin at later times points are newly formed daughter cells.
D) Size-normalized growth rates of wild-type cells throughout an oscillatory osmotic shock experiment (red, n = 973 cells). Growth rate during oscillations (yellow, dashed box) was lower than the control that was kept in YE5S throughout (blue, n = 1242). Growth rate increased after cells exited the oscillations, decreasing back to the control growth rate with a time constant of 1.3 h. Shaded bars represent ±1 S.D.
Over the course of 4 hours of these osmotic cycles, cells remained viable and continued to grow and divide (Movie S1, Figure S2C). However, the mean growth rate was lower than that of control cells: growth initially slowed (Figure 2C) for the first ~2 h (to <0.06 h−1, Figure 2D), followed by adaptation to the oscillations after ~3 h that resulted in a size-normalized growth rate increase to ~0.2 h−1 (Figure 2D). When cells were returned after the cycles of osmotic oscillations to YE5S without any sorbitol, they grew unusually fast, with tip growth rates sometimes >8 μm/h (population mean 6.5±0.9 μm/h), almost two-fold higher than mean control tip growth rates (3.8 μm/h, Figure 2C); we refer to this period of unprecedented rapid growth as “supergrowth.” Size-normalized growth rates indicated that cells were growing abnormally rapidly for their size ( = 0.6 h−1 vs. 0.35 h−1 for control cells, Figure 2D). These growth behaviors were highly stereotypical throughout the population (>96% cells, 49/51; Figure S2D), and were substantially faster than any previously reported growth rates for fission yeast. Acceleration began by 15 minutes after exit from oscillations (Figure 2C), and growth rate reached a peak just before cells entered mitosis (Figure 2C, S2E). Elevated growth rates persisted for 2-3 generations (~4 hours, Figure 2C,D, S2F), but in each cell cycle, the rate decreased in a stepwise manner from the previous generation even though cells still exhibited exponential growth (Figure S2F). Growth still decelerated normally during mitosis and cytokinesis (Figure S2F). Interestingly, the initial acceleration phase of the cell cycle (Figure 1C) was largely absent during supergrowth (Figure S2F), suggesting that cells were primed for exponential growth immediately after division.
Despite the large changes in growth rate during and after the oscillations, cell morphology and size were remarkably normal. Cells exhibited tip growth during interphase without large changes in cell width or tip shape (Figure S2G,H). Importantly, cells entered mitosis at the normal cell length of 14 μm during oscillations and during supergrowth despite a > 10-fold range in growth rates, demonstrating that changes in growth rate did not affect cell-size control (Figure 3A). During supergrowth, cell-cycle periods were shorter because due to a decrease in the duration of interphase (Figure 3B), but the durations of mitosis and cytokinesis were normal (Figure 3C), indicating that not all cellular processes were sped up. These data suggest that cell size and the periods of cell division are controlled independently of growth rate.
Figure 3: Cell size and cell-division periods are maintained during and after osmotic shock oscillations.

A) Cell-size control was unaffected by oscillations or supergrowth, with constant length (top) and width (bottom) at the time of division throughout the experiment in (C). Error bars represent ±1 S.D. (n = 973 cells).
B) Effect of oscillations on cell-cycle periods. Mean cell-cycle duration (including mitosis) were shorter than wild-type during supergrowth and progressively returned to normal after osmotic shock oscillations. The first generation of supergrowth represents cells that divided within 15 min of exit from oscillations (n = 10 cells). Number of cells n (generation): 146 (2nd), 194 (3rd), 298 (4th), 929 (control).
C) Oscillations do not affect cell-division periods. Durations of mitosis and cytokinesis were constant during supergrowth. Images were acquired every 1 min, and mitosis and cytokinesis were defined based on the onset of growth arrest and completion of septation, respectively. Number of cells n (generation): 31 (1st), 34 (2nd), 53 (control). These data show that cell-cycle periods in (B) were altered because of differences in the duration of interphase only. The normal rate of cell-wall synthesis during septation further indicates that not all cell-wall synthesis was accelerated during supergrowth.
To determine the requirements for supergrowth, we examined its dependence on oscillation parameters (amplitude, period, number of periods). We systematically varied each parameter, keeping the other two parameters fixed. In general, the maximal supergrowth rate increased gradually with increasing amplitude, period, or number of periods, plateauing at ~0.6 h−1 (Figure 4). Single shocks were generally not sufficient (Figure 4A). During long-term osmotic oscillations (48 periods, Fig. 4B) under moderate shock amplitude (500 mM), cells were able to acclimate to a low steady-state size-normalized growth rate, which reduced the magnitude of supergrowth. Oscillations with 1 M sorbitol, which caused ~50% volume loss, resulted in a near-cessation of growth during oscillations, but then subsequently led to rapid supergrowth (Figure 4C), with some cells transiting through all oscillations into supergrowth without dividing (Figure S2I). These data suggest that growth and cell-cycle progression during oscillations are not required for supergrowth. The graded effects suggest that the rapid growth state is not regulated by an all-or-nothing switch, but rather accumulates over time during the osmotic shifts until reaching a maximum of ~0.6 h−1.
Figure 4: Maximal supergrowth rates increase with oscillation parameters.

A) Maximal size-normalized growth rates during supergrowth as a function of oscillatory shock period length, while the sorbitol concentration (0.5 M) and number of periods (12) were held fixed. Blue dot (asterisk) represents control experiment without oscillations. Error bars are ±1 S.D. (n = 46-325 cells per data point, 811 total).
B) Maximal size-normalized growth rates during supergrowth as a function of the number of periods, while the sorbitol concentration (0.5 M) and length of each period (10 min) were held fixed. Red circle represents our standard conditions of 24 cycles of 500-mM shocks with 10-min period. Error bars are ±1 S.D. (n =151-536 cells per data point, 1752 total ).
C) Maximal size-normalized growth rates during supergrowth as a function of sorbitol concentration, while the number of periods (24) and length of each period (10 min) were held fixed. Red circle represents our standard conditions of 24 cycles of 500-mM shocks with 10-min period. Error bars are ±1 S.D. (n = 67-536 cells per data point, 1128 total).
Supergrowth is independent of established osmotic stress and growth pathways
To probe the mechanism underlying supergrowth, we considered two non-exclusive models. The first model involves the osmotic stress-response pathway, which could signal to growth pathways to regulate growth rate. The second model is based on material storage, in which components important for growth accumulate during periods of slow volume expansion because biosynthesis does not slow commensurately with growth rate. The excess of these materials upon exit from oscillations could then drive the subsequent supergrowth.
As an initial test of the signaling model, we assayed various mutants for their ability to undergo supergrowth. We assessed strains lacking Sty1 and Pmk1 (MAP kinases at the hub of the pathways that regulate response to osmotic, cell-wall, and other environmental stresses) (Chen et al., 2003; Sanchez-Mir et al., 2014); Gpd1, which regulates glycerol synthesis during turgor adaptation to osmotic stresses (Chen et al., 2003; Minc et al., 2009); and Cch1, a calcium channel involved in response to cell-wall stresses (Ma et al., 2011). We also queried regulators in the TOR pathway, a central regulator of growth: Ssp2 (an AMPK-like protein kinase that regulates TORC1 activity) (Davie et al., 2015; Schutt and Moseley, 2017) and Gad8 (an AGC protein kinase effector of TORC2) (Ikeda et al., 2008). All of these mutants exhibited supergrowth responses similar to that of wildtype after oscillatory osmotic shock (Figure S2J). Ribosomal mutants with slower basal growth rates showed a proportional supergrowth response (Figure S2J). Thus, these signaling pathways regulating cellular responses to stress, turgor, and growth are not required for supergrowth.
The proteome globally increases in concentration during osmotic oscillations
The material storage model predicts that components important for growth rise in concentration during oscillations. As an initial test, we monitored a fluorescent protein marker, E2-mCrimson expressed from the ACT1 (actin gene) promoter. E2-mCrimson is stable and folds relatively rapidly (Al-Sady et al., 2016), with a degradation rate within experimental noise (Figure S3A). Under normal growth, mCrimson intensity remained approximately constant throughout the cell cycle (Figure S3B), indicating that this marker is produced at a rate proportional to volume growth rate (Figure S3C), the expected behavior for many native proteins. By contrast, during osmotic oscillations, mCrimson fluorescence concentration increased, rising linearly to ~50% above normal levels after 4 h of 10-min, 500-mM oscillations (Figure 5A-C, S3D). When cells entered supergrowth, mCrimson intensity progressively decreased back to wild-type levels over 2-3 generations (Figure 5A-C), similar to the time scale for restoration of normal growth rates.
Figure 5: Osmotic-shock oscillations disrupt coupling between protein synthesis and cell size.

A) Representative time-lapse images of mCrimson-expressing cells before, during, and after 24 10-min periods of 0.5-M sorbitol osmotic shocks. Fluorescence intensity increased during oscillations, and then gradually reverted to pre-shock levels during supergrowth.
B) Representative trajectories of integrated cellular fluorescence before, during, and after oscillations (n =54 cells). Synthesis of mCrimson continued relatively unabated during oscillations. The yellow box in this and subsequent panels denotes the 24 10-min periods of 0.5-M sorbitol osmotic shocks (n = 54 cells).
C) mCrimson concentration increases by ~60% during oscillations (red), despite large decreases in volume growth rate (blue) (n = 843 cells). During supergrowth, the increased growth rate led to dilution of the mCrimson concentration. Dark centerline is the population-averaged mean, and shaded bars represent ±1 S.D.
D) Concentrations of various proteins labeled with fluorescent proteins before, during, and after oscillations. All protein concentrations increased during oscillations, to varying degrees. Points are population-averaged values binned in 15-min windows.
E) Ribosomal proteins also increased during oscillations, but to a lesser degree; RPS802 concentration remained approximately constant throughout the experiment.
F) The ratio of FITC (proteins) to PI (DNA) fluorescence, a proxy for global protein density, increased during oscillations and then decreased back to steady-state levels during supergrowth. Cells were subjected to 12 (rather than the typical 24) cycles of 500-mM sorbitol shocks with 10-min period (STAR Methods). Error bars are ±1 S.D. (n = 200 cells each data point).
G) Cytoplasmic density, as measured by quantitative phase imaging (STAR Methods), increased during osmotic shocks and decreased during supergrowth. Dark centerline is the population-averaged mean cell density, and the shading represents ±1 S.D. Green: normal growth (n = 88 cells); black, 500-mM oscillations (n = 187 cells); purple, 1-M oscillations (n = 106 cells).
To investigate why mCrimson accumulates during osmotic oscillations, we computed the rates of mCrimson production and compared to growth rate. During oscillations, the rate of mCrimson production remained close to normal levels even though cells grew in volume at a much slower rate than normal (Figure S3E). Thus, mCrimson increased in concentration not because of a large increase in protein production, but because protein production did not decrease as much as the volume growth rate.
We also examined how mCrimson concentration relaxed to equilibrium levels during supergrowth. In this phase, the cells grew in volume much faster than mCrimson production (Figure S3E). Much of this decrease in concentration can thus be explained by a dilution mechanism, which is enhanced by the rapid growth. The rate of “production” was also even lower than normal levels (Figure S3E), which may reflect decreased protein synthesis or increased degradation rates. Calculations using our growth-rate measurements to predict the decay constant of mCrimson fluorescence, assuming steady-state production after oscillations, indicated that at least 75% of the fall in mCrimson levels relative to controls can be explained by dilution during growth. These findings highlight dilution by rapid growth as a mechanism contributing to protein homeostasis.
Next, we determined whether native cellular proteins also increase in concentration during oscillations. We imaged fluorescently tagged proteins representing a variety of cellular processes, such as metabolism, chromosomal organization, cell-size control, and cell growth (Figure 5D, STAR Methods). These proteins all maintained a constant concentration during normal growth. Much like E2-mCrimson, the concentrations of many of these cellular proteins increased during 4 hours of 10-min, 0.5 M osmotic oscillations, and then returned gradually to normal during supergrowth (Figure 5D). No aggregates of these tagged proteins were observed. Similar changes in intensities were observed for fusions to various fluorescent proteins (Figure 5D), suggesting that the behavior was not an artifact of any particular fluorescent protein. Among the different protein fusions, there was a large range of behavioral variation, with different rates of increase and decrease during oscillations and supergrowth. Some proteins accumulated by ~100% during oscillations. In contrast, a subset of proteins displayed modest or no increases in concentration during oscillations. For example, the concentration of histone H2A was relatively steady throughout the experiment (Figure 5D), perhaps reflecting the fact that the amount of DNA is not increasing abnormally in these cells. The cell-size sensor Cdr2 increased only modestly during oscillations (Figure 5D), consistent with the maintenance of size control. Ribosomal proteins also showed only modest increases (Figure 5E; see section below). These findings suggest that osmotic oscillations caused large changes in the concentrations of a significant subset of cellular proteins.
We next employed two complementary methods to measure the global state of cellular components. Staining of individual cells for total protein with fluorescein isothiocyanate (FITC) showed a similar rise and fall, with a mean 20% increase during 2 hours of osmotic oscillations (Figure 5F), while DNA concentration remained constant (Figure S3F). This 20% increase is comparable to the 30-40% increase in mCrimson over 2 h of oscillations (Figure 5C), given that each protein displayed a unique response during oscillations (Figure 5D,E). Quantitative-phase imaging (STAR Methods) showed that intracellular density, as measured from the refractive index of the cell, also exhibited a ~10% and ~20% increase during 0.5-M and 1-M oscillations, respectively (Figure 5G). Both measurements were in approximate agreement with the average increases in protein concentrations (Figure 5D). Measurements of the size of vacuoles, which have low density, suggested that this change in density cannot be explained simply by decreases in vacuolar volume (Figure S3G-J). Thus, osmotic oscillations clearly produce global changes in protein concentration and cytoplasmic density.
Other oscillation regimes induced even larger increases in protein concentration. For instance, over the course of 48 oscillation cycles with 1 M sorbitol (8 h total), cells halted growth and accumulated 150% higher mCrimson concentrations (Figure S3K), while attaining the maximum supergrowth rate across our experiments (0.6 h−1, Figure S4A). These additional oscillatory cycles of 1M sorbitol displayed no sign of saturation in linear concentration accumulation (Figure S3K), suggesting that even higher increases in protein concentration are likely possible, even though growth rates plateaued (Figure 4, S4A).
We sought to determine if a simple model of growth kinetics could quantitatively predict such a linear increase during growth inhibition. Experimental measurements have shown that translational efficiency contains a growth-dependent and growth-independent component λ0 (Waldron and Lacroute, 1975). Using measured values of ribosome concentration and estimates of cell-wall production rate, this model predicts a steady-state growth rate that is within 14% of experimental measurements (see STAR Methods for more details). In our experiments with 1-M oscillatory shocks, growth halted completely, and ribosome concentration was constant. In this scenario, our model predicts that the baseline translational efficiency λ0 (Waldron and Lacroute, 1975) results in accumulation of biomass M at a constant rate dM/dt = λ0R, where R is the ribosome abundance. Hence, M is predicted to increase linearly during osmotic shock oscillations, at a reduced rate relative to unperturbed growth that yields a ~12% increase over 4 hours, reasonably similar to our QPI measurements (Figure 5G). Taken together, our experimental measurements and theoretical model indicate that oscillations and supergrowth represent periods of decoupling of protein production and cell expansion, and lead to excess accumulation of intracellular proteins.
The observed increase in protein concentration and cell density suggested that macromolecular crowding may increase in these cells. To assess crowding, we used microrheology to measure the diffusive-like movement of 40-nm genetically encoded multimeric nanoparticles (GEMs) (Figure S4B-D), which are similar in size to ribosomes (Delarue et al., 2018). We found only subtle changes to the effective diffusion coefficient of the GEMs moving within the cytoplasm: cells with higher density during oscillations showed decreased diffusion (~20%), while diffusion increased by 25% during supergrowth (Figure S4D). Thus, the observed changes in cytoplasmic density did not substantially inhibit the movement of macromolecules.
Increased protein concentrations drive supergrowth
Next, we asked whether the increased concentration of proteins was responsible for supergrowth. First, further analysis of our extensive exploration of oscillation parameters revealed that the maximal supergrowth rate was highly correlated with the observed increase in mCrimson concentration during oscillations (Figure 6A, r = 0.85). Second, we tested whether the increase of protein concentration is necessary for supergrowth. To globally inhibit protein synthesis, we treated cells with 100 μg/mL cycloheximide (Polanshek, 1977) during oscillations, and then washed out the inhibitor upon exit from oscillations. These cycloheximide-treated cells recovered to near-normal growth rates but never achieved supergrowth (Figure 6B). Thus, efficient protein translation during oscillations is required for supergrowth.
Figure 6: Excess protein concentration is necessary for supergrowth.

A) Maximum size-normalized growth rates were highly correlated with the mean mCrimson concentration at exit from oscillations, across all shock magnitudes, periods, and number of shock cycles in Figure 2F. Error bars represent ±1 S.D.
B) Cells treated with 100 μg/mL of the translation inhibitor cycloheximide (CHX; black shading, n = 228 cells) during oscillations (24 10-min periods, 0.5-M sorbitol shocks; yellow shading) rapidly halted growth during oscillations and exhibited no supergrowth afterward, unlike untreated cells (blue, n = 545 cells). Shading represents ±1 S.D.
C) Cells exposed to osmotic-shock oscillations as in (B) (black, n = 175 cells) or maintained in constant YE5S growth conditions (blue, n = 260 cells) were treated (directly after the exit from oscillations) for 3 h with 100 μg/mL cycloheximide. Cells that underwent oscillations grew more during CHX treatment and resumed normal growth more quickly after CHX washout. Shading represents ±1 S.D.
D) During cycloheximide treatment, the ratio of growth rates of cells that did and did not undergo oscillations was always ≥1 and reached a plateau within 30 min. At the plateau, cells that underwent oscillations grew approximately three-fold faster than control cells. The growth-rate ratio remained >1 for 2-3 h after cycloheximide treatment.
E) Brefeldin A (green shading) treatment completely inhibited growth, while mCrimson continued to accumulate throughout treatment. After the drug was washed out, cells initiated supergrowth with dynamics similar to those achieved after osmotic shocks.
Finally, we tested whether the accumulation of growth materials during oscillations is sufficient to drive growth in the absence of new protein synthesis. For control cells that were not exposed to oscillatory shocks, cycloheximide treatment caused a rapid, near-cessation in cell growth (Figure 6C). In contrast, cells that had been exposed to oscillations still grew substantially, at ~3-fold faster growth rates than control cells for 2 h (Figure 6C,D). Cells after oscillations also reestablished steady-state growth rates upon removal of cycloheximide more quickly (Figure 6C). Collectively, these results support the storage model in which cells with accumulated components are able to undergo some growth even in the absence of new protein synthesis.
Effect of ribosomal concentration, cell wall synthases, and turgor pressure on supergrowth
To probe whether the up-regulation of particular cellular processes drives supergrowth, we assessed three candidates involved in growth regulation: ribosomes, the cell-wall biosynthetic machinery, and turgor pressure. We monitored ribosomal protein abundances in single cells using ribosomal protein-GFP fusions expressed from their endogenous promoters (STAR Methods) and found that their steady-state concentrations were relatively constant (Figure 5E). The concentrations of these ribosomal proteins increased only modestly during oscillations (from 0-20%) (Figure 5E) and then quickly reverted to baseline levels during supergrowth. Some ribosomal proteins displayed nearly constant concentration throughout the experiment (Figure 5E, S4E,F), which can only occur if the protein synthesis rate matches the growth rate throughout both slow (oscillations) and fast (supergrowth) growth. Thus, rapid supergrowth is not caused by a large increase in ribosome concentration.
As cell-wall assembly likely limits the rate of cell expansion, a candidate factor for controlling cell-wall growth is the major cell-wall glucan synthase Bgs4. Bgs4 is a trans-membrane protein that localizes to growing cell tips during interphase and to the developing septum during cytokinesis (Cortes et al., 2005). During the oscillations, as cells grew slowly (Figure S4G), Bgs4 puncta were delocalized across the cell membrane (Figure S4H), consistent with the general depolarization of actin and Cdc42 seen in the osmotic-shock response (Cortes et al., 2005; Haupt et al., 2018; Mutavchiev et al., 2016). Bgs4 intensities at cell tips decreased by 50%, although total Bgs4 concentration gradually increased (by ~50%) during this period (Figure 5D). Upon exit from oscillations, Bgs4 rapidly repolarized to the cell tip, and tip intensities rose to more than 50% more than in control cells within 30-45 min (Figure S4H). The amount of Bgs4 at the cell tips strongly correlated with the growth rate in these experiments (r = 0.95) (Figure S4I). It is likely that such increases in the levels of Bgs4 and additional polarity factors contributing to cell wall growth collectively contribute to rapid growth at the cell tip. These results reveal mechanistic insight into why cell growth slows down during osmotic shock oscillations and how polarized growth is rapidly established after oscillations.
Another potential contributor to supergrowth might be an increase in turgor pressure, which can arise from increased cytoplasmic density (Mitchison, 2019; Tsai et al., 2019). We examined turgor pressure by measuring cell width, as changes in turgor pressure are expected to lead to concurrent reversible swelling in cell width, independently of tip elongation (Atilgan et al., 2015). Although cell widths increased slightly during osmotic oscillations, they did not decrease during supergrowth as cytoplasmic density decreases (Figure S2C, S4J). This irreversible increase in cell width during oscillations, therefore, likely arises from delocalized cell wall synthesis rather than from increases in turgor pressure (Mutavchiev et al., 2016). We further assessed cell-wall elasticity by measuring how much cell size decreased during each osmotic shock (Atilgan et al., 2015). The relative decrease in cell width upon osmotic shocks did not change throughout osmotic oscillations (Figure S4K). Thus, cell-wall properties are unlikely to explain the changes in growth rate during oscillations and supergrowth.
Transient inhibition of protein secretion also drives subsequent supergrowth
Our model predicted that other perturbations that transiently inhibit cell volume growth would also lead to proteome accumulation and subsequent supergrowth. One way of stopping growth and increasing buoyant density is through inhibition of secretion, as shown initially in budding yeast (Novick et al., 1980). To halt secretion, we treated mCrimson-expressing cells for 4 hours with 100 μg/mL brefeldin A (BFA), which inhibits protein transport from the endoplasmic reticulum to the Golgi apparatus (Brazer et al., 2000; Lippincottschwartz et al., 1989). Cells exhibited a rapid decrease in growth rate to essentially zero throughout BFA treatment, during which time mCrimson concentration increased approximately linearly (Figure 6E). Some cells eventually died, but the 45% of cells that survived the treatment exhibited supergrowth upon BFA wash-out (Figure 6E) with growth-rate trajectories similar to those observed after 0.5 M sorbitol osmotic oscillations (Figure 2D). Thus, rather than just a response to osmotic stress, supergrowth and proteome accumulation can be produced by other treatments that limit volume expansion without proportional inhibition of protein synthesis.
DISCUSSION
Here, our interrogation of the growth response of S. pombe cells to osmotic perturbations has revealed insights into the relationships between cell size, growth, and biosynthesis. In investigating the basis for supergrowth, we find that these unprecedented rapid growth rates arise from a decoupling of biosynthesis and volume expansion. During the osmotic oscillations, volume expansion is impaired far more than biosynthesis, which leads to global accumulation of cellular components inside the cell. Release from these conditions then results in abnormally rapid growth that drives an accelerated return to normal proteome concentrations relative to dilution. Our results thus support a model in which rapid growth is driven by the accumulation of cellular materials. This effect of material storage on growth rate may be connected with the mechanisms underlying the near-universal scaling of growth rate with cell size (exponential growth) observed under steady-state environmental conditions across the kingdoms of life. In the simplest interpretation, cells in supergrowth grow rapidly because they have the internal resources of a larger cell. Whether the cellular materials that promote growth are some subset of the cytoplasmic constituents, or the entire collection, remains to be seen. Our data suggests that growth rate is set by a combination of cellular processes, including the biosynthetic machinery, metabolism, and polarized cell-wall assembly, rather than by a single component such as ribosomes.
This work reveals that relatively simple manipulations can decouple cell growth and protein synthesis, yielding mechanistic insights into how these fundamental processes are normally coordinated. As concentrations of many proteins do not vary greatly during steady-state growth, it has been speculated that extensive feedback mechanisms exist for protein homeostasis; for instance, increased concentration of a certain protein may inhibit its own translation or transcription through a signaling pathway that senses its concentration, leading to a decrease back to normal levels; such a protein-specific mechanism has been suggested for tubulin homeostasis for instance (Cleveland and Kirschner, 1982). In this scenario, we speculate that osmotic oscillations lead to breakdown of the putative feedback mechanisms, possibly because of the rapid changes in cell size and concentrations. However, our findings also raise a second, simpler possibility in which signaling feedback mechanisms may not exist for many proteins (Neurohr et al., 2019; Springer et al., 2010; Torres et al., 2007; Torres et al., 2016). Recent work has shown that excessive growth can dilute protein concentrations, suggesting that direct feedback between volume growth and protein synthesis may not exist for some systems (Neurohr et al., 2019). Our work provides further evidence that volume expansion itself could act as a homeostatic mechanism, wherein biomass increases largely independent of volume and small variations in cytoplasmic protein concentrations are brought back into balance by a correction in short-term volume growth rate. Abnormal increases in protein concentrations would drive faster growth than synthesis, which would decrease their concentration in part through dilution, similar to what we observe during supergrowth. A decrease in protein concentration would lead to slowed growth, allowing protein concentration to build back up. Our experiments were able to reveal such a mechanism for the coordination of growth and volume, because they allowed us to uncouple this coordination and examine the recovery process.
Such a mechanism however may apply to a subset of proteins, but not to all. During osmotic oscillations, certain groups of proteins (such as metabolic enzymes) maintained relatively high synthesis rates and hence rose in concentration. By contrast, other proteins – including ribosomal proteins, histones, and cell size regulators – are likely regulated so that their expression scales with growth to maintain their concentrations; the level of accumulation of these proteins during osmotic oscillations would then reflect the robustness of this regulation. Tight control of ribosomal protein concentration is predicted to be another factor to keep the proteome in check (Zhao et al., 2003), preventing accumulation at more rapid rates when expansion is perturbed.
The cellular phenotype we have presented involves alteration of the concentrations of much of the proteome, accompanied by substantial increases in cytoplasmic density that likely involve a sizeable replacement of water within the cytoplasm by protein biomass. Nevertheless, S. pombe cells retain viability and relatively unaffected cytoplasmic diffusion (Figure S4D), grow with normal morphologies (Figure 3A, S2G,H), and exhibit normal periods of mitosis and cytokinesis (Figure 3B,C), underscoring the robust control of critical biochemical processes. In particular, this work provides a demonstration of how cell size can be maintained even over a 10-fold range of growth rates, a finding inconsistent with models of cell-size control based directly on growth rate (Lucena et al., 2018). Rather, these results support the existence of cell-size control mechanisms in fission yeast cells that involve direct assessment of cell size through “sizers” (Facchetti et al., 2017; Pan et al., 2014). In general, our findings indicate that cellular density can be regulated or perturbed in various settings such as stress. Procedures such as osmotic oscillations that increase protein expression per unit volume may have practical applications, for instance in protein production. It will be valuable to explore in future studies the myriad ways in which such global changes in cytoplasmic density affect cellular processes.
STAR★METHODS
LEAD CONTACT AND MATERIALS AVAILABILITY
Further information and requests for resources and reagents should be directed to, and will be fulfilled by, Fred Chang (fred.chang@ucsf.edu). This study did not generate new reagents.
EXPERIMENTAL MODEL AND SUBJECT DETAILS
The model organism Schizzosaccharomyces pombe was used exclusively in this study, and all strains are listed in the Key Resources table. Hypertonic media was made by adding D-sorbitol directly to either rich (YE5S) or minimal media (EMM).
METHOD DETAILS
Growth conditions
Single colonies were inoculated from plates into liquid rich medium (YE5S, Sunrise Science Products YES-225) overnight with shaking at 30 °C. Once cells reached mid-log phase (OD600~0.5), they were diluted 1:10 directly into ONIX Y04C-02 microfluidic flow cells (EMD Millipore) that had been primed with fresh medium for 15 min. Cells were grown for 15-30 min prior to imaging to allow them to equilibrate to the flow-cell chamber. YE5S was supplemented with D-sorbitol (Sigma) for hypertonic conditions, and fresh medium was introduced into the culture chambers at 5 psi. Control measurements were performed by exchanging YE5S between wells in adjacent culture chambers. By adding a tracer dye (0.5 μg/mL WGA, Alexa Fluor 488 conjugate; Life Technologies) to the sorbitol-supplemented medium, we determined that media exchange occurred within 10 s (Figure 2A, S3A). Where applicable, drug (cycloheximide or brefeldin A; Sigma) was added to the medium.
Time-lapse imaging
Cells were imaged in phase-contrast using a Ti-Eclipse stand (Nikon Instruments) with a 40X (NA: 0.95) or 100X (NA: 1.45) objective, and a Zyla 4.2 sCMOS camera (Andor Technology). Temperature was maintained with a stage-top incubator (OkoLab), which was warmed for at least 1 h prior to imaging. Images were acquired at 1-s or 5-s frame intervals for measuring rapid volume changes during osmotic shocks (Figure S3B), and 1-min or 5-min frame intervals for osmotic shock and growth measurements. For strains expressing fluorescent proteins, cells were imaged in phase-contrast and with laser illumination in spinning-disk confocal mode (Yokogawa CSU-10), and images were acquired with an EM-CCD camera (Hamamatsu) every 10 min at low power to avoid bleaching. The microscope systems were integrated using μManager v. 1.41 (Edelstein et al., 2014b).
Cell segmentation and size/fluorescence quantification
We first utilized the deep neural network-based machine learning framework DeepCell (Van Valen et al., 2017) to segment cells. For each imaging technique (wide-field, confocal) and objective, approximately 200 cells were manually outlined to produce a training dataset. Trained networks were used to generate binary images for feature (extracellular/cell perimeter/cytoplasm) identification. These images were used as the input for gradient segmentation in Morphometries v. 1.1 (Ursell et al., 2017) to define cell contours at sub-pixel resolution.
The centerline between the two poles was calculated through an iterative method in which symmetric bisections were created starting from the contour’s centroid toward the poles. Cell length was defined as the total length of the centerline, and width as the median length of lines running perpendicular to the centerline and stretching between the two sides of the cell. Cell surface area and volume were calculated by integrating disks of revolution at each point on the centerline.
For fluorescence quantification, the total signal within each cell contour was summed.
Estimation of supergrowth contribution to mCrimson dilution
Estimates for growth-based dilution during supergrowth were calculated using the equation
where the rate of protein production during supergrowth is assumed to follow the growth rate and is the population-averaged growth rate. The difference between the actual and estimated concentrations (c(t) – cdilution(t)) was used to estimate the contribution to dilution from growth at >75%.
Bgs4 tip localization and intensity quantification
Cell tips were identified based on peaks in the contour curvature, which is defined at each contour point as the second derivative of the local vector normal. The fluorescence intensity was integrated along a line scan perpendicular to the contour at each contour point whose curvature was greater than 0.12 μm−1, a threshold that was determined visually as an optimal identifier of cell tip regions.
Osmotic oscillations on bulk cultures
Using a tabletop upright glass vacuum filter holder (Fisherbrand) with 0.45-μm HA membrane filters (Millipore, HAWP04700), the medium was rapidly exchanged (<30 s) for cultures of up to 200 mL. All media were maintained at 30 °C, and cells were resuspended and shaken at 30 °C during each half-period. Cells from the culture were imaged directly after these oscillations to measure growth rate and mCrimson fluorescence.
Fluorescein isothiocyanate (FITC) and propidium iodide (PI) staining
Staining protocols were adapted from (Porro et al., 2003). One-milliliter samples were collected at various time points during the bulk oscillations protocol at OD600 ~ 0.5, and cells were fixed with 70% cold ethanol for at least 24 h at 4 °C. Approximately 106 cells (300 μL) were washed with 50 mM sodium citrate buffer (pH 7.4), and then treated with 0.1 mg/mL RNAse A (ThermoFisher, EN0531) for at least 2 h. For total protein staining, cells were washed and then stained with 5 ng/mL FITC (Sigma, F7250) for at least 30 min, then washed three times. To determine total DNA content, cells were stained with PI at 0.1 mg/mL for at least 30 min and then washed.
To quantify FITC/PI ratios, cells were imaged on 1% agarose + EMM pads (Figure S8). Z-stacks were acquired to obtain sum-projections after background subtraction, with cell outlines segmented manually due to the poor phase contrast of fixed cells.
Quantitative Phase Imaging
Images were acquired with a Ti-Eclipse inverted microscope (Nikon) equipped with a 680-nm bandpass filter (D680/30, Chroma Technology) in the illumination path with a 60X (NA: 1.4) DIC oil objective (Nikon). Before imaging, Köhler illumination was configured and the peak illumination intensity with 10-ms exposure time was set to the middle of the dynamic range of the Zyla sCMOS 4.2 camera (Andor). μManager v. 1.41 (Edelstein et al., 2014b) was used to automate acquisition of brightfield z-stacks with a step size of 250 nm from ±3 μm around the focal plane (total of 25 imaging planes) at 10-min intervals.
For analysis, all imaging planes between maximal distances of + 1.25 μm and −1.25 μm around the focal plane were selected. Based on these images, the phase information was calculated using a custom Matlab script implementing a previously published algorithm (Bostan et al., 2016). In brief, this method relates the phase information of the cell to intensity changes along the z-direction. Equidistant, out-of-focus images above and below the focal plane are used to estimate intensity changes at various defocus distances. A phase-shift map is reconstructed in a non-linear, iterative fashion to solve the transport-of-intensity equation.
A Gaussian peak was fitted to the background of each image and then corrected to be at zero phase shift using an image-wide subtraction of the mean of the peak. These corrected images were segmented using DeepCell and Morphometries v. 1.1. From the cell outlines, the median intensity of each cell was obtained with ImageJ and used to calculate the cytoplasmic density as follows. The difference of the reconstructed phase map median intensity of cells in YE5S medium compared to cells in YE5S medium supplemented with 100 mg/mL BSA was used to define the phase shift contribution equivalent to 100 mg/mL biomass. The phase shift corresponding to 100 mg/mL BSA was then calculated by first averaging the intensity of all cells in YE5S medium at timepoints 10 min before and after BSA addition. Then, the difference relative to the median intensity of all cells during the measurement in YE5S supplemented with 100 mg/mL BSA was defined as the signal contributed by 100 mg/mL biomass.
Throughout the experiment, multiple measurements in YE5S supplemented with 100 mg/mL BSA were performed and calibration values for each imaging timepoint in between two consecutive measurements in YE5S + BSA were obtained by linear interpolation. These values were then used for quantification of cell density.
Imaging and analysis of genetically encoded multimer (GEM) diffusion
Cells carrying a pREP42-plasmid encoding the 40-nm GEMs (PfV-GS-Sapphire, gift from Liam Holt, FC3238) (Delarue et al., 2018) under the control of the nmt1* promoter were inoculated in liquid EMM(-leu) for overnight culture, diluted 1:50 into EMM(-leu), grown for 5 h, and then diluted 1:10 into rich YE5S medium 4 h prior to imaging. Cells were then diluted 1:10 in YE5S directly into CellAsic Y04C chips and were subjected to YE5S + 500 mM D-sorbitol oscillations with a 10-min period for 4 h. GEMs were imaged under semi-total internal reflection fluorescence (TIRF, Andor Diskovery system) microscopy with an Ixon Ultra 897 EM-CCD camera (Andor) controlled by μManager v. 1.41. Images were acquired at 90 frames per s for 500 frames in fields of 256×256 pixels. GEM tracks were analyzed similarly as in (Delarue et al., 2018). Tracks were extracted using the Mosaic ImageJ plugin (Shivanandan et al., 2013), and then subjected to filters of spot quality (>0.2) and track length (>10 frames). From the remaining tracks, mean squared displacement (MSD) over time was computed using custom MATLAB (Mathworks) scripts. The effective diffusion coefficient, D, was obtained by fitting the first 10 time points of the MSD curve to a line described by the canonical two-dimensional diffusion equation
Setup of model based on strict regulation of ribosome concentration
Here, we develop a quantitative model of growth kinetics and biomass synthesis. This model examines the mechanism responsible for the linear increase in protein concentration during growth inhibition observed in our experiments.
In our oscillatory osmotic-shock experiments, ribosomal protein concentration was relatively constant compared to non-ribosomal proteins (Figure 3D,E). Imposing the requirement of constant ribosome concentration ρR = R/V, where R is the number of ribosomes and V is the cell volume, amounts to
| (1) |
Equation 1 means that R and V are related by
| (2) |
During growth, biomass M is converted into irreversible volume expansion at a rate α (Klumpp et al., 2009), such that
| (3) |
while we assume that the biomass production rate is approximately set by the global protein synthesis rate μ:
| (4) |
We also know from previous studies that the efficiency of translation has a linear growth rate dependence
| (5) |
We fitted the data in (Waldron and Lacroute, 1975) to obtain values of and as measured in amino acids produced (aa).
Model-based predictions for steady-state dynamics
To solve the coupled set of first-order differential equations in Equations 4 and 5, we can write
Using Equation 3,
We can write an equation in terms of M by taking a second derivative, and using equations (1) and (2) obtain
| (6) |
Equation 6 predicts a simple exponential solution for biomass increase as
where the growth rate is
| (7) |
We estimate the average cell mass to be ~25 pg during steady-state growth, and that the volume increase during doubling is ~75 μm3, which occurs in ~1.5 h, producing α ~2 μm3 h−1 pg−1. Using the recently measured yeast ribosome concentration of ~14,000 ribosomes/μm3 (Delarue et al., 2018), this equation predicts a growth rate of ~0.30 h−1, in reasonable agreement with our measurements of ~0.35 h−1 in rich media at 30 °C. Furthermore, Equation 7 agrees with measurements (to first-order) showing that steady-state growth rate depends linearly on the ribosome concentration (Klumpp et al., 2009).
Modeling of growth arrest dynamics
During growth arrest, α = 0, so volume growth rate becomes zero and the ribosome number remains constant: and . Then, the biomass production rate is
| (8) |
where λ0 is the translational efficiency of the cell under growth arrest. Equation 8 agrees with the observation that protein concentration, as measured by fluorescence (Figure 5C,D) and biomass density (Figure 5G), increases linearly during osmotic shock oscillations, at a reduced rate relative to normal growth.
By dividing Equation 8 by the static volume under growth arrest, the biomass density, ρB, evolves as
Since λ0ρR is a constant, we can integrate over a time interval, Δt, to obtain
From (Delarue et al., 2018), ρR ≈ 14000 ribosome/μm3, and using the fitted value of λ0 in Equation 5, a time interval of Δt = 4 h yields
where an amino acid is ~1.82 × 10⁻¹⁰ pg. ΔρB is the estimated contribution of protein mass to the cell’s total biomass after 4 h of volume growth arrest.
The average yeast cell is ~1.1 g/mL (Bryan et al., 2010), with ~20% of the cell’s volume estimated to be occupied by biomass (Atilgan et al., 2015; Dill et al., 2011). Using this estimate of the biomass density (), we obtain an increase of ΔρB~12%, in reasonable agreement with the biomass density increase of ~20% that we observed during 4 h of 1-M sorbitol oscillations (Figure 5G).
Correlation between concentration increase and normal concentration
In the model described by Equations 1-4, there is no specific control of the protein synthesis rate for any one protein, but Equation 1 can describe proteins of absolute abundance P whose concentration ([P]) does not change throughout the cell cycle during steady-state growth, such that
In our data examining fluorescently tagged proteins, we found that excess protein concentrations after oscillations ranged from 10-100% increases (Figure 5D,E), and correlated with absolute protein concentrations over a factor of 104 (Figure S4E), suggesting a weak scaling law between protein synthesis and protein abundance during zero volume growth. Previous studies in both fission yeast and mammalian cells have demonstrated power laws between protein synthesis rate and abundance that cannot be explained by mRNA abundance alone (Marguerat et al., 2012; Schwanhausser et al., 2011).
In a general model of protein synthesis, we assume that the rate of protein production is proportional to the abundance of each protein as
where μ is a term capturing the ribosome number, which is a constant during zero volume growth (Figure S4E,F), and γ is close to 1. During zero volume growth, μ is a constant, μ0, and we further assume that the power law dependence is fixed during a period of duration Δt, so that
This equation yields
| (11) |
We can fit the data in Figure S4E to obtain γ – 1 ≈ 10−4, indicating that γis very close to 1, a condition required for exponential protein production and constant protein concentration at steady state. That γdiffers from 1 by as small as 10−4 suggests that the power law dependence can only be revealed through long-term decoupling of protein synthesis and volume growth.
QUANTIFICATION AND STATISTICAL ANALYSES
Image analysis was performed by pre-processing in ImageJ, and cell segmentation was performed by a combination of DeepCell and Morphometries. Further statistical analyses and quantification were performed in Matlab. Time-lapse data were binned with time windows as shown in each figure (generally 30 min) and quantified with mean and standard deviation. Numbers of cells are noted on each figure. Statistical significance was determined using a two-sample Kolmogorov-Smirnov test, and correlation was measured by the Pearson correlation coefficient. Goodness of fit for linear regressions was assessed through the F-test. Statistics are reported on each figure. In all figures, control experiments represent at least two biological replicates, and baseline conditions (500 mM sorbitol, 10 min period, 4 h oscillations) represent at least three biological replicates. Experiments quantifying relative abundance of fluorescently tagged endogenous proteins represent single replicates. Diffusion analyses of GEM behavior were performed in ImageJ using the Mosaic plugin, and results were analyzed in Matlab.
DATA AND CODE AVAILABILITY
Custom Matlab code used to analyze growth rate, generate statistics, and analyze GEM diffusion can be found on GitHub: https://github.com/bknapp8/supergrowth_scripts. The source data for figures in the paper is available from the authors upon request.
Supplementary Material
Key Resources Table
| REAGENT or RESOURCE | SOURCE | IDENTIFIER |
|---|---|---|
| Yeast strains | ||
| Schizosaccharomyces pombe: h− wild-type strain 972 | Chang lab collection | FC15 |
| S. pombe: h− cdc25-22 | Chang lab collection | FC342 |
| S. pombe: h− sec6-GFP-ura4+ leul-32 ura4- | Chang lab collection | FC1037 |
| S. pombe: h− ssp2::ura4+ leul-32 ura4-D18 | Chang lab collection | FC1503 |
| S. pombe: h-gad8::ura4+ leu1-32 ura4-D18 | Chang lab collection | FC1507 |
| S. pombe: h-gad8::ura4+ leu1-32 ura4-D18 | Chang lab collection | FC1507 |
| S. pombe: h− pmk1::ura4+ leu1-32 ura4-D18 | Chang lab collection | FC1551 |
| S. pombe: h− sty1::ura4+ leu1-32 ura4-D18 | Chang lab collection | FC1568 |
| S. pombe: h− cch1::ura4+ leu1-32 ura4-D18 | Chang lab collection | FC1596 |
| S. pombe: h− fim1-meGFP-kanMX6 | Chang lab collection | FC1897 |
| S. pombe: h− rga4-RFP::kanMX6 leu1-32 ura4-D18 | Chang lab collection | FC1902 |
| S. pombe: h− ost1-GFP::ura4+ rlcl-RFP::ura4+leu1-32 ura4-D18 | Chang lab collection | FC1919 |
| S. pombe: h− trn1-GFP::kanMX6 ade6- leu1-32 ura4-D18 | Chang lab collection | FC2086 |
| S. pombe: h− yop1-GFP::kanMX6 ade6- leu1-32 ura4-D18 | Chang lab collection | FC2087 |
| S. pombe: h− leu1:2xGFP-bgs4 leu1+ ura4+ | Chang lab collection | FC2255 |
| S. pombe: h− gma12-GFP-ura4+ leu1:tdTom-bgs1 leu1+ ura4+ | Chang lab collection | FC2277 |
| S. pombe: h+ pom1-tomato-natMX, cdr2-GFP-kanMX ade6- leu1-32 ura4-D18 | Chang lab collection | FC2678 |
| S. pombe: h− gpd1::kanMX leu1-32 | Chang lab collection | FC2810 |
| S. pombe: h− tdh1-dendra2:ura4 ade6- leu1-32 ura4-D18 | Chang lab collection | FC2840 |
| S. pombe: h+ hta1-mCherry:kanMX GFP-atb2:kanMX ade6- leu1-32 ura4- | Chang lab collection | FC2859 |
| S. pombe: h+ GFP-atb2:kanMX ade6- leu1-32 ura4-D18 | Chang lab collection | FC2861 |
| S. pombe: h− leu1-tomato-bgsl psy1-GFP-leu1 | Chang lab collection | FC2913 |
| S. pombe: h+ act1p::1XE2C:HygR ura4-D18 leu1-32 ade6-M210 his7-366 | Chang lab collection | FC3186 |
| S. pombe: h− rps802-GFP::kanMX leu1-32 ura4-D18 ade6-M210 | Chang lab collection | FC3208 |
| S. pombe: h− rps2-GFP::kanMX leu1-32 ura4-D18 ade6-M210 | Chang lab collection | FC3209 |
| S. pombe: h+ rpl1601-GFP::kanR leu1-32 ura4-D18 ade6-M210 | Chang lab collection | FC3210 |
| S. pombe: h− rpl2801-GFP::kanMX leu1-32 ura4-D18 ade6- | Chang lab collection | FC3212 |
| S. pombe: h+ rps2401-GFP::kanR leu1-32 ura4-D18 ade6-M216 | Chang lab collection | FC3213 |
| S. pombe: h+ rpl3001-GFP::kanR leu1-32 ura4-D18 ade6-M216 | Chang lab collection | FC3215 |
| S. pombe: h− [pREP42-pnmt1-PfV-GS-Sapphire-tnmt1] leu1-32 ura4-D18 ade6-M216 | This manuscript | FC3238 |
| Chemicals, Peptides, and Recombinant Proteins | ||
| YE5S rich media | Sunrise Science | Cat. #YES-225 |
| Edinburgh Minimal Media (EMM) | US Biological | Cat. #E2205 |
| Difco agar | Fisher Scientific | Cat. # DF0812-07-1 |
| D-Sorbitol | Sigma-Aldrich | Cat. #S1876 |
| D-Glucose | Sigma-Aldrich | Cat. #G8270 |
| Adenine | Sigma-Aldrich | Cat. #A8626 |
| Leucine | Sigma-Aldrich | Cat. #L8000 |
| Histidine | Sigma-Aldrich | Cat. #H8000 |
| Cycloheximide | Sigma-Aldrich | Cat. #C7698 |
| Brefeldin A | Sigma-Aldrich | Cat. #B7651 |
| Wheat Germ Agglutinin, Alexa Fluor 488 Conjugate | Life Technologies | Cat. # W11261 |
| Fluorescein isothiocyanate (FITC) | Sigma-Aldrich | Cat. # F7250 |
| Propidium iodide (PI) | Sigma-Aldrich | Cat. #P4170 |
| RNase A | ThermoFisher | Cat. #EN0531 |
| Bovine serum albumin | Sigma-Aldrich | Cat. #A3608 |
| Software and Algorithms | ||
| Morphometries v. 1.1 | (Tyanova et al., 2016) | https://simtk.org/projects/morphometrics |
| DeepCell | (Van Valen et al. 2017) | https://hub.docker.com/r/vanvalen/deepcell/ |
| ImageJ v. 1.51 | NIH | https://imagej.nih.gov |
| MOSAIC for ImageJ | (Shivanandan et al., 2013) | https://bmcbioinformatics.biomedcentral.com/articles/10.1186/1471-2105-14-349 |
| μManager v. 1.4 | (Edelstein et al., 2014a) | N/A |
| MATLAB 2017a | MathWorks | www.mathworks.com/products/matlab.html |
| Other | ||
| 0.45-μm filter | Millipore | HAWP04700 |
| Microfluidic perfusion plates | CellASIC | Cat. #Y04C |
| ONIX microfluidic platform | CellASIC | N/A |
| Nikon Eclipse Ti-E inverted fluorescence microscope | Nikon | N/A |
| Yokogawa confocal spinning disk CSU-10 | Yokogawa | N/A |
| Andor Diskovery multi-modal system | Andor | N/A |
| Borealis illumination system | Andor | N/A |
| Integrated laser system (488 nm, 561 nm) | Andor | N/A |
| OBIS 488 nm laser | Coherent | N/A |
| EM-CCD camera | Hamamatsu | N/A |
| iXon Ultra EM-CCD camera | Andor | N/A |
| Zyla 4.2 sCMOS camera | Andor | N/A |
| Active-control environmental chamber | Haison Technology | N/A |
| Active-control environmental chamber | Okolab | N/A |
Highlights.
Cell growth involves balance between rates of volume growth and protein synthesis
Inhibition of volume growth leads to increase in global protein density
Increased density drives accelerated growth after release from growth inhibition
Accelerated growth serves as a homeostatic mechanism to dilute excess protein
ACKNOWLEDGMENTS
We thank members of the Huang, Chang, Jan Skotheim, and Sophie Dumont labs for helpful discussions, and Liam Holt for GEMs reagents. This work was funded by NIH CAREER Award MCB-1149328 (to K.C.H.), the Allen Discovery Center at Stanford University on Systems Modeling of Infection (to K.C.H.), the National Natural Science Foundation of China (NSFC; 3167080548) (to X.H.), and NIH R01-GM56836 and Bilateral BBSRC-NSF/BIO Award 1638195 (to F.C.). K.C.H. is a Chan Zuckerberg Biohub Investigator.
Footnotes
DECLARATION OF INTERESTS
The authors declare no competing interests.
Publisher's Disclaimer: This is a PDF file of an unedited manuscript that has been accepted for publication. As a service to our customers we are providing this early version of the manuscript. The manuscript will undergo copyediting, typesetting, and review of the resulting proof before it is published in its final form. Please note that during the production process errors may be discovered which could affect the content, and all legal disclaimers that apply to the journal pertain.
REFERENCES
- Abenza JF, Couturier E, Dodgson J, Dickmann J, Chessel A, Dumais J, and Carazo Salas RE (2015). Wall mechanics and exocytosis define the shape of growth domains in fission yeast. Nat Commun 6, 8400. [DOI] [PMC free article] [PubMed] [Google Scholar]
- Al-Sady B, Greenstein RA, El-Samad HJ, Braun S, and Madhani HD (2016). Sensitive and Quantitative Three-Color Protein Imaging in Fission Yeast Using Spectrally Diverse, Recoded Fluorescent Proteins with Experimentally-Characterized In Vivo Maturation Kinetics. Plos One 11. [DOI] [PMC free article] [PubMed] [Google Scholar]
- Atilgan E, Magidson V, Khodjakov A, and Chang F (2015). Morphogenesis of the Fission Yeast Cell through Cell Wall Expansion. Curr Biol 25, 2150–2157. [DOI] [PMC free article] [PubMed] [Google Scholar]
- Basu R, Munteanu EL, and Chang F (2014). Role of turgor pressure in endocytosis in fission yeast. Mol Biol Cell 25, 679–687. [DOI] [PMC free article] [PubMed] [Google Scholar]
- Baumgartner S, and Tolic-Norrelykke IM (2009). Growth pattern of single fission yeast cells is bilinear and depends on temperature and DNA synthesis. Biophys J 96, 4336–4347. [DOI] [PMC free article] [PubMed] [Google Scholar]
- Bostan E, Froustey E, Nilchian M, Sage D, and Unser M (2016). Variational Phase Imaging Using the Transport-of-Intensity Equation. IEEE Trans Image Process 25, 807–817. [DOI] [PubMed] [Google Scholar]
- Brazer SC, Williams HP, Chappell TG, and Cande WZ (2000). A fission yeast kinesin affects Golgi membrane recycling. Yeast 16, 149–166. [DOI] [PubMed] [Google Scholar]
- Bryan AK, Goranov A, Amon A, and Manalis SR (2010). Measurement of mass, density, and volume during the cell cycle of yeast. Proc Natl Acad Sci U S A 107, 999–1004. [DOI] [PMC free article] [PubMed] [Google Scholar]
- Chang F, Atilgan E, Burgess D, and Minc N (2014). Manipulating cell shape by placing cells into micro-fabricated chambers. Methods Mol Biol 1136, 281–290. [DOI] [PubMed] [Google Scholar]
- Chang F, and Martin SG (2009). Shaping fission yeast with microtubules. Cold Spring Harb Perspect Biol 1, a001347. [DOI] [PMC free article] [PubMed] [Google Scholar]
- Chen D, Toone WM, Mata J, Lyne R, Burns G, Kivinen K, Brazma A, Jones N, and Bahler J (2003). Global transcriptional responses of fission yeast to environmental stress. Mol Biol Cell 14, 214–229. [DOI] [PMC free article] [PubMed] [Google Scholar]
- Cleveland D, and Kirschner M (1982). Autoregulatory control of the expression of alpha- and beta-tubulins: implications for microtubule assembly. Cold Spring Harb Symp Quant Biol 46 Pt 1, 171–183. [DOI] [PubMed] [Google Scholar]
- Cooper S (2006). Distinguishing between linear and exponential cell growth during the division cycle: single-cell studies, cell-culture studies, and the object of cell-cycle research. Theor Biol Med Model 3, 10. [DOI] [PMC free article] [PubMed] [Google Scholar]
- Cortes JC, Carnero E, Ishiguro J, Sanchez Y, Duran A, and Ribas JC (2005). The novel fission yeast (1,3)beta-D-glucan synthase catalytic subunit Bgs4p is essential during both cytokinesis and polarized growth. J Cell Sci 118, 157–174. [DOI] [PubMed] [Google Scholar]
- Davie E, Forte GM, and Petersen J (2015). Nitrogen regulates AMPK to control TORC1 signaling. Curr Biol 25, 445–454. [DOI] [PMC free article] [PubMed] [Google Scholar]
- Delarue M, Brittingham GP, Pfeffer S, Surovtsev IV, Pinglay S, Kennedy KJ, Schaffer M, Gutierrez JI, Sang D, Poterewicz G, et al. (2018). mTORC1 Controls Phase Separation and the Biophysical Properties of the Cytoplasm by Tuning Crowding. Cell 174, 338–349 e320. [DOI] [PMC free article] [PubMed] [Google Scholar]
- Dill KA, Ghosh K, and Schmit JD (2011). Physical limits of cells and proteomes. Proc Natl Acad Sci U S A 108, 17876–17882. [DOI] [PMC free article] [PubMed] [Google Scholar]
- Edelstein A, Amodaj N, Hoover K, Vale R, and Stuurman N (2014a). Computer control of microscopes using uManager. Journal of Biological Methods 1, e10.25606571 [Google Scholar]
- Edelstein AD, Tsuchida MA, Amodaj N, Pinkard H, Vale RD, and Stuurman N (2014b). Advanced methods of microscope control using μManager software. Journal of biological methods 1, e10. [DOI] [PMC free article] [PubMed] [Google Scholar]
- Facchetti G, Chang F, and Howard M (2017). Controlling cell size through sizer mechanisms. Current Opinion in Systems Biology 5, 86–92. [DOI] [PMC free article] [PubMed] [Google Scholar]
- Haupt A, Ershov D, and Minc N (2018). A Positive Feedback between Growth and Polarity Provides Directional Persistency and Flexibility to the Process of Tip Growth. Current Biology 28, 3342-+. [DOI] [PubMed] [Google Scholar]
- Horvath A, Racz-Monus A, Buchwald P, and Sveiczer A (2013). Cell length growth in fission yeast: an analysis of its bilinear character and the nature of its rate change transition. FEMS Yeast Res 13, 635–649. [DOI] [PubMed] [Google Scholar]
- Horvath A, Racz-Monus A, Buchwald P, and Sveiczer A (2016). Cell length growth patterns in fission yeast reveal a novel size control mechanism operating in late G2 phase. Biol Cell 108, 259–277. [DOI] [PubMed] [Google Scholar]
- Ikeda K, Morigasaki S, Tatebe H, Tamanoi F, and Shiozaki K (2008). Fission yeast TOR complex 2 activates the AGC-family Gad8 kinase essential for stress resistance and cell cycle control. Cell Cycle 7, 358–364. [DOI] [PMC free article] [PubMed] [Google Scholar]
- Klumpp S, Zhang Z, and Hwa T (2009). Growth rate-dependent global effects on gene expression in bacteria. Cell 139, 1366–1375. [DOI] [PMC free article] [PubMed] [Google Scholar]
- Lippincottschwartz J, Yuan LC, Bonifacino JS, and Klausner RD (1989). Rapid Redistribution of Golgi Proteins into the Er in Cells Treated with Brefeldin-a - Evidence for Membrane Cycling from Golgi to Er. Cell 56, 801–813. [DOI] [PMC free article] [PubMed] [Google Scholar]
- Lucena R, Alcaide-Gavilan M, Schubert K, He M, Domnauer MG, Marquer C, Klose C, Surma MA, and Kellogg DR (2018). Cell Size and Growth Rate Are Modulated by TORC2-Dependent Signals. Curr Biol 28, 196–210 e194. [DOI] [PMC free article] [PubMed] [Google Scholar]
- Ma Y, Sugiura R, Koike A, Ebina H, Sio SO, and Kuno T (2011). Transient receptor potential (TRP) and Cch1-Yam8 channels play key roles in the regulation of cytoplasmic Ca2+ in fission yeast. PLoS One 6, e22421. [DOI] [PMC free article] [PubMed] [Google Scholar]
- Marguerat S, Schmidt A, Codlin S, Chen W, Aebersold R, and Bahler J (2012). Quantitative analysis of fission yeast transcriptomes and proteomes in proliferating and quiescent cells. Cell 151, 671–683. [DOI] [PMC free article] [PubMed] [Google Scholar]
- Minc N, Boudaoud A, and Chang F (2009). Mechanical forces of fission yeast growth. Curr Biol 19, 1096–1101. [DOI] [PMC free article] [PubMed] [Google Scholar]
- Mitchison JM, and Nurse P (1985). Growth in cell length in the fission yeast Schizosaccharomyces pombe. J Cell Sci 75, 357–376. [DOI] [PubMed] [Google Scholar]
- Mitchison TJ (2019). Colloid osmotic parameterization and measurement of subcellular crowding. Mol Biol Cell 30, 173–180. [DOI] [PMC free article] [PubMed] [Google Scholar]
- Mutavchiev DR, Leda M, and Sawin KE (2016). Remodeling of the Fission Yeast Cdc42 Cell-Polarity Module via the Sty1 p38 Stress-Activated Protein Kinase Pathway. Curr Biol 26, 2921–2928. [DOI] [PMC free article] [PubMed] [Google Scholar]
- Neurohr GE, Terry RL, Lengefeld J, Bonney M, Brittingham GP, Moretto F, Miettinen TP, Vaites LP, Soares LM, Paulo JA, et al. (2019). Excessive Cell Growth Causes Cytoplasm Dilution And Contributes to Senescence. Cell 176, 1083-+. [DOI] [PMC free article] [PubMed] [Google Scholar]
- Newman JR, Ghaemmaghami S, Ihmels J, Breslow DK, Noble M, DeRisi JL, and Weissman JS (2006). Single-cell proteomic analysis of S. cerevisiae reveals the architecture of biological noise. Nature 441, 840–846. [DOI] [PubMed] [Google Scholar]
- Novick P, Field C, and Schekman R (1980). Identification of 23 complementation groups required for post-translational events in the yeast secretory pathway. Cell 21, 205–215. [DOI] [PubMed] [Google Scholar]
- Padovan-Merhar O, Nair GP, Biaesch AG, Mayer A, Scarfone S, Foley SW, Wu AR, Churchman LS, Singh A, and Raj A (2015). Single mammalian cells compensate for differences in cellular volume and DNA copy number through independent global transcriptional mechanisms. Mol Cell 58, 339–352. [DOI] [PMC free article] [PubMed] [Google Scholar]
- Pan KZ, Saunders TE, Flor-Parra I, Howard M, and Chang F (2014). Cortical regulation of cell size by a sizer cdr2p. Elife 3, e02040. [DOI] [PMC free article] [PubMed] [Google Scholar]
- Polanshek MM (1977). Effects of heat shock and cycloheximide on growth and division of the fission yeast, Schizosaccharomyces pombe. With an Appendix. Estimation of division delay for S. pombe from cell plate index curves. J Cell Sci 23, 1–23. [DOI] [PubMed] [Google Scholar]
- Porro D, Brambilla L, and Alberghina L (2003). Glucose metabolism and cell size in continuous cultures of Saccharomyces cerevisiae. FEMS Microbiol Lett 229, 165–171. [DOI] [PubMed] [Google Scholar]
- Proctor SA, Minc N, Boudaoud A, and Chang F (2012). Contributions of turgor pressure, the contractile ring, and septum assembly to forces in cytokinesis in fission yeast. Curr Biol 22, 1601–1608. [DOI] [PMC free article] [PubMed] [Google Scholar]
- Rojas E, Theriot JA, and Huang KC (2014). Response of Escherichia coli growth rate to osmotic shock. Proc Natl Acad Sci U S A 111, 7807–7812. [DOI] [PMC free article] [PubMed] [Google Scholar]
- Sanchez-Mir L, Soto T, Franco A, Madrid M, Viana RA, Vicente J, Gacto M, Perez P, and Cansado J (2014). Rho1 GTPase and PKC Ortholog Pck1 Are Upstream Activators of the Cell Integrity MAPK Pathway in Fission Yeast. Plos One 9. [DOI] [PMC free article] [PubMed] [Google Scholar]
- Schmoller KM, Turner JJ, Koivomagi M, and Skotheim JM (2015). Dilution of the cell cycle inhibitor Whi5 controls budding-yeast cell size. Nature 526, 268–272. [DOI] [PMC free article] [PubMed] [Google Scholar]
- Schutt KL, and Moseley JB (2017). Transient activation of fission yeast AMPK is required for cell proliferation during osmotic stress. Molecular Biology of the Cell 28, 1804–1814. [DOI] [PMC free article] [PubMed] [Google Scholar]
- Schwanhausser B, Busse D, Li N, Dittmar G, Schuchhardt J, Wolf J, Chen W, and Selbach M (2011). Global quantification of mammalian gene expression control. Nature 473, 337–342. [DOI] [PubMed] [Google Scholar]
- Shivanandan A, Radenovic A, and Sbalzarini IF (2013). MosaicIA: an ImageJ/Fiji plugin for spatial pattern and interaction analysis. Bmc Bioinformatics 14. [DOI] [PMC free article] [PubMed] [Google Scholar]
- Springer M, Weissman JS, and Kirschner MW (2010). A general lack of compensation for gene dosage in yeast. Mol Syst Biol 6, 368. [DOI] [PMC free article] [PubMed] [Google Scholar]
- Sveiczer A, Novak B, and Mitchison JM (1996). The size control of fission yeast revisited. J Cell Sci 109 (Pt 12), 2947–2957. [DOI] [PubMed] [Google Scholar]
- Torres EM, Sokolsky T, Tucker CM, Chan LY, Boselli M, Dunham MJ, and Amon A (2007). Effects of aneuploidy on cellular physiology and cell division in haploid yeast. Science 317, 916–924. [DOI] [PubMed] [Google Scholar]
- Torres EM, Springer M, and Amon A (2016). No current evidence for widespread dosage compensation in S. cerevisiae. Elife 5, e10996. [DOI] [PMC free article] [PubMed] [Google Scholar]
- Tsai HJ, Nelliat AR, Choudhury MI, Kucharavy A, Bradford WD, Cook ME, Kim J, Mair DB, Sun SX, Schatz MC, et al. (2019). Hypo-osmotic-like stress underlies general cellular defects of aneuploidy. Nature 570, 117–121. [DOI] [PMC free article] [PubMed] [Google Scholar]
- Tyanova S, Temu T, and Cox J (2016). The MaxQuant computational platform for mass spectrometry-based shotgun proteomics. Nat Protoc 11, 2301–2319. [DOI] [PubMed] [Google Scholar]
- Tzur A, Kafri R, LeBleu VS, Lahav G, and Kirschner MW (2009). Cell growth and size homeostasis in proliferating animal cells. Science 325, 167–171. [DOI] [PMC free article] [PubMed] [Google Scholar]
- Ursell T, Lee TK, Shiomi D, Shi H, Tropini C, Monds RD, Colavin A, Billings G, Bhaya-Grossman I, Broxton M, et al. (2017). Rapid, precise quantification of bacterial cellular dimensions across a genomic-scale knockout library. BMC Biol 15, 17. [DOI] [PMC free article] [PubMed] [Google Scholar]
- Waldron C, and Lacroute F (1975). Effect of Growth-Rate on Amounts of Ribosomal and Transfer Ribonucleic-Acids in Yeast. J Bacteriol 122, 855–865. [DOI] [PMC free article] [PubMed] [Google Scholar]
- Willis L, and Huang KC (2017). Sizing up the bacterial cell cycle. Nat Rev Microbiol 15, 606–620. [DOI] [PubMed] [Google Scholar]
- You C, Okano H, Hui S, Zhang Z, Kim M, Gunderson CW, Wang YP, Lenz P, Yan D, and Hwa T (2013). Coordination of bacterial proteome with metabolism by cyclic AMP signalling. Nature 500, 301–306. [DOI] [PMC free article] [PubMed] [Google Scholar]
- Zhao Y, Sohn JH, and Warner JR (2003). Autoregulation in the biosynthesis of ribosomes. Mol Cell Biol 23, 699–707. [DOI] [PMC free article] [PubMed] [Google Scholar]
- Zhou X, Halladin DK, Rojas ER, Koslover EF, Lee TK, Huang KC, and Theriot JA (2015). Bacterial division. Mechanical crack propagation drives millisecond daughter cell separation in Staphylococcus aureus. Science 348, 574–578. [DOI] [PMC free article] [PubMed] [Google Scholar]
Associated Data
This section collects any data citations, data availability statements, or supplementary materials included in this article.
Supplementary Materials
Data Availability Statement
Custom Matlab code used to analyze growth rate, generate statistics, and analyze GEM diffusion can be found on GitHub: https://github.com/bknapp8/supergrowth_scripts. The source data for figures in the paper is available from the authors upon request.