Abstract
Purpose:
To develop predictive nomograms for overall survival (OS), progression-free survival (PFS), and time-to-progression (TTP) at 5-years in patients with early-stage non-small-cell lung cancer (ES-NSCLC) treated with stereotactic ablative radiotherapy (SABR).
Methods and Materials:
The study cohort included 714 ES-NSCLC patients treated with SABR from 2004—2015 with median follow-up of 59 months, divided into training and testing sets (8:2), with the former used for nomogram development. The least absolute shrinkage and selection operator was initially employed to screen for predictors of OS, PFS, and TTP; and identified predictors were subsequently applied towards Cox proportional hazards regression modeling. Significant predictors (p-value<0.05) on multivariable regression were then utilized to develop nomograms, which were validated via evaluation of concordance indexes (C-index) and calibration plots. Finally, Kaplan-Meier method and Gray’s test were employed to compare and confirm differences in outcomes among various groups and explore prognostic factors associated with local versus distant disease progression.
Results:
Significant predictors of both OS and PFS at 5-years included age, gender, Charlson comorbidity index (CCI), diffusing capacity of carbon monoxide (DLCO), systemic immune-inflammation index (SII), and tumor size (p≤0.01 for all). Eastern Cooperative Oncology Group (ECOG) performance status predicted for OS as well (p=0.01), while both tumor size (p<0.01) and minimum biological equivalent dose to 95% of planning target volume (PTV D95 BED10) [p<0.01] were predictive of TTP. The C-indexes for the OS, PFS, and TTP nomograms were 0.73, 0.68, and 0.60 in the training dataset, and 0.72, 0.66, and 0.59 in the testing dataset, respectively. Tumor size>2.45-cm and PTV D95 BED10<113-Gy were significantly associated with both local and distant progression.
Conclusions:
These prognostic nomograms can accurately predict for OS, PFS, and TTP at 5-years after SABR for ES-NSCLC, and may thus help identify high-risk patients who could benefit from additional systemic therapy.
INTRODUCTION
Stereotactic ablative radiotherapy (SABR) has been the standard treatment for medically inoperable patients with early-stage non-small cell lung cancer (ES-NSCLC) and is considered a suitable alternative for high risk surgical candidates[1]. However, clinical outcomes after SABR for ES-NSCLC vary significantly between different studies: three-year overall survival (OS) ranges from 37% to 72%, while recurrence rates vary between 18% to 29%[2–4]. Yet as we transit further into the era of personalized medicine, the ability to accurately predict the prognosis of these patients is essential to guide individualized clinical decision-making.
Among the various statistical prediction models, nomograms can be accurate and feasible prognostic instruments with high utility in estimating individual patient risk and may thus help guide treatment decisions in clinical practice. At present, there have been two nomograms developed for ES-NSCLC treated with SABR. The Amsterdam prognostic model, reported by Louie et al.[5], was the first nomogram developed for such patients and demonstrated promise in survival predictions; however, OS was the only reported endpoint in this study. In contrast, the second model, by Ye et al.[6], was developed from a small sample database of 182 patients, lending to concerns regarding applicability and detection of important prognostic factors[7]. Therefore, a need exists for a robust recurrence-related prediction model to help select high-risk candidates who may benefit from additional systemic therapies.
Furthermore, these previous studies fail to incorporate novel inflammation-related prognostic factors which have emerged only recently in the immunotherapy era. Cancer-related inflammation is known to be associated with tumor development, proliferation, angiogenesis, and metastasis, indicating the significance of inflammation-related factors as prognostic markers for cancer patients[8]. For example, neutrophil-to-lymphocyte ratio (NLR) and platelet-to-lymphocyte ratio (PLR) have been demonstrated to be independent prognostic factors for survival in ES-NSCLC patients treated with SABR[9–11]. In particular, systemic immune-inflammation index (SII; calculated as platelet counts × neutrophil counts ÷ lymphocyte counts) was identified to be independently associated with survival for patients with surgically-resected and advanced NSCLC[12–14], as well as for stage III patients undergoing chemoradiotherapy[15]. Given the expanding corroborating evidence, these readily available and low-cost inflammatory biomarkers merit further investigation; and inclusion of these factors in nomogram models could perhaps improve the precision and accuracy of prognostic prediction.
Therefore, the objective of our study was to identify prognostic factors of survival and recurrence in a large population of ES-NSCLC patients treated with SABR with extensive follow-up; then develop and validate new prognostic nomogram models incorporating all significant patient, tumor, and treatment-related variables. Furthermore, we also investigated the specific effects of progression-related prognostic factors on the different types of recurrence (i.e. local or distant), which may help select high-risk candidates who could benefit from chemotherapy and/or immunotherapy in addition to SABR.
METHODS AND MATERIALS
Study Cohort and Data Collection
This study was conducted with the approval of our Institutional Review Board. A total of 912 NSCLC patients who received image-guided SABR for stage T1-3N0M0 disease between January 1, 2004 and December 31, 2014 were identified from the database of our institution. Patients with history of other malignancies were excluded, leaving 714 patients eligible for analysis. Medical records were retrospectively reviewed to obtain baseline patient, tumor, and treatment characteristics.
Patient-related factors included: age, gender, Eastern Cooperative Oncology Group (ECOG) performance status score, Charlson comorbidity index (CCI), forced expiratory volume in 1 second (FEV1), diffusing capacity of carbon monoxide (DLCO), NLR pre-SABR, PLR pre-SABR, and SII pre-SABR. While both pre- and post-SABR values of these inflammatory factors were available and initially included in preliminary analyses, there was significant heterogeneity in the time intervals for lab testing after SABR. Therefore, only pre-SABR values were included for final analyses.
Regarding tumor characteristics, the following were evaluated: maximum size (diameter), histology, location, and maximum standard uptake value of 18F-fluorodeoxyglucose positron emission tomography scan (SUVmax). And finally, treatment-related variables entailed total radiation dose and number of fractions, mean biological equivalent dose to the planning target volume (PTVmean BED10), and minimum biological equivalent dose to 95% of the planning target volume (PTV D95 BED10). BED10 was calculated assuming a tumor α/β ratio of 10. Following initial analyses, maximum biological equivalent dose to the planning target volume (PTVmax BED10) was incorporated as an additional variable and the data were reanalyzed in whole, with PTVmax BED10 ultimately not selected as a predictor for any endpoint. Specific SABR protocol and follow-up evaluations were conducted as previously described [2].
Statistical Analysis
All statistical analyses were conducted with R (http://www.R-project.org; The R Foundation). The significance level for all analyses was set at 0.05.
Baseline Characteristics Analysis and Study Endpoints
To address concerns for a small proportion of missing variables, we conducted multiple imputations of the entire dataset. For each missing value, we imputed ten numbers for robustness. The study population was randomly dichotomized into two groups: 80% in the training and 20% in the testing group, respectively. These two groups had the same survival rates (confirming appropriate random sampling). Continuous variables were summarized by median and range, while categorical variables were summarized by frequency and proportion. Comparisons of baseline characteristics between training and testing groups were performed with t-test or Chi-square test, as appropriate. OS was calculated from SABR completion to death or last follow-up (right-censored), and progression-free survival (PFS) was calculated with both failure (at any site) or death as events. Time to progression (TTP) was defined as the duration from SABR completion to failure at any site. Progression-free rate (PFR) was defined as the proportion of patients without disease progression after SABR[16, 17], calculated at 3- and 5-years in our study. The Kaplan-Meier method was used for time-to-event analyses.
Nomogram Development
The training dataset (n=572) was used for initial nomogram development. The least absolute shrinkage and selection operator (LASSO) was employed for variable selection to refine the model structures for OS, PFS and TTP, with the optimal LASSO penalty determined using a 10-fold cross validation. The most parsimonious Cox proportional hazards regression models for OS, PFS and TTP were then fitted to obtain parameter estimates, with all insignificant predictors (p-value >0.05) excluded.
Nomogram Validation
Nomogram model validation was conducted in two steps. First, the concordance index (C-index), defined as the time-dependent area under the receiver operating characteristic (ROC) curve[18], was calculated to evaluate the discrimination ability of the models. The C-index ranges from 0.5 (random chance) to 1 (perfect prediction) and it is generally considered that the model is good when C-index exceeding 0.7 and excellent when C-index over 0.8[19, 20]. Second, calibration plots were used to assess for concordance between nomogram-predicted probability and Kaplan-Meier estimate[7]. Bootstrapping method was used with 1,000 resamplings to produce the calibration plot. A calibration curve of 45-degrees indicates a perfect prognostic prediction.
Recurrence Analysis with Predictors for TTP
To investigate the effects of different TTP-related predictors on specific progression type—including total recurrence (TR), local recurrence (LR), regional recurrence (RR), and distant metastasis (DM)—we calculated the cumulative incidences of recurrence using the Kaplan-Meier method, with death as a competing risk. ROC curves were used to identify optimal cut-off values for continuous predictors. Gray’s test was subsequently employed to compare cumulative recurrence rates among groups.
RESULTS
Characteristics of All Included Patients
In total, 912 ES-NSCLC patients were consecutively treated with SABR from 2004 to 2015 at our institution, and 714 without pre-existing history of other malignancies were eligible for analysis. Baseline characteristics of patients in the training and testing group are presented in Table 1. No variables were significantly different between the two groups. The median age of all patients was 74 years (range: 47–92), and gender proportions (male-to-female) were essentially equivalent. The majority of patients (83%) had high performance status (ECOG 0–1). Biopsy was performed for nearly all cases (99%). Roughly one-third of patients (34%) were diagnosed with squamous cell carcinoma (SCC). Median tumor size was 2.0 cm (range: 0.5–7.0); and most tumors were ≤3.0 cm (85%), followed by 3.0 to 5.0 cm in size (14%).
Table 1.
Baseline patient, tumor, and treatment characteristics of all patients
| Characteristics | Training Group | Testing Group | p-value |
|---|---|---|---|
| NO. of Cases | 572 | 142 | |
| Patient Characteristics | |||
| Age, year | 0.809 | ||
| Median (Range) | 73.5 (46.7-89.8) | 73.5 (48.4-91.8) | |
| Gender | 0.548 | ||
| Male | 286 (50.0%) | 67 (47.2%) | |
| Female | 286 (50.0%) | 75 (52.8%) | |
| ECOG score | 0.910 | ||
| 0 | 44 (7.7%) | 11 (7.7%) | |
| 1 | 425 (74.3%) | 109 (76.8%) | |
| 2 | 95 (16.6%) | 20 (14.1%) | |
| 3 | 8 (1.4%) | 2 (1.4%) | |
| CCI (continuous) | 0.103 | ||
| Median (Range) | 3 (2-12) | 3 (2-8) | |
| CCI (categorical) | 0.520 | ||
| 0-2 | 177 (30.9%) | 40 (28.2%) | |
| ≥3 | 395 (69.1%) | 102 (71.8%) | |
| FEV1,% of predicted | 0.764 | ||
| Median (Range) | 65.0 (11-148) | 65.0 (19-148) | |
| DLCO,% of predicted | 0.737 | ||
| Median (Range) | 58.0 (14-136) | 59.5 (18-131) | |
| NLR before SABR | 0.730 | ||
| Median (Range) | 2.77 (0.03-25.36) | 2.74 (0.39-14.04) | |
| PLR before SABR | 0.955 | ||
| Median (Range) | 140.16 (0.92-944.44) | 145.7 (6.49-449.00) | |
| SII before SABR | 0.686 | ||
| Median (Range) | 621.58 (1.98-6005.51) | 616.96 (26.09-3931.45) | |
| Tumor Characteristics | |||
| Tumor size, cm | 0.905 | ||
| Median (Range) | 2.0 (0.5-7.0) | 2.0 (0.5-6.0) | |
| Tumor Histology | 0.620 | ||
| Non-SCC | 365 (63.8%) | 96 (67.6%) | |
| SCC | 201 (35.1%) | 44 (31.0%) | |
| No pathology | 6 (1.0%) | 4 (1.4%) | |
| Tumor location | 0.516 | ||
| Central | 88 (15.4%) | 25 (17.6%) | |
| Peripheral | 484 (84.6%) | 117 (82.4%) | |
| Tumor SUVmax | 0.227 | ||
| Median (Range) | 5.9 (0.0-45.0) | 5.0 (0.0-31.2) | |
| Treatment Characteristics | |||
| SABR prescription (Gy/fraction) | 0.910 | ||
| 50 Gy / 4 fractions | 444 (77.6%) | 111 (78.2%) | |
| 70 Gy / 10 fractions | 82 (14.3%) | 22 (15.5%) | |
| 54 Gy / 3 fractions | 21 (3.7%) | 4 (2.8%) | |
| Other | 25 (4.4%) | 5 (3.5%) | |
| PTV D95 BED10 (Gy) | 0.194 | ||
| Median (Range) | 113.3 (46.7-199.1) | 112.9 (53.3-150.1) | |
| PTVmean BED10 (Gy) | 0.148 | ||
| Median (Range) | 132.8 (64.6-236.2) | 132.6 (80.4-216.8) | |
Abbreviations: ECOG = Eastern Cooperative Oncology Group; CCI = Charlson comorbidity index; FEV1 = forced expiratory volume in 1 second; DLCO = diffusing capacity of carbon monoxide; NLR = neutrophil-to-lymphocyte ratio; SABR = stereotactic ablative radiotherapy; PLR = platelet-to-lymphocyte ratio; SII = systemic immune-inflammation index; SCC = squamous cell carcinoma; SUVmax = maximum standard uptake value of 18F-fluorodeoxyglucose positron emission tomography scan; PTVmean BED10 = mean biological equivalent dose to planning target volume; PTV D95 BED10 = minimum biological equivalent dose to 95% of planning target volume.
Survival and Recurrence Outcomes
Median follow-up time for the whole cohort was 59 months (interquartile range [IQR]: 39–87). Median OS was 57 months (95% confidence interval [95% CI]: 52–63), with 1-, 3-, and 5-year OS rates of 90%, 65%, and 49%, respectively. Median PFS was 40 months (95% CI: 34–45), with 1-, 3-, and 5-year PFS rates of 79%, 53%, and 40%, respectively. A total of 213 patients (30%) experienced disease recurrence, at a median TTP of 14 months (IQR: 6–24).
Nomogram Development
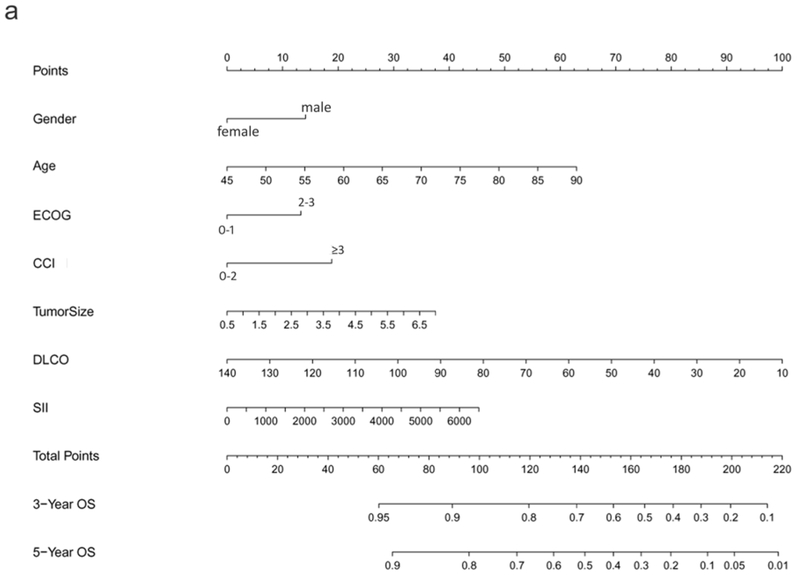
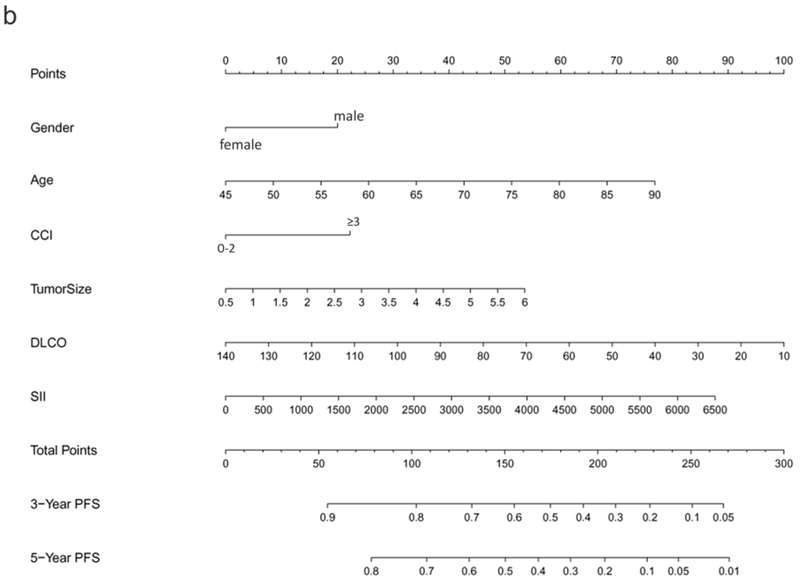
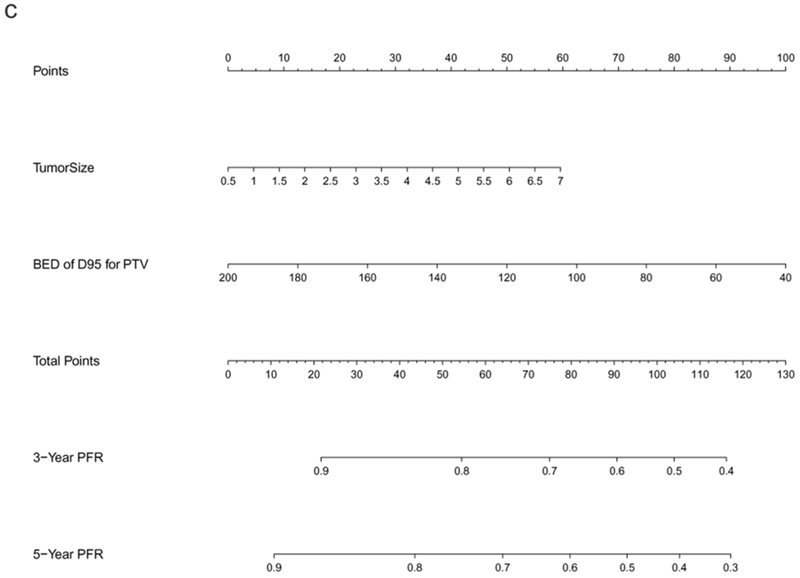
The preliminary Cox regression models for OS, PFS, and TTP, constructed from screened predictors via LASSO, are listed in Supplementary Table 1. The final selected significant predictors used for nomogram development and the effect of each predictor on the final model were presented in Table 2, demonstrating age, gender, ECOG, CCI, DLCO, SII, and tumor size to be significant predictors for OS. Regarding PFS, only age, gender, CCI, DLCO, SII, and tumor size were significant; and for TTP, significant predictors included tumor size and PTV D95 BED10. These nomogram models of OS, PFS, and TTP were established based on all significant predictors identified by LASSO. As shown in Figure 1, the 3- and 5-year OS, PFS, and PFR can be estimated for each individual patient using these nomogram models.
Table 2.
Hazard ratios (with 95% confidence intervals) of nomogram parameters for OS, PFS, and TTP
| OS | PFS | TTP | ||||
|---|---|---|---|---|---|---|
| Parameter | HR (95% CI) | p-value | HR (95% CI) | p-value | HR (95% CI) | p-value |
| Age | 1.0349 (1.0201-1.0499) | <0.001 | 1.0279 (1.0141-1.0418) | <0.001 | — | — |
| Gender | ||||||
| Male | 1 (reference) | - | 1 (reference) | - | — | — |
| Female | 0.6994 (0.5481-0.8925) | 0.004 | 0.7150 (0.5699-0.8969) | 0.004 | ||
| ECOG score | ||||||
| 0-1 | 1 (reference) | - | — | — | — | — |
| 2-3 | 1.4426 (1.0888-1.9113) | 0.010 | ||||
| CCI | ||||||
| 0-2 | 1 (reference) | - | 1 (reference) | - | — | — |
| ≥3 | 1.5913 (1.1942-2.1205) | 0.002 | 1.4135 (1.0922-1.8294) | 0.009 | ||
| DLCO, % of predicted | 0.9806 (0.9735-0.9876) | <0.001 | 0.9869 (0.9811-0.9928) | <0.001 | — | — |
| SII | 1.0002 (1.0001-1.0003) | 0.007 | 1.0002 (1.0001-1.0003) | 0.001 | — | — |
| Tumor size | 1.1673 (1.0363-1.3148) | 0.011 | 1.1632 (1.0449-1.2950) | 0.006 | 1.2338 (1.0685-1.4248) | 0.004 |
| PTV D95 BED10 | — | — | — | — | 0.9847 (0.9737-0.9958) | 0.007 |
Abbreviations: OS = overall survival; PFS = progression-free survival; TTP = time to progression; HR = hazard ratio; CI = confidence interval. Other abbreviations as in Table 1.
Figure 1.
Nomograms predicting 3- and 5-year prognoses for ES-NSCLC after SABR based on the training set (n=572): (a) overall survival (OS); (b) progression-free survival (PFS); and (c) progression-free rate (PFR). Note: to use the nomograms, the Score for each predictor is obtained by drawing a vertical line upward to the Points Axis, and the Total Risk Score is calculated by summating the scores associated with each predictor and is identified on the Total Points Axis. Thus, the final predicted 3- and 5-year prognoses are read by drawing a vertical line downward from Total Points to the lower scales.
Nomogram Validation
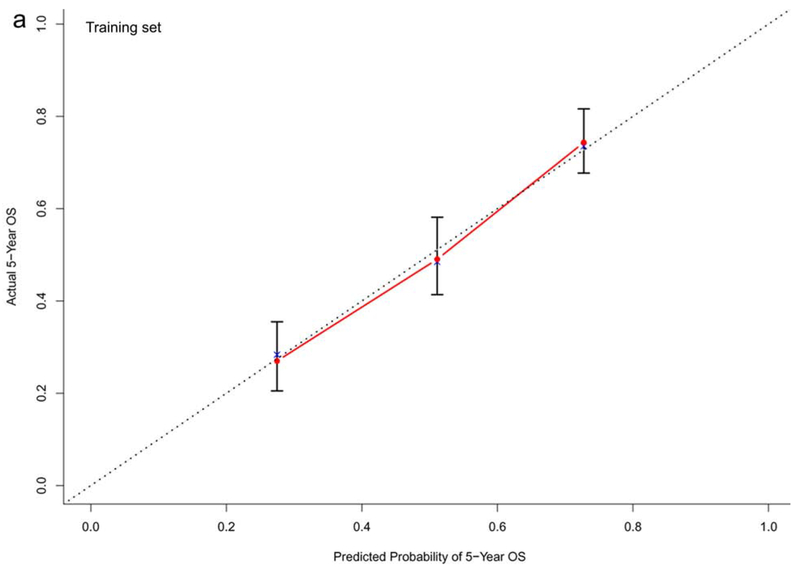
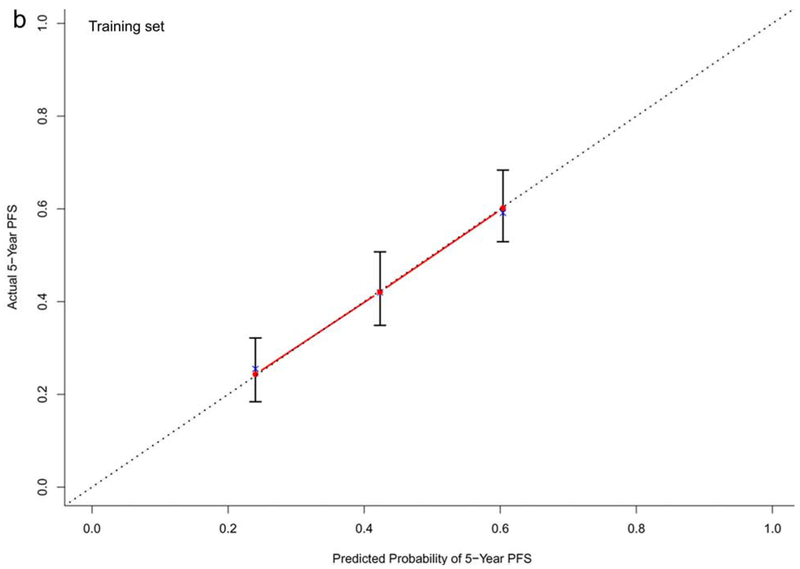
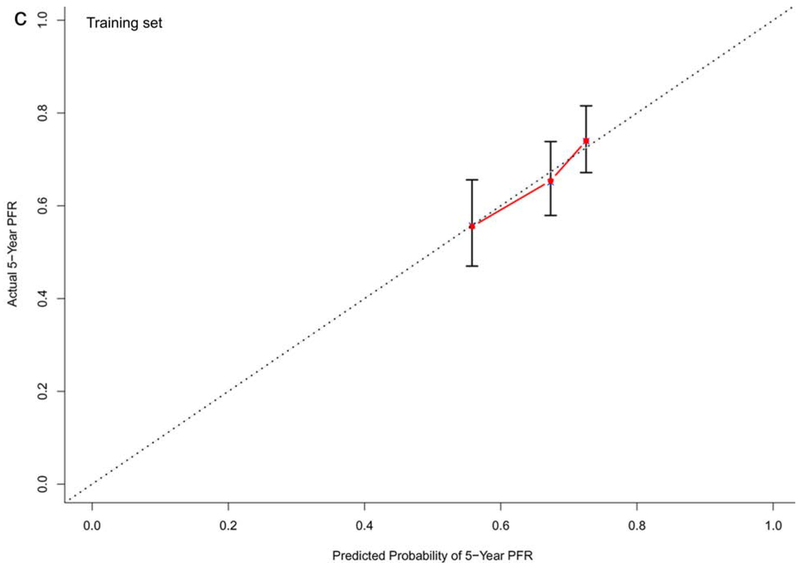
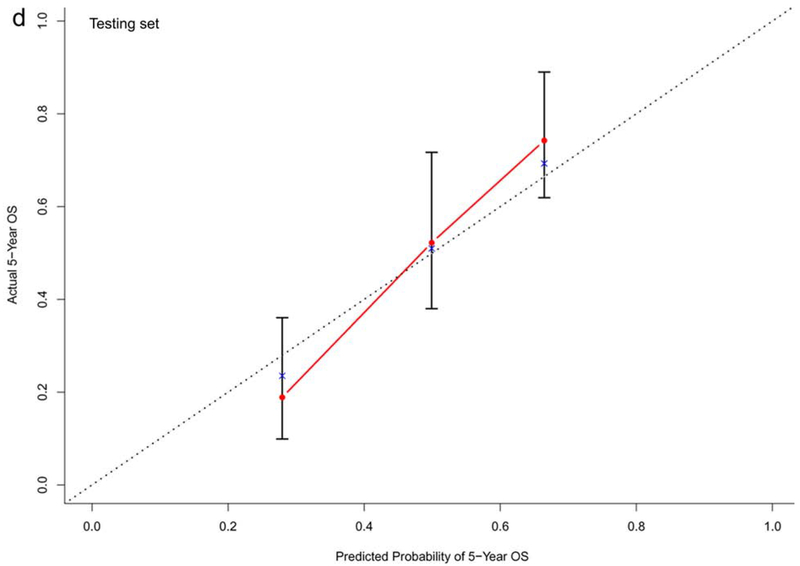
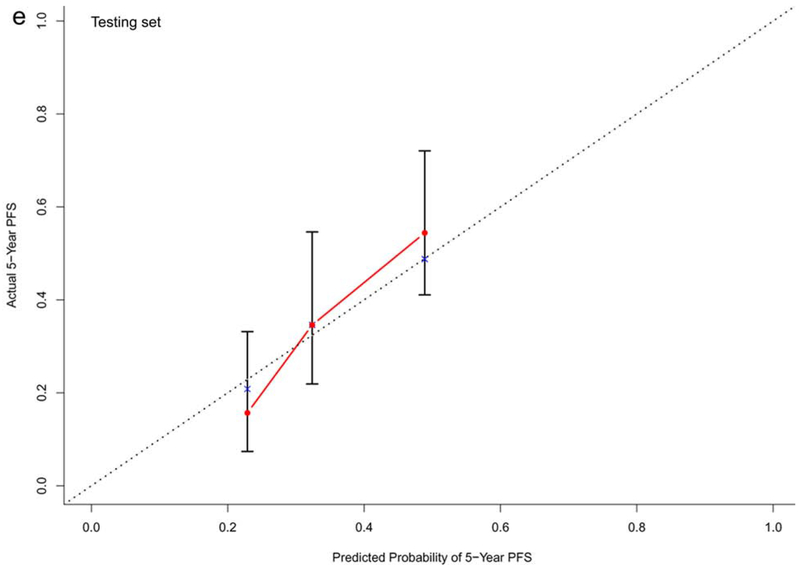
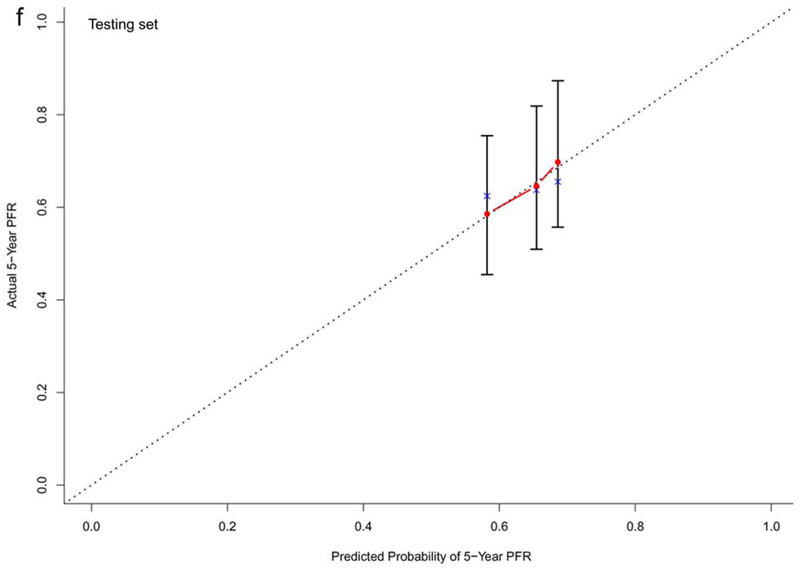
In the training dataset (n=572), the C-indexes of the nomogram models for OS, PFS and TTP were 0.73, 0.68, and 0.60, respectively. The corresponding C-indexes of the nomogram models in the testing dataset were 0.72, 0.66, and 0.59, respectively. The calibration plots presented in Figure 2 and Supplementary Figure 1 demonstrated optimal consistency among the predicted and observed prognoses for both the training and testing datasets.
Figure 2.
Calibration plots validating predictive nomograms for overall survival (OS), progression-free survival (PFS), and progression-free rate (PFR) at 5-years: (a) OS, (b) PFS, and (c) PFR in the training set (n=572); and (d) OS, (e) PFS, and (f) PFR in the testing set (n=142)
Effect of TTP-related Predictors on Recurrence
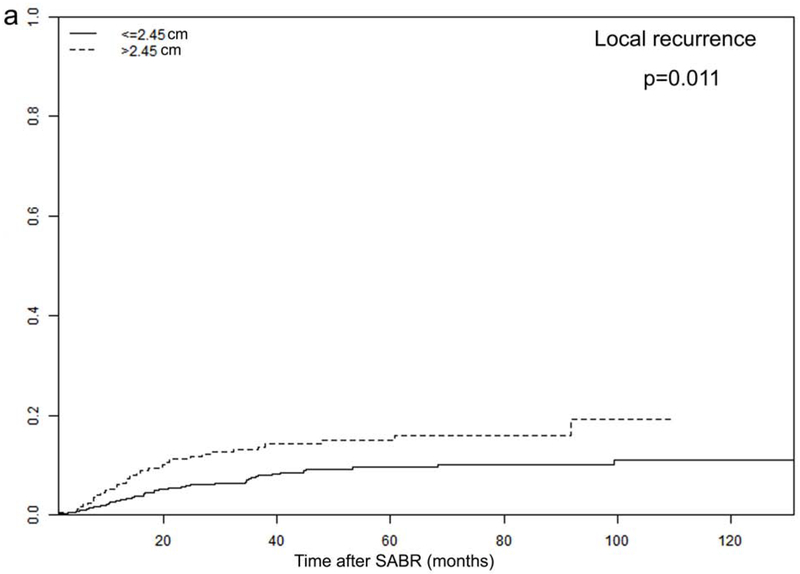
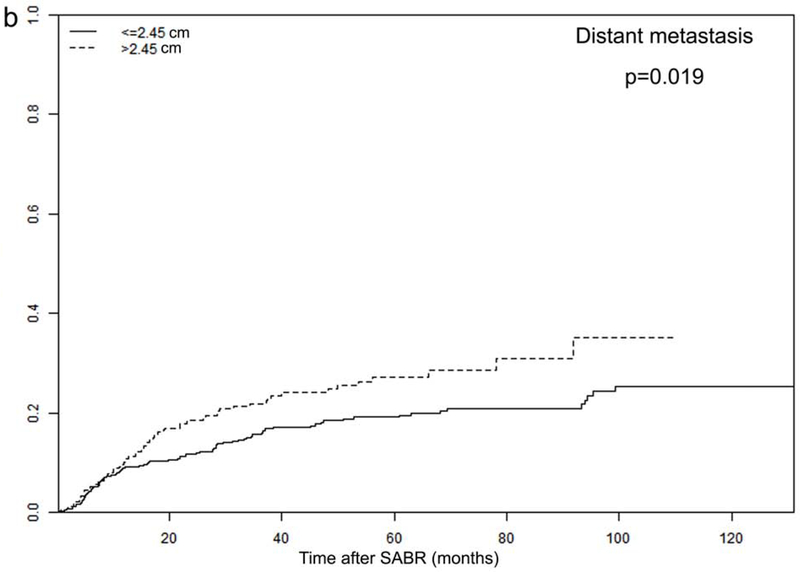
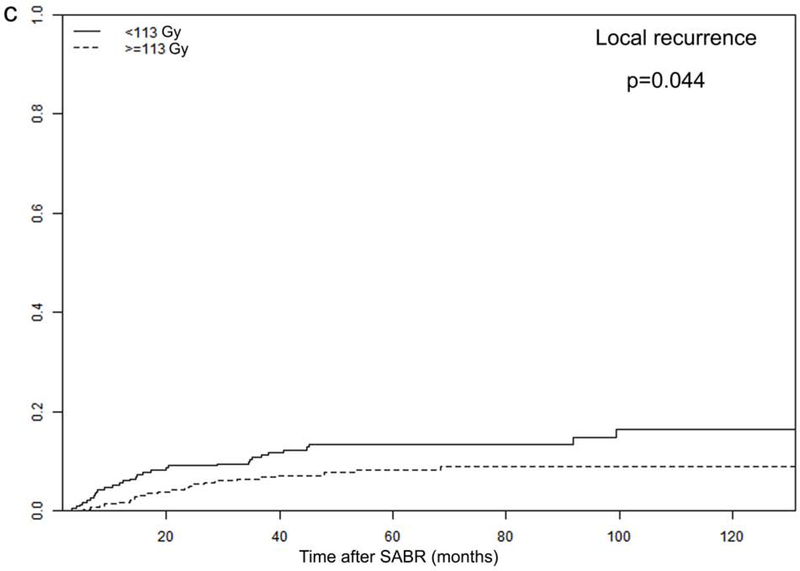
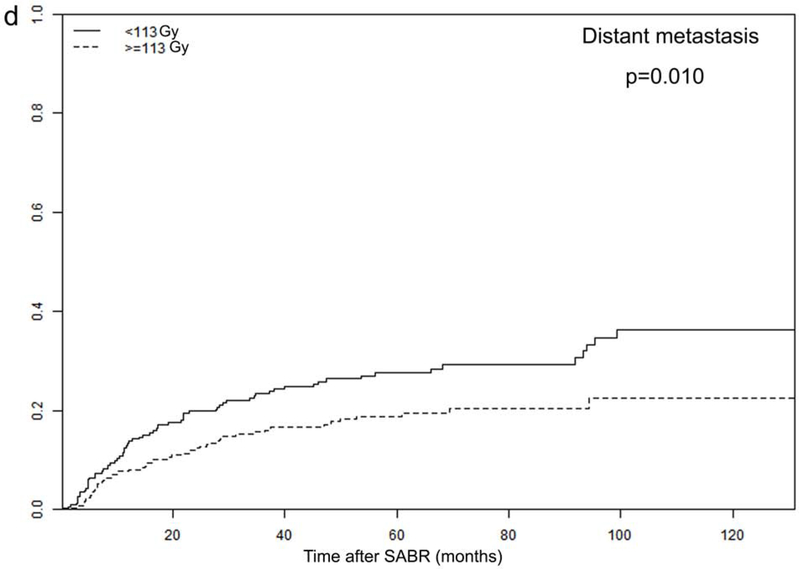
Tumor size and PTV D95 BED10 were identified as significant TTP-related predictors in our analysis. The optimal cut-off values for predicting progression were 2.45 cm for tumor size and 113 Gy for PTV D95 BED10, via ROC analysis. Consequently, all patients were dichotomized according to these optimal cut-off values (Figure 3 and Supplementary Figure 2).
Figure 3.
Recurrence rates among different subgroups: (a) local and (b) distant progression by different tumor size (>2.45 vs. ≤2.45 cm); and (c) local and (d) distant progression by different radiation dose (PTV D95 BED10 ≥113 vs. <113 Gy)
In order to further investigate the specific effects of these factors on various types of recurrence, we calculated the cumulative incidences of TR, LR, RR, and DM, using death as a competing risk in these groups. The results are presented in Figure 3 and Supplementary Figure 2, demonstrating that tumor size and PTV D95 BED10 were both significantly associated with TR, LR, and DM endpoints. Cumulative 2- and 5-year LR rates were 6% and 10% for patients with tumors ≤2.45 cm, and increased to 11% and 15% for patients with tumors >2.45 cm (p=0.011). Demonstrating a similar trend, the corresponding 2- and 5-year DM rates were 12% and 19% for smaller tumors (≤2.45 cm), increasing to 19% and 27% for larger tumors (>2.45 cm), respectively (p=0.019). Furthermore, the 2- and 5-year LR rates were significantly higher for patients receiving PTV D95 BED10 <113 Gy: 9% versus 5%, and 13% versus 8%, respectively (p=0.044). These findings were echoed with 2- and 5-year DM rates as well: 20% versus 12%, and 28% versus 19%, respectively (p=0.010).
No significant associations were found between RR and tumor size (p=0.46) or PTV D95 BED10 (p=0.17). The lack of significant association between RR and TTP-related predictors may be attributed to the small number of RR events (total n=87) in our study, causing low statistical power to detect significance for this endpoint. There is a trend noted in the separation of RR rate curves observed between different subgroups (Supplementary Figure 2B and Supplementary Figure 2D), especially for patients receiving different radiation doses (Supplementary Figure 2D). Thus, the association between RR and TTP-related predictors may reach significance with increasing sample size.
Tumor location (central or peripheral) was included as a variable in the aforementioned analyses and not identified as a prognostic predictor for survival or recurrence. To further investigate, the potential role of tumor location on specific progression type was also explored. The results showed that tumor location has no effect on TR (p=0.48), LR (p=0.11), RR (p=0.62), or DM (p=0.70); thus, tumor location was not identified as a recurrence-related predictor.
DISCUSSION
Based on a large patient population with extensive follow-up, we have constructed robust nomogram-based prognostic models of OS, PFS, and TTP at 5-years after SABR for ES-NSCLC. These nomogram models incorporate routinely available yet significant patient, tumor, and treatment-related factors to generate accurate prognostic predictions for individual patients. In turn, such predictions can play an important role in patient risk stratification and treatment decision making. Our models improve upon previously published nomograms[5, 6] in study population size, range of predictors, and evaluation of recurrence endpoints, together resulting in enhanced predictive ability and potential applicability towards clinical patient selection.
Given that 30% of patients with ES-NSCLC can experience regional or distant progression after SABR, there is likely utility for integrating additional systemic therapy alongside SABR alone[2, 4]. At the same time, previous studies[21] have demonstrated that widespread utilization of adjuvant chemotherapy, in the absence of appropriate candidate selection, can detrimentally affect patient outcomes. Therefore, the ability to select patients at high risk of recurrence (who would benefit most from combining systemic therapy with SABR) is essential.
To this end, our study identified both tumor size and PTV D95 BED10 as predictors of TTP following SABR for ES-NSCLC. Supporting initial nomogram findings, the cumulative recurrence rate analyses confirmed the significance of these two variables with respect to TR, LR, and DM. Such prognostic recurrence information can be helpful in selecting patients for additional systemic therapy in the setting of clinical practice, and perhaps even for refining trial enrollment criteria. According to our study, patients with tumors >2.45 cm or who receive PTV D95 BED10 <113Gy may benefit most from consideration of additional systemic therapy.
In our analysis, tumor size was also associated with survival outcomes after SABR for ES-NSCLC. These findings are supported by previous studies, which indicate larger tumor size as an independent predictor for negative prognosis (including LR)[5, 6, 22–24]. Multiple studies have proved the dose-response relationship in large tumors for ES-NSCLC after SABR[25–27]. Taken together such data indicate that, when safe and feasible, higher doses could perhaps be considered for optimal control of larger tumors. Dose boost to gross target volume as previously reported [23] can be implemented to achieve higher dose and also spare surrounding normal organs at the same time.
In addition, our study is novel in its incorporation of SII, a comprehensive hematological index based on the peripheral platelet, neutrophil and lymphocyte counts, with prognostic significance. SII has already been demonstrated as a strong prognostic predictor in a variety of malignant tumors[28–31], including NSCLC managed with chemoradiotherapy or surgery[12–15]; and our study is the first to date evaluating its predictive value in the setting of SABR for ES-NSCLC, confirming SII to be significantly associated with survival. SII which incorporates three hematological items was also superior to NLR and PLR as a survival predictor, consistent with a prior study of esophageal cancer[32].
These findings are increasingly relevant in the current immunotherapy era. Cancer-related inflammation is now known to play a crucial role at different stages of tumor development, with extensive engagement of inflammatory cells[33]. Thrombocytosis, neutrophilia, and lymphocytopenia, directly attributable to cancer-related inflammation, are in turn associated with tumor proliferation, angiogenesis, and metastasis, together contributing to worse outcomes. SII could show promise for selecting optimal candidates for immunotherapy, which has demonstrated benefit in NSCLC through modulation of the systemic immune condition[34].
Regarding other prognostic factors, age, gender, ECOG, and CCI were unsurprisingly associated with survival in our study. Higher pre-treatment DLCO was also identified as a significant predictor of survival after SABR for ES-NSCLC, while FEV1 was not, similar to previous surgical reports[35, 36]. Taken together, these data suggest that DLCO may be a superior surrogate for pulmonary function and survival prediction in the setting of ES-NSCLC.
Finally, while histology[22, 37] and SUVmax[6, 38] have been reported as significant prognostic factors for ES-NSCLC after SABR, neither were identified as significant in our study. Regarding the former, we posit that our high institutional prescription doses (with median BED10 of 112.5 Gy for the study population) may mitigate the adverse prognostic impact of SCC histology[39]. This hypothesis is corroborated by prior studies by Horner-Rieber et al[40] and Woody et al[41], both of which evaluated escalating prescription doses. As for the latter, we did find pre-SABR SUVmax to be significantly associated with distant failure (similar to previous report[38]), although not identified as a predictor for TTP in general.
There are several limitations associated with the present study. First, these nomogram models were developed using a single-institution retrospective database and would thus benefit from external validation at additional treatment centers. We are taking steps to seek external databases for additional validation and look forward to reporting the results of external validation in a subsequent study, which would also provide a larger sample size and may thus potentially elucidate an association between RR and TTP-related predictors. Second, since the median BED10 of the prescription doses in our study is 112.5 Gy (which falls into the optimal dose range for tumor control according to previous reports [39, 42–43]), the applicability of our models in patients treated with lower BED10 (<112.5 Gy) still requires validation. Additionally, caution should be exercised prior to applying these nomogram models in the setting of particularly large tumors (>5 cm), given the limited number of such patients (n=7) within our study population, as well as patients with ultra-central lesions (since ultra-central lesions are not treated with SABR per our institutional standard of care). Finally, while the prognostic merits of SII, PLR, and NLR after SABR are certainly exciting and demonstrate promise, additional studies are required to confirm their utility, particularly in the setting of SABR.
CONCLUSIONS
In summary, we have identified several highly significant predictors of OS, PFS, and TTP, and applied these to construct 5-year predictive nomogram models for ES-NSCLC patients after SABR. These models can generate accurate survival and recurrence outcome predictions for individualized patients, thus facilitating risk prognostication and personalized clinical decision-making. In turn, such nomograms could aid selection of candidates who may benefit from systemic therapy in addition to SABR for ES-NSCLC.
Supplementary Material
Acknowledgments
Funding: This work was supported by the National Institutes of Health [grant number CA016672] and the Joan and Herb Kelleher Charitable Foundation. Dr. Kang’s stipend was partly supported by the China Scholarship Council.
Conflict of Interest: The authors report no proprietary or commercial conflicts of interest with respect to any product mentioned or concept discussed in this article. Outside of the present submitted work, Dr. James Welsh reports research support from GlaxoSmithKline, Bristol Meyers Squibb, Merck, Nanobiotix, Mavu Pharma and Checkmate Pharmaceuticals. Dr. Welsh serves on the scientific advisory board for RefleXion Medical, MolecularMatch, OncoResponse, CheckMate, Mavu Pharmaceuticals, Alpine Immune Sciences. He is co-founder of Helios Oncology, MolecularMatch, and OncoResponse and serves as an advisor to Astra Zeneca, Merck, MolecularMatch, Incyte, Aileron and Nanobiotix. Dr. Welsh has the following patents: MP470 (amuvatinib), MRX34 regulation of PDL1, XRT technique to overcome immune resistance. MD Anderson Cancer Center has a trademark for RadScopal™. Dr. Chang reports grants from BMS as well as personal fees from AstraZenaca and Varian, and is a shareholder in Global Oncology One, all outside of the submitted work.
Footnotes
Publisher's Disclaimer: This is a PDF file of an unedited manuscript that has been accepted for publication. As a service to our customers we are providing this early version of the manuscript. The manuscript will undergo copyediting, typesetting, and review of the resulting proof before it is published in its final form. Please note that during the production process errors may be discovered which could affect the content, and all legal disclaimers that apply to the journal pertain.
REFERENCES
- 1.National Comprehensive Cancer Network. Clinical practice guidelines in oncology: non-small cell lung cancer,version 5, 2019. https://www.nccn.org/professionals/physician_gls/pdf/nscl.pdf (accessed June 7, 2019).
- 2.Brooks ED, Sun B, Feng L, et al. Association of Long-term Outcomes and Survival With Multidisciplinary Salvage Treatment for Local and Regional Recurrence After Stereotactic Ablative Radiotherapy for Early-Stage Lung Cancer. JAMA Netw Open 2018; 1(4):e181390 DOI: 10.1001/jamanetworkopen.2018.1390 [DOI] [PMC free article] [PubMed] [Google Scholar]
- 3.van den Berg LL, Klinkenberg TJ, Groen HJ, et al. Patterns of Recurrence and Survival after Surgery or Stereotactic Radiotherapy for Early Stage NSCLC. J Thorac Oncol 2015; 10(5):826–831. DOI: 10.1097/jto.0000000000000483 [DOI] [PubMed] [Google Scholar]
- 4.Senthi S, Lagerwaard FJ, Haasbeek CJ, et al. Patterns of disease recurrence after stereotactic ablative radiotherapy for early stage non-small-cell lung cancer: a retrospective analysis. Lancet Oncol 2012; 13(8):802–809. DOI: 10.1016/s1470-2045(12)70242-5 [DOI] [PubMed] [Google Scholar]
- 5.Louie AV, Haasbeek CJ, Mokhles S, et al. Predicting Overall Survival After Stereotactic Ablative Radiation Therapy in Early-Stage Lung Cancer: Development and External Validation of the Amsterdam Prognostic Model. Int J Radiat Oncol Biol Phys 2015; 93(1):82–90. DOI: 10.1016/j.ijrobp.2015.05.003 [DOI] [PubMed] [Google Scholar]
- 6.Ye L, Shi S, Zeng Z, et al. Nomograms for predicting disease progression in patients of Stage I non-small cell lung cancer treated with stereotactic body radiotherapy. Jpn J Clin Oncol 2018; 48(2):160–166. DOI: 10.1093/jjco/hyx179 [DOI] [PubMed] [Google Scholar]
- 7.Iasonos A, Schrag D, Raj GV, et al. How to build and interpret a nomogram for cancer prognosis. J Clin Oncol 2008; 26(8):1364–1370. DOI: 10.1200/jco.2007.12.9791 [DOI] [PubMed] [Google Scholar]
- 8.Mantovani A, Allavena P, Sica A, et al. Cancer-related inflammation. Nature 2008; 454(7203):436–444. DOI: 10.1038/nature07205 [DOI] [PubMed] [Google Scholar]
- 9.Shaverdian N, Veruttipong D, Wang J, et al. Pretreatment Immune Parameters Predict for Overall Survival and Toxicity in Early-Stage Non-Small-Cell Lung Cancer Patients Treated With Stereotactic Body Radiation Therapy. Clin Lung Cancer 2016; 17(1):39–46. DOI: 10.1016/j.cllc.2015.07.007 [DOI] [PubMed] [Google Scholar]
- 10.Cannon NA, Meyer J, Iyengar P, et al. Neutrophil-lymphocyte and platelet-lymphocyte ratios as prognostic factors after stereotactic radiation therapy for early-stage non-small-cell lung cancer. J Thorac Oncol 2015; 10(2):280–285. DOI: 10.1097/jto.0000000000000399 [DOI] [PubMed] [Google Scholar]
- 11.Luo H, Ge H, Cui Y et al. Systemic Inflammation Biomarkers Predict Survival in Patients of Early Stage Non-Small Cell Lung Cancer Treated With Stereotactic Ablative Radiotherapy - A Single Center Experience. J Cancer 2018; 9(1):182–188. DOI: 10.7150/jca.21703 [DOI] [PMC free article] [PubMed] [Google Scholar]
- 12.Gao Y Zhang H, Li Y et al. Preoperative increased systemic immune-inflammation index predicts poor prognosis in patients with operable non-small cell lung cancer. Clin Chim Acta 2018; 484:272–277. DOI: 10.1016/j.cca.2018.05.059 [DOI] [PubMed] [Google Scholar]
- 13.Guo D, Zhang J, Jing W, et al. Prognostic value of systemic immune-inflammation index in patients with advanced non-small-cell lung cancer. Future Oncol 2018; 14(25):2643–2650. DOI: 10.2217/fon-2018-0285 [DOI] [PubMed] [Google Scholar]
- 14.Guo W, Cai S, Zhang F, et al. Systemic immune-inflammation index (SII) is useful to predict survival outcomes in patients with surgically resected non-small cell lung cancer. Thorac Cancer 2019. DOI: 10.1111/1759-7714.12995 [DOI] [PMC free article] [PubMed] [Google Scholar]
- 15.Tong YS, Tan J, Zhou XL, et al. Systemic immune-inflammation index predicting chemoradiation resistance and poor outcome in patients with stage III non-small cell lung cancer. J Transl Med 2017; 15(1):221 DOI: 10.1186/s12967-017-1326-1 [DOI] [PMC free article] [PubMed] [Google Scholar]
- 16.Hirbe AC, Jennings J, Saad N, et al. A Phase II Study of Tumor Ablation in Patients with Metastatic Sarcoma Stable on Chemotherapy. Oncologist 2018; 23(7):760–e776. DOI: 10.1634/theoncologist.2017-0536 [DOI] [PMC free article] [PubMed] [Google Scholar]
- 17.Cremolini C, Antoniotti C, Lonardi S, et al. Activity and Safety of Cetuximab Plus Modified FOLFOXIRI Followed by Maintenance With Cetuximab or Bevacizumab for RAS and BRAF Wild-type Metastatic Colorectal Cancer: A Randomized Phase 2 Clinical Trial. JAMA Oncol 2018; 4(4):529–536. DOI: 10.1001/jamaoncol.2017.5314 [DOI] [PMC free article] [PubMed] [Google Scholar]
- 18.Chambless LE, Diao G. Estimation of time-dependent area under the ROC curve for long-term risk prediction. Stat Med 2006; 25(20):3474–3486. DOI: 10.1002/sim.2299 [DOI] [PubMed] [Google Scholar]
- 19.Pencina MJ, D’Agostino RB Sr. Evaluating Discrimination of Risk Prediction Models: The C Statistic. Jama 2015; 314(10):1063–1064. DOI: 10.1001/jama.2015.11082 [DOI] [PubMed] [Google Scholar]
- 20.Hosmer DW, Hjort NL. Goodness-of-fit processes for logistic regression: simulation results. Stat Med 2002; 21(18):2723–2738. DOI: 10.1002/sim.1200 [DOI] [PubMed] [Google Scholar]
- 21.Foster CC, Rusthoven CG, Sher DJ, et al. Adjuvant chemotherapy following stereotactic body radiotherapy for early stage non-small-cell lung cancer is associated with lower overall: A National Cancer Database Analysis. Lung Cancer 2019; 130:162–168. DOI: 10.1016/j.lungcan.2019.02.023 [DOI] [PubMed] [Google Scholar]
- 22.Shintani T, Matsuo Y, Iizuka Y, et al. A Retrospective Long-term Follow-up Study of Stereotactic Body Radiation Therapy for Non-Small Cell Lung Cancer From a Single Institution: Incidence of Late Local Recurrence. Int J Radiat Oncol Biol Phys 2018; 100(5):1228–1236. DOI: 10.1016/j.ijrobp.2018.01.050 [DOI] [PubMed] [Google Scholar]
- 23.Zhao L, Zhou S, Balter P, et al. Planning Target Volume D95 and Mean Dose Should Be Considered for Optimal Local Control for Stereotactic Ablative Radiation Therapy. Int J Radiat Oncol Biol Phys 2016; 95(4):1226–1235. DOI: 10.1016/j.ijrobp.2016.01.065 [DOI] [PubMed] [Google Scholar]
- 24.Matsuo Y, Shibuya K, Nagata Y, et al. Prognostic factors in stereotactic body radiotherapy for non-small-cell lung cancer. Int J Radiat Oncol Biol Phys 2011; 79(4):1104–1111. DOI: 10.1016/j.ijrobp.2009.12.022 [DOI] [PubMed] [Google Scholar]
- 25.Koshy M, Malik R, Weichselbaum RR, et al. Increasing radiation therapy dose is associated with improved survival in patients undergoing stereotactic body radiation therapy for stage I non-small-cell lung cancer. Int J Radiat Oncol Biol Phys 2015; 91(2):344–350. DOI: 10.1016/j.ijrobp.2014.10.002 [DOI] [PubMed] [Google Scholar]
- 26.Suzuki O, Mitsuyoshi T, Miyazaki M, et al. Dose-volume-response analysis in stereotactic radiotherapy for early lung cancer. Radiother Oncol 2014; 112(2):262–266. DOI: 10.1016/j.radonc.2014.07.004 [DOI] [PubMed] [Google Scholar]
- 27.Park S, Urm S, Cho H. Analysis of biologically equivalent dose of stereotactic body radiotherapy for primary and metastatic lung tumors. Cancer Res Treat 2014; 46(4):403–410. DOI: 10.4143/crt.2013.168 [DOI] [PMC free article] [PubMed] [Google Scholar]
- 28.Wang K, Diao F, Ye Z, et al. Prognostic value of systemic immune-inflammation index in patients with gastric cancer. Chin J Cancer 2017; 36(1):75 DOI: 10.1186/s40880-017-0243-2 [DOI] [PMC free article] [PubMed] [Google Scholar]
- 29.Hu B, Yang XR, Xu Y, et al. Systemic immune-inflammation index predicts prognosis of patients after curative resection for hepatocellular carcinoma. Clin Cancer Res 2014; 20(23):6212–6222. DOI: 10.1158/1078-0432.CCR-14-0442 [DOI] [PubMed] [Google Scholar]
- 30.Fan L, Wang R, Chi C, et al. Systemic immune-inflammation index predicts the combined clinical outcome after sequential therapy with abiraterone and docetaxel for metastatic castration-resistant prostate cancer patients. Prostate 2018; 78(4):250–256. DOI: 10.1002/pros.23465 [DOI] [PubMed] [Google Scholar]
- 31.Albany C Systemic immune-inflammation index in germ-cell tumours: search for a biological prognostic biomarker. Br J Cancer 2018; 118(6):761–762. DOI: 10.1038/bjc.2018.7 [DOI] [PMC free article] [PubMed] [Google Scholar]
- 32.Geng Y, Shao Y, Zhu D, et al. Systemic Immune-Inflammation Index Predicts Prognosis of Patients with Esophageal Squamous Cell Carcinoma: A Propensity Score-matched Analysis. Sci Rep 2016; 6:39482 DOI: 10.1038/srep39482 [DOI] [PMC free article] [PubMed] [Google Scholar]
- 33.Grivennikov SI, Greten FR, Karin M. Immunity, inflammation, and cancer. Cell 2010; 140(6):883–899. DOI: 10.1016/j.cell.2010.01.025 [DOI] [PMC free article] [PubMed] [Google Scholar]
- 34.Antonia SJ, Villegas A, Daniel D, et al. Overall Survival with Durvalumab after Chemoradiotherapy in Stage III NSCLC. N Engl J Med 2018; 379(24):2342–2350. DOI: 10.1056/NEJMoa1809697 [DOI] [PubMed] [Google Scholar]
- 35.Guerrera F, Errico L, Evangelista A, et al. Exploring Stage I non-small-cell lung cancer: development of a prognostic model predicting 5-year survival after surgical resectiondagger. Eur J Cardiothorac Surg 2015; 47(6):1037–1043. DOI: 10.1093/ejcts/ezu410 [DOI] [PubMed] [Google Scholar]
- 36.Berry MF, Yang CJ, Hartwig MG, et al. Impact of Pulmonary Function Measurements on Long-Term Survival After Lobectomy for Stage I Non-Small Cell Lung Cancer. Ann Thorac Surg 2015; 100(1):271–276. DOI: 10.1016/j.athoracsur.2015.02.076 [DOI] [PMC free article] [PubMed] [Google Scholar]
- 37.Baine MJ, Verma V, Schonewolf CA, et al. Histology significantly affects recurrence and survival following SBRT for early stage non-small cell lung cancer. Lung Cancer 2018; 118:20–26. DOI: 10.1016/j.lungcan.2018.01.021 [DOI] [PubMed] [Google Scholar]
- 38.Clarke K, Taremi M, Dahele M, et al. Stereotactic body radiotherapy (SBRT) for non-small cell lung cancer (NSCLC): is FDG-PET a predictor of outcome? Radiother Oncol 2012; 104(1 ):62–66. DOI: 10.1016/j.radonc.2012.04.019 [DOI] [PubMed] [Google Scholar]
- 39.Shiue K, Cerra-Franco A, Shapiro R, et al. Histology, Tumor Volume, and Radiation Dose Predict Outcomes in NSCLC Patients After Stereotactic Ablative Radiotherapy. J Thorac Oncol 2018; 13(10):1549–1559. DOI: 10.1016/j.jtho.2018.06.007 [DOI] [PMC free article] [PubMed] [Google Scholar]
- 40.Horner-Rieber J, Bernhardt D, Dern J, et al. Histology of non-small cell lung cancer predicts the response to stereotactic body radiotherapy. Radiother Oncol 2017; 125(2):317–324. DOI: 10.1016/j.radonc.2017.08.029 [DOI] [PubMed] [Google Scholar]
- 41.Woody NM, Stephans KL, Andrews M, et al. A Histologic Basis for the Efficacy of SBRT to the lung. J Thorac Oncol 2017; 12(3):510–519. DOI: 10.1016/j.jtho.2016.11.002 [DOI] [PMC free article] [PubMed] [Google Scholar]
- 42.Stahl JM, Ross R, Harder EM, et al. The Effect of Biologically Effective Dose and Radiation Treatment Schedule on Overall Survival in Stage I Non-Small Cell Lung Cancer Patients Treated With Stereotactic Body Radiation Therapy. Int J Radiat Oncol Biol Phys 2016; 96(5):1011–1020. DOI: 10.1016/j.ijrobp.2016.08.033 [DOI] [PubMed] [Google Scholar]
- 43.Kestin L, Grills I, Guckenberger M, et al. Dose-response relationship with clinical outcome for lung stereotactic body radiotherapy (SBRT) delivered via online image guidance. Radiother Oncol 2014; 110(3):499–504. DOI: 10.1016/j.radonc.2014.02.002 [DOI] [PubMed] [Google Scholar]
Associated Data
This section collects any data citations, data availability statements, or supplementary materials included in this article.


