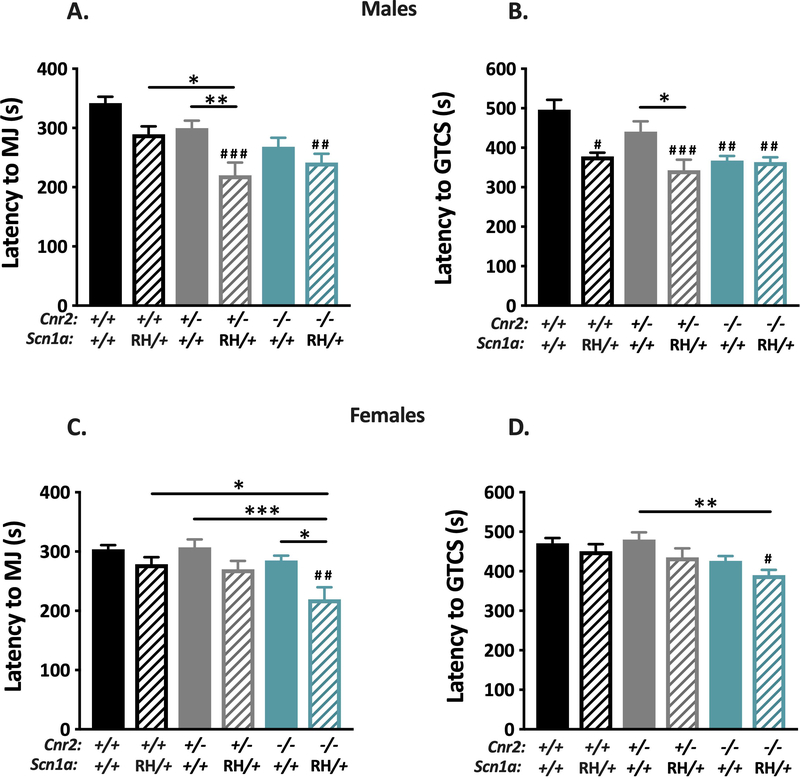
Figure 6. Deletion of CB2Rs does not worsen flurothyl-induced seizures in Scn1aRH/+ mutant mice.
A. Male Cnr2−/−/RH (teal stripe) and Cnr2+/−/RH (gray stripe) mutants exhibit decreased latency to the MJ when compared to WT (black) (##P < 0.01, ###P < 0.001). Cnr2+/−/RH mutants (gray stripe) also show decreased latency to the MJ when compared to RH (black stripe) (*P < 0.05) and Cnr2+/− (gray) (**P < 0.001). B. When compared to WT, RH (black stripe) (#P < 0.05), Cnr2+/−/RH (gray stripe) (###P < 0.001), Cnr2−/− (teal) (##P < 0.01 ), and Cnr2−/−/RH (teal stripe) male mutants (##P <0.01) exhibit significantly decreased latencies to GTCS. Cnr2+/−/RH mutants (gray stripe) exhibit significantly decreased latency to the GTCS compared to Cnr2+/− mice (gray) (*P < 0.05). C. Cnr2−/− /RH female mice (teal stripe) show significantly decreased latency to the MJ when compared to WT (black) (##P < 0.01), RH (black stripe) (*P < 0.05), Cnr2+/− (gray) (***P < 0.001), and Cnr2−/−(teal) (*P < 0.05) mice. D. Cnr2−/− /RH female mice (teal stripe) exhibit decreased latency to the GTCS when compared to WT (#P < 0.05) and Cnr2+/− mutant mice (gray) (**P < 0.01). 2-way ANOVA with Tukey’s post hoc comparison, n=8–12/group. Symbols above individual bars indicate significance from WT. Error bars represent mean +/− SEM

