

Abstract
The function and number of muscle stem cells (satellite cells, SCs) decline with muscle aging. Although SCs are heterogeneous and different subpopulations have been identified, it remains unknown whether a specific subpopulation of muscle SCs selectively decreases during aging. Here, we find that the number of SCs expressing high level of transcription factor Pax7 (Pax7Hi) is dramatically reduced in aged mice. Myofiber‐secreted granulocyte colony‐stimulating factor (G‐CSF) regulates age‐dependent loss of Pax7Hi cells, as the Pax7Hi SCs are replenished by exercise‐induced G‐CSF in aged mice. Mechanistically, we show that transcription of G‐CSF (Csf3) gene in myofibers is regulated by MyoD in a metabolism‐dependent manner. Furthermore, myofiber‐secreted G‐CSF acts as a metabolic niche factor required for establishing and maintaining the Pax7Hi SC subpopulation in adult and physiological aged mice by promoting the asymmetric division of Pax7Hi and Pax7Mi SCs. Together, our findings uncover that muscles provide a metabolic niche regulating Pax7 SC heterogeneity in mice.
Keywords: aged mice, asymmetric division, G‐CSF, metabolic niche, Pax7 satellite cells
Subject Categories: Ageing, Metabolism, Regenerative Medicine
Myofiber‐secreted G‐CSF promotes the dynamic heterogeneity of Pax7‐positive satellite cells in vivo by stimulating their asymmetric division.
Introduction
Reduced tissue regenerative potential is one of the general hallmarks in mammalian aging (Rando, 2006), and decline in the number and function of adult stem cells is the major causes that contribute to the failure of regeneration in several adult tissues during aging (Conboy et al, 2003; Nishimura et al, 2005; Rossi et al, 2005; Molofsky et al, 2006). However, the molecular mechanisms underlying this age‐dependent loss of adult stem cells in tissue regeneration are largely unknown. In adult skeletal muscle, muscle stem cells, also known as satellite cells (SCs), reside in a quiescent state between the basal lamina and the muscle fiber sarcolemma. SCs are responsible for postnatal muscle growth and regeneration after injury. SCs are also heterogeneous where different subpopulations have unique features of self‐renewal, proliferation, and differentiation during regeneration (Kuang et al, 2007; Wilson et al, 2008; Rocheteau et al, 2012). Pax7, a transcriptional factor, plays critical roles in regulating SC functions during development and regeneration (Seale et al, 2000; Sambasivan et al, 2011; von Maltzahn et al, 2013). It has been recently reported that Pax7‐positive SCs (Pax7 SCs) are heterogeneous including Pax7Hi and Pax7Lo subpopulations (Rocheteau et al, 2012; Wu et al, 2015). However, little is known regarding the functional establishment and maintenance of the heterogeneity of Pax7 SCs during development. During aging, the decline in number and function of Pax7 SCs is attributable to the loss of skeletal muscle mass and strength as well as the decreased regenerative capacity. More intriguingly, it remains unclear whether a specific subpopulation of Pax7 SCs decreases during aging and what are the dynamics of this heterogeneity in aged mice.
The microenvironment, or niche contributes significantly to the behaviors of adult stem cells, as first reported for germ stem cell niche of the Drosophila ovary (Xie & Spradling, 2000) and the hematopoietic stem cell niche in mammal (Schofield, 1978). However, little is known about which niche components are required to regulate the heterogeneity of adult stem cells. The identification of niche factors will help to elucidate the molecular mechanisms underlying the establishment and maintenance of adult stem cell heterogeneity during development and physiological aging. In skeletal muscle, Pax7 SCs were directly attached with two major types of muscle fibers which are defined based on their metabolic capacity: slow‐twitch oxidative fibers and fast‐twitch glycolytic fibers (Schiaffino & Reggiani, 2011). Interestingly, there is a link between the SC numbers/function and fiber metabolism, more SC cells on slow‐twitch oxidative fibers than that on fast‐twitch glycolytic fibers (Feldman & Stockdale, 1991; Lagord et al, 1998; Collins et al, 2005). Further, decline of SC numbers and function is correlated with fiber type switch from glycolytic fast‐twitch to oxidative slow‐twitch fiber during aging. These observations imply a possible effect of fiber metabolism on SC function and behavior during aging.
Skeletal muscle is a major secretory organ, and muscle fibers express and secrete various factors (e.g., IL‐6 and FGF‐2) that regulate skeletal muscle growth and regeneration in autocrine, paracrine, or endocrine manners (Pedersen & Febbraio, 2008, 2012). Given that muscle fibers exhibit metabolic heterogeneity, secrete factors that have paracrine function, and exhibit intimate contact with Pax7 SCs, we hypothesized that muscle fibers function as a metabolic niche for skeletal muscle SCs by supplying requisite factors that in turn regulate the heterogeneity of Pax7 SCs during development and aging in mice. In the present study, we tested this hypothesis using several experimental approaches. First, using single‐cell RNA sequencing, we demonstrate that Pax7Hi and Pax7Lo cells are two distinct subpopulations of satellite cells. More significantly, we uncover that the number of Pax7Hi subpopulation satellite cells is significantly reduced in aged mice. Mechanistically, we reveal that altered heterogeneity of Pax7 SCs is regulated by myofiber‐secreted granulocyte colony‐stimulating factor (G‐CSF), which is metabolically regulated by MyoD in myofibers and in turn interacts with its receptor, G‐CSFR, on Pax7 SCs. This interaction is required for establishing and maintaining the Pax7Hi SC subpopulation in adult and physiological aged mice by promoting the asymmetric division of Pax7Hi and Pax7Mi SCs.
Results
Characterization of Pax7Hi and Pax7Lo SCs by single‐cell RNA sequencing
Quiescent Pax7Hi and Pax7Lo cells isolated by FACS based on levels of GFP (Pax7) from tibialis anterior (TA) muscle of Pax7‐nGFP mice (Fig EV1A–D) were subjected to single‐cell RNA sequencing (scRNA‐Seq). We profiled 1,243 Pax7Hi cells and 3,960 Pax7Lo cells. The typical number of detectable genes ranged approximately from 1,000 to 2,000 genes in individual cells. Unsupervised hierarchal clustering analysis with the single‐cell RNA transcriptome indicated that quiescent Pax7Hi and Pax7Lo cells belonged to two distinctly clustered subpopulations (Fig 1A) as indicated with quiescent marker Vcam1 (Fig EV1E). Transcriptome comparisons between Pax7Hi and Pax7Lo subpopulations identified 428 differentially expression genes (LogFC > 0.25), which exhibit distinct gene signatures (Fig 1B). Furthermore, GO‐enriched analysis of the differentially expressed genes between those two subpopulations consistently validated the previously described features (Fig EV1F–H). Genes related to stemness were highly expressed in the Pax7Hi subpopulation and genes related to myogenic differentiation were highly expressed in the Pax7Lo subpopulation (Fig 1C). Additionally, we found that Pax7Hi cells expressed high levels of mitochondrial genes (Figs 1D and EV1I), suggesting that Pax7Hi cells were adapted to oxidative metabolism. Finally, several molecular markers for either Pax7Hi or Pax7Lo cells were identified in this study. Ptprb, Pvalb, Acta1, Hbb‐bt are for Pax7Hi cells and Cdh15, Rcan2, Rps28, Acta2 for Pax7Lo cells (Fig 1E and F). The expression patterns of these genes were validated by real‐time PCR (Fig EV1J). Together, the high‐resolution analysis using single‐cell RNA sequencing provides evidence that Pax7Hi and Pax7Lo cells represent two distinct subpopulations in mice. Therefore, the Pax7Hi and Pax7Lo cells used in the following experiments were FACS‐sorted based on the levels of Pax7 expression as previously reported (Rocheteau et al, 2012; Wu et al, 2015).
Figure EV1. Characterization of FACS‐sorted Pax7Hi and Pax7Lo cells.

-
A–DStrategy used for FACS sorting GFP+ cells from Pax7‐nGFP mice. Negative control for GFP gating is shown in (B). Pax7Hi and Pax7Lo two subpopulations were sorted by FACS at opposite ends of the spectrum of GFP expression levels. They each corresponded to 10% of the total population and named as Pax7Hi and Pax7Lo, respectively. The remaining 80% of SC in the middle were isolated and designated as Pax7Mi (C and D).
-
EExpression pattern of quiescent markers of satellite cells was visualized by t‐SNE plots.
-
FRelative expression of molecular markers for stemness and differentiation in FACS‐resolved Pax7Hi and Pax7Lo SCs from the TA muscles of Pax7‐nGFP mice, as determined by qRT‐PCR. Means ± SEM, n = 5. *P < 0.05. Unpaired two‐sided t‐test.
-
GRepresentative images of MyoD immunostaining (red) for FACS‐resolved Pax7 SCs cultured in growth medium (GM) for 18 h. DAPI was used to visualize nuclei (blue). Scale bar represents 20 μm.
-
HThe percentages of MyoD‐positive cells in (G) were calculated from three independent experiments. Means ± SEM, *P < 0.05. Unpaired two‐sided t‐test.
-
IExpression pattern of mitochondrial genes in Pax7Hi and Pax7Lo cells was visualized by t‐SNE plots.
-
JRelative expression of molecular markers in Pax7Hi cells and Pax7Lo cells FACS‐resolved from Pax7‐nGFP mice, as determined by qRT‐PCR. Means ± SEM, n = 5. **P < 0.01. ***P < 0.001. Unpaired two‐sided t‐test.
Figure 1. Transcriptional profile of Pax7Hi and Pax7Lo cells by single‐cell RNA‐seq.

- Two‐dimensional (2D) visualization of single‐cell profiles inferred from RNA‐seq data for Pax7Hi and Pax7Lo cells sorted from the TA muscle of young (3‐month‐old) Pax7‐nGFP mice. Each point is a single cell colored by cluster assignment.
- Heatmaps of normalized genes show Pax7Hi and Pax7Lo by top genes (columns) for individual cells (rows).
- Differentially expressed genes between Pax7Hi and Pax7Lo cells in heatmap view. Genes were labeled with the molecular function, as indicated.
- Expression patterns of mt‐Nd1, mt‐Co3, mt‐Co2, and mt‐Atp6 were visualized by t‐SNE plots.
- Top unique expressed genes in Pax7Hi cells were visualized by t‐SNE plots.
- Top unique expressed genes in Pax7Lo cells were visualized by t‐SNE plots.
Pax7Hi cells are significantly reduced in aged mice
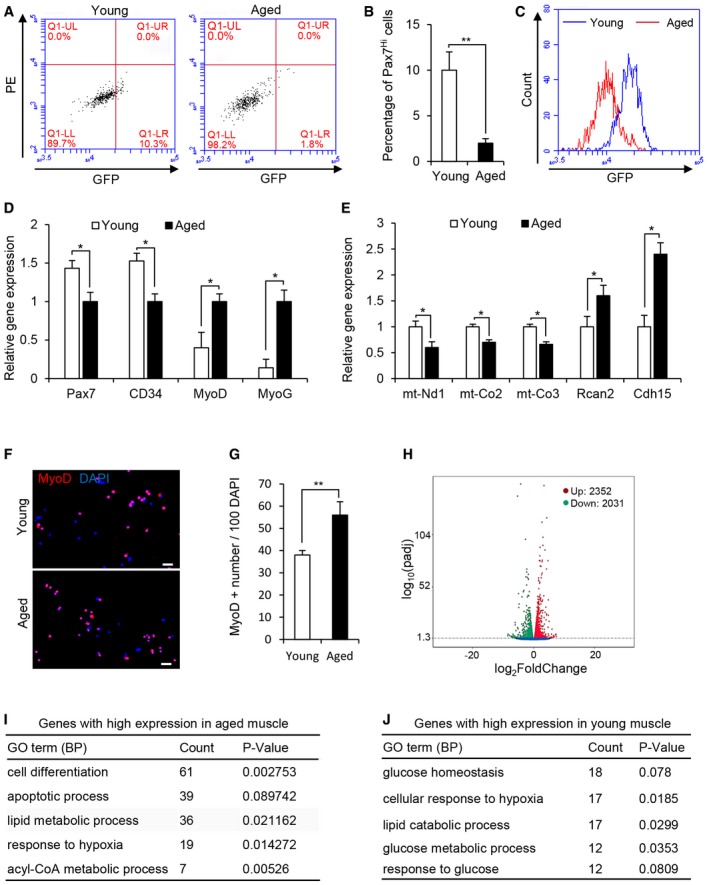
Given that the number and functionality of Pax7 SCs decline with age and Pax7Hi cells with more stem‐like properties represent a reversible dormant stem cell state and generate distinct daughter cell fates by asymmetrically segregating template DNA during muscle regeneration. We assessed whether the percentage of Pax7Hi cells was altered in aged mice. Satellite cells were sorted from TA muscle of young and aged Pax7‐nGFP mice, respectively. FACS profiling revealed that the percentage of Pax7Hi SCs was severely reduced in the TA muscle fibers of aged mice compared to young mice (Fig 2A–C). Consistent with this, we observed low levels of Pax7 and stemness‐related genes CD34, but high levels of myogenic differentiation‐related genes (MyoD and MyoG) in Pax7 SCs freshly isolated from aged TA muscle fibers versus young TA muscle fibers (Fig 2D). We also examined expression of newly identified genes as markers for either Pax7Hi or Pax7Lo cells, respectively. We found lower levels of Pax7Hi marker gene expression (mt‐Nd1, mt‐Co2, and mt‐Co3) but higher levels of Pax7Lo marker gene expression (Rcan2 and Cdh15) in Pax7 SCs freshly isolated from aged TA muscle fibers versus young TA muscle fibers (Fig 2E). Consistently, we observed that the activation of Pax7 SCs was significantly accelerated in the cells freshly isolated from aged TA muscle fibers versus the young TA muscle fibers (Fig 2F and G). Taken together, these results demonstrate that Pax7Hi cells were significantly reduced in aged mice.
Figure 2. Reduced Pax7Hi cells in aged mice.
-
ARepresentative FACS profiles of Pax7 SCs from the TA muscles of aged (18‐month‐old) and young (3‐month‐old) Pax7‐nGFP mice.
-
BThe percentages of Pax7Hi SCs in (A) were calculated. Means ± SEM, n = 5 for each group. **P < 0.05. Unpaired two‐sided t‐test.
-
CRepresentative overall profiles of the Pax7 SCs described in (A).
-
DRelative expression of molecular markers for stemness and differentiation in FACS‐resolved Pax7 SCs from the TA muscles of aged and young Pax7‐nGFP mice, as determined by qRT‐PCR. Means ± SEM, n = 5. *P < 0.05. Unpaired two‐sided t‐test.
-
ERelative expression of molecular markers for Pax7Hi cells and Pax7Lo cells in FACS‐resolved Pax7 SCs from the TA muscles of aged and young Pax7‐nGFP mice, as determined by qRT‐PCR. Means ± SEM, n = 5. *P < 0.05. Unpaired two‐sided t‐test.
-
FRepresentative images of MyoD immunostaining (red) for FACS‐resolved Pax7 SCs cultured in growth medium (GM) for 18 h. DAPI was used to visualize nuclei (blue). Scale bar represents 20 μm.
-
GThe percentages of MyoD‐positive cells in (F) were calculated from three independent experiments. Means ± SEM. **P < 0.05. Unpaired two‐sided t‐test.
-
HVolcano plot displayed the differentially expressed genes between aged and young TA muscles. Each point represents the log2 FoldChange and log10(padj) from three independent biological replicates. Red is upregulated genes in aged muscle compared to young one. Green is downregulated genes in aged muscle compared to young one. Blue represents genes with no change between aged and young muscle.
-
I, JGene ontology (GO) analyses of the differentially expressed genes between aged and young TA muscle are shown as biological process (BP). The enriched GO terms for genes with high expression in aged or young TA muscle are shown in (I) and (J), respectively. “Count” stand for the number of genes enriched in the indicated GO term. Fisher's exact P‐Value (P‐Value) is adopted to measure the gene enrichment in annotation terms. The differentially expressed genes between aged and young TA muscle were identified with cutoff (fold change > 1.5, P adj < 0.05).
Source data are available online for this figure.
Glycolytic metabolism of myofiber is required for the maintenance of Pax7Hi SC
To identify niche components in skeletal muscle that might be required for the maintenance of Pax7Hi cells in aged mice, we analyzed the transcriptomes of aged TA muscle and young TA muscle by RNA sequencing. RNA‐seq results from aged TA muscle and young TA muscle identified a large number of differentially regulated genes (Fig 2H). Gene ontology (GO) analyses of biological processes highlighted the changes in a number of genes encoding metabolic regulators in the transition from young to aged muscle (Fig 2I and J). The expression of genes corresponding to proteins that regulate lipid metabolic processes was upregulated (Figs 2I and Appendix Fig S1A), whereas that of genes regulating glucose metabolic processes was downregulated in aged TA muscle (Figs 2J and Appendix Fig S1B and C).To further confirm the metabolic shift during aging, we performed histochemical staining for α‐glycerophosphate dehydrogenase (α‐GPDH) and succinate dehydrogenase (SDH), which are enriched in glycolytic and oxidative myofibers, respectively. Aged TA muscle had higher SDH and lower α‐GPDH enzymatic activities compared to young TA muscles (Appendix Fig S1D). Altogether, these results indicate that muscle metabolism was shifted from a glycolytic to oxidative state during aging as previously reported (Holloszy et al, 1991).
Since skeletal muscle composed of glycolytic myofiber and oxidative myofiber and SCs were directly attached with muscle fibers, we reasoned that metabolism of muscle fibers as a metabolic niche regulating the heterogeneity of Pax7 SC cells. To this end, we examined the distributions of the Pax7Hi subpopulations in TA (predominantly glycolytic) and soleus (Sol, mainly oxidative) muscle fibers from the same individual Pax7‐nGFP reporter mice. Interestingly, the percentage of Pax7Hi SCs sorted from glycolytic TA muscle fibers was significantly higher than that sorted from oxidative Sol muscle fibers of the same animal (Fig 3A–C), indicating that the Pax7Hi SC subpopulation was enriched in glycolytic muscle fibers of these mice. Consistent with this, we observed higher levels of Pax7 and stemness‐related genes (CXCR4 and CD34) but lower levels of myogenic differentiation‐related genes (MyoG) in Pax7 SCs freshly isolated from TA muscle fibers versus Sol muscle fibers of the same mice (Fig 3D). We also examined expression of newly identified genes as markers for either Pax7Hi or Pax7Lo cells, respectively. We found higher levels of Pax7Hi marker gene expression (mt‐Nd1, mt‐Co2, mt‐Co3, Ptprb, and Hbb‐bt) but lower levels of Pax7Lo marker gene expression (Rcan2 and Cdh15) in Pax7 SCs freshly isolated from TA muscle fibers versus Sol muscle fibers of the same animal (Fig 3E). Consistently, we observed that the activation of Pax7 SCs was significantly delayed in the cells freshly isolated from TA muscle fibers versus the corresponding Sol muscle fibers (Fig 3F and G). To rule out the possibility that enrichment of Pax7Hi SCs in glycolytic TA muscle fibers is mediated by fiber type per se, we examined correlation between fiber type/fiber metabolism and the heterogeneity of Pax7 SC cells in TA and Sol muscle at 3 and 10 weeks, respectively. We found that the fiber type had been remarkably different between TA and Sol muscle of 3‐week mice (Fig EV2A and B), but the significant difference in muscle metabolism was occurred till 10 weeks (Fig EV2C–E). Interestingly, the significant difference in the percentage of Pax7Hi cells between TA and Sol muscle was only observed at 10 weeks but not at 3 weeks (Fig 3H), indicating that metabolic features of myofibers rather than muscle contraction associated with establishment of Pax7Hi subpopulations in TA muscle. Our results show for the first time that Pax7 SCs are remarkably heterogeneous between glycolytic and oxidative muscle fibers. This heterogeneity may be related to the metabolic activity of these muscle fibers under normal physiological conditions.
Figure 3. Glycolytic metabolism of myofiber associates with Pax7Hi SC subpopulation.

- Representative FACS profiles of Pax7 SCs sorted from Sol or TA muscles of Pax7‐nGFP mice. GFP, green fluorescence protein (488 channel); PE, phycoerythrin (594 channel).
- Average percentages of Pax7Hi SC subpopulations obtained from three independent FACS experiments, performed as described in panel (A). Means ± SEM. *P < 0.05. Unpaired two‐sided t‐test.
- Representative FACS profiles of total Pax7 SCs sorted from the Sol or TA muscles of Pax7‐nGFP mice. GFP, green fluorescence protein (488 channel).
- Relative expression of molecular markers for stemness and differentiation in FACS‐resolved Pax7 SCs from the TA and Sol muscles of Pax7‐nGFP mice, as determined by qRT‐PCR. Means ± SEM, n = 5. *P < 0.05. **P < 0.01. ***P < 0.001. Unpaired two‐sided t‐test.
- Relative expression of molecular markers in Pax7Hi cells and Pax7Lo cells of FACS‐resolved Pax7 SCs from the TA and Sol muscles of Pax7‐nGFP mice, as determined by qRT‐PCR. Means ± SEM, n = 5. *P < 0.05. **P < 0.01. ***P < 0.001. Unpaired two‐sided t‐test.
- Representative images of MyoD immunostaining (red) for FACS‐resolved Pax7 SCs cultured in growth medium (GM) for 18 h. DAPI was used to visualize nuclei (blue). Scale bar represents 20 μm.
- The percentages of MyoD‐positive cells in (F) were calculated from three independent experiments. Means ± SEM. *P < 0.05. Unpaired two‐sided t‐test.
- Average percentages of Pax7Hi SC subpopulations in TA and Sol muscle from 3 weeks and 10 weeks Pax7‐nGFP mice. Data were obtained from three independent FACS experiments. Means ± SEM. *P < 0.05. Unpaired two‐sided t‐test.
- Representative FACS profiles of total Pax7 SCs sorted from the TA muscles of Pax7‐nGFP;MCK‐PPARβ transgenic (TG) and Pax7‐nGFP wild‐type (WT) littermates. GFP, green fluorescence protein (488 channel).
- The percentages of Pax7Hi SCs in (I) were calculated from three independent experiments. Means ± SEM. *P < 0.05. Unpaired two‐sided t‐test.
- Representative FACS profiles of total Pax7 SCs sorted from the TA muscles of Pax7‐nGFP;MCK‐PPARβ transgenic (TG) and Pax7‐nGFP wild‐type (WT) littermates. GFP, green fluorescence protein (488 channel).
Source data are available online for this figure.
Figure EV2. Fiber type composition and metabolic status in TA and Sol muscle and in TA muscle of MCK‐PPARβ‐TG .

-
ARelative expression of Myh7 in TA and Sol muscles from three and 10 weeks C57BL/6 mice, as determined by qRT‐PCR. Means ± SEM, n = 5. **P < 0.01. ***P < 0.001. Unpaired two‐sided t‐test.
-
BRepresentative immunostaining of type I myofibers in TA and Sol muscle from three and 10 weeks mice. Scale bar represents 200 μm.
-
C, DRelative expression of HK2 (C) and PFK1 (D) in TA and Sol muscles from three and 10 weeks mice, as determined by qRT‐PCR. Means ± SEM, n = 5. *P < 0.05. Unpaired two‐sided t‐test.
-
ERepresentative histochemical staining of α‐GPDH enzymatic activity in TA and Sol muscles from three and 10 weeks mice. Scale bar represents 200 μm.
-
F–HRelative expressions of PPARβ (F), PFK1 (G), and Myh7 (H) in TA muscles from Pax7‐nGFP;MCK‐PPARβ‐TG (TG) and Pax7‐nGFP WT mice, as determined by qRT‐PCR. Means ± SEM, n = 5. *P < 0.05. ***P < 0.001. Unpaired two‐sided t‐test.
-
IRelative expression of molecular markers for stemness and differentiation in FACS‐resolved Pax7 SCs from the TA muscle of Pax7‐nGFP;MCK‐PPARβ transgenic (TG) and Pax7‐nGFP wild‐type (WT) littermates, as determined by qRT‐PCR. Means ± SEM, n = 5. *P < 0.05. **P < 0.01. Unpaired two‐sided t‐test.
-
JRepresentative images of MyoD immunostaining (red) for FACS‐resolved Pax7 SCs cultured in growth medium (GM) for 18 h. DAPI was used to visualize nuclei (blue). Scale bar represents 20 μm.
-
KThe percentages of MyoD‐positive cells in (J) were calculated from three independent experiments. Means ± SEM. *P < 0.05. Unpaired two‐sided t‐test.
To further confirm the causal effects of fiber metabolism on Pax7 SC heterogeneity in mice, we examined the distribution of the Pax7Hi SC subpopulation in the TA muscle of the well‐characterized PPARβ transgenic (TG) mice, which exhibits significantly enriched oxidative muscle fibers and dramatically decreased glycolytic muscle fibers (Fig EV2F–H) (Gan et al, 2013). Consistent with the remarkably reduced glycolytic metabolism seen in PPARβ TG mice, the percentage of Pax7Hi SCs was significantly reduced in the TA muscle fibers of PPARβ TG mice compared to those of wild‐type (WT) littermates (Fig 3I–K). In agreement with this finding, the mRNA levels of Pax7, CXCR4, and CD34 were also lower, but the levels of MyoD and MyoG were higher in Pax7 SCs freshly isolated from the TA muscle of PPARβ TG mice compared to those of WT mice (Fig EV2I). Moreover, the activation of Pax7 SCs isolated from the TA muscle fibers of both WT and PPARβ TG mice was comparatively analyzed by immunostaining the Pax7 SCs cultured for 18 h in growth medium with MyoD antibody. Activation of Pax7 SCs isolated from the TA muscle fibers of PPARβ TG mice was significantly faster than that observed in WT littermates (Fig EV2J and K). Together, these results support the notion that glycolytic metabolism favors the establishment and maintenance of Pax7Hi cells in mice.
Muscle‐released G‐CSF is a metabolic niche factor required for establishment and maintenance of Pax7Hi SCs in mice
Based on the above observations, we hypothesized that cytokines highly expressed and secreted by glycolytic muscle fibers might function as niche factors required to maintain Pax7Hi SC subpopulation in aged mice. To identify the muscle‐secreted factors responsible for the loss of Pax7 SCs during aging, we analyzed the global gene expression changes occurring within TA muscle during physiological aging. We found that Csf3 gene encoding granulocyte colony‐stimulating factor (G‐CSF) was particularly interesting because it was significantly downregulated in aged TA muscle than young TA muscle (Fig 4A). Also, Csf3 was more highly expressed by glycolytic TA muscle versus oxidative Sol muscle in adult mice (Fig 4B) and was remarkably reduced in the TA muscle of PPARβ TG versus WT adult mice (Fig 4C), suggesting Csf3 gene is predominantly expressed in glycolytic muscle fibers. To further corroborate this, we isolated single myofibers from Sol and glycolytic EDL muscle and directly examined Csf3 gene expression in single myofibers by qRT‐PCR (Fig 4D). The identity of each myofibers was verified by measuring Myh1 and Myh7 gene expression, respectively (Fig EV3A and B). Indeed, Csf3 was highly expressed in glycolytic single myofibers isolated from EDL (Fig 4D). Together, we reasoned that G‐CSF might be a Pax7 SCs niche factor required for the established enrichment of Pax7Hi SCs in glycolytic TA muscle in adult mice.
Figure 4. Muscle‐released G‐CSF is a Pax7 SC niche factor required for Pax7Hi SCs.

- Relative expression of Csf3 gene in TA muscles from young (3‐month‐old) and aged (18‐month‐old) C57BL/6 mice, as determined by qRT‐PCR. Means ± SEM, n = 5. *P < 0.05. Unpaired two‐sided t‐test.
- Relative expression of Csf3 gene in myofibers isolated from TA and Sol muscles was determined by qRT‐PCR. Means ± SEM, n = 5. **P < 0.01. Unpaired two‐sided t‐test.
- Relative expression of Csf3 gene in TA muscles from Pax7‐nGFP;MCK‐PPARβ‐TG and Pax7‐nGFP WT mice, as determined by qRT‐PCR. Means ± SEM, n = 5. **P < 0.01. Unpaired two‐sided t‐test.
- Relative expression of Csf3 gene in isolated single fiber from Sol muscle and EDL muscle was determined by qRT‐PCR; each dot represents one single myofiber. Means ± SEM, n = 25 in Sol group, n = 23 in TA group. *P < 0.05. Unpaired two‐sided t‐test.
- Representative FACS profile of Pax7 SCs treated with G‐CSF in GM for 48 h. Pax7 SCs were sorted from Pax7‐nGFP WT and Pax7‐nGFP;Csf3r −/−, respectively. PBS served as a negative control (NC).
- Average percentages of Pax7Hi SC subpopulations obtained from three independent FACS experiments, performed as described in panel (E). Means ± SEM. *P < 0.05. 2‐way ANOVA.
- Representative FACS profiles of Pax7 SCs from the TA muscles of 10‐week‐old Pax7‐nGFP;Csf3r −/− or Pax7‐nGFP WT mice.
- The percentages of Pax7Hi SCs in (G) were calculated. Means ± SEM, n = 3 for each genotype. *P < 0.05. Unpaired two‐sided t‐test.
Figure EV3. Muscle‐released G‐CSF is a Pax7 SC niche factor required for Pax7Hi SCs.

- Relative expression of Myh7 gene in isolated single fiber from Sol and EDL muscles was determined by qRT‐PCR; each dot represented one single myofiber. Means ± SEM, n = 25 in Sol group, n = 24 in EDL group. *P < 0.05. Unpaired two‐sided t‐test.
- Relative expression of Myh1 gene in isolated single fiber from Sol and EDL muscles was determined by qRT‐PCR; each dot represented one single myofiber. Means ± SEM, n = 25 in Sol group, n = 24 in EDL group. *P < 0.05. Unpaired two‐sided t‐test.
- Relative expression of Pax7 in sorted Pax7 SCs treated with G‐CSF in growth medium (GM) for 48 h, as determined by qRT‐PCR. Data were obtained from three independent experiments. Means ± SEM. *P < 0.05. Unpaired two‐sided t‐test.
- Relative expression of Csf3 gene in TA muscle from Pax7‐nGFP;Csf3r −/− mice and Pax7‐nGFP WT littermates, as determined by qRT‐PCR. Means ± SEM, n = 5.
- Relative expression of genes related to fiber type (Myh 4) and muscle metabolism (HK2 and PFK1) in TA muscles from Pax7‐nGFP;Csf3r −/− mice and Pax7‐nGFP WT littermates, as determined by qRT‐PCR. Means ± SEM, n = 4.
- Representative FACS profiles of neutrophils and macrophages. Gating for CD11b+/Ly‐6G+ (neutrophils) and CD11b+/Ly‐6G− (macrophages) is indicated. FITC, GFP (488 channel); PEcy7, phycoerythrin (594 channel).
- Relative expression of Csf3 gene in the neutrophils and macrophages sorted from TA muscle of Pax7‐nGFP;Csf3r −/− mice and Pax7‐nGFP WT littermates, as determined by qRT‐PCR. Means ± SEM, n = 4.
To test this possibility, we freshly isolated Pax7 SCs from total muscle tissues of Pax7‐nGFP mice and treated the cells with either G‐CSF or PBS (control) for 48 h. G‐CSF treatment significantly increased the percentage of Pax7Hi SCs compared to the PBS control (Fig 4E and F), indicating that G‐CSF plays a functional role in modulating Pax7Hi SCs in vitro. This was further supported by significant upregulation of Pax7 in SCs treated with G‐CSF for 48 h (Fig EV3C). To further confirm that G‐CSF is a niche factor required for Pax7Hi SCs establishment, we generated Pax7‐nGFP;Csf3r −/− mice by crossing Csf3r −/− mice (G‐CSF receptor KO mice) with Pax7‐nGFP reporter mice. When Pax7 SCs isolated from the Pax7‐nGFP;Csf3r −/− mice were treated with either G‐CSF or PBS for 48 h, G‐CSF failed to increase the percentage of Pax7Hi SCs from Pax7‐nGFP;Csf3r −/− mice (Fig 4E and F). Consistent with these in vitro findings, when we compared the distribution of Pax7Hi SCs in glycolytic TA of WT mice and Pax7‐nGFP;Csf3r −/− mice, the percentage of Pax7Hi SCs was significantly reduced in those of Pax7‐nGFP;Csf3r −/− mice (Fig 4G and H). We next examined the mRNA levels of Csf3 and marker genes for the muscle fiber type (Myh4) and muscle fiber metabolism (HK2 and PFK1) in the TA muscles of Pax7‐nGFP;Csf3r −/− and Pax7‐nGFP WT mice. Our results ruled out the possibility that the observed effects in the Pax7‐nGFP;Csf3r −/− mice were due to a reduction in Csf3 expression or an alteration of muscle fiber metabolism (Fig EV3D and E). Moreover, we did not find any difference in the Csf3 mRNA levels of immune cells sorted from the TA or Sol muscle fibers of Pax7‐nGFP;Csf3r −/− mice (Fig EV3F and G). Collectively, these findings demonstrate that muscle‐released G‐CSF and its receptor on Pax7 SCs are required to establish the Pax7Hi SC subpopulation in mice.
Expression of Csf3 gene encoding G‐CSF is metabolically regulated by MyoD in muscle cells
We then asked whether G‐CSF is indeed a metabolic niche factor secreted by muscle fibers, and then, the Csf3 gene encoding G‐CSF should be metabolically regulated in muscle cells. To test this, we examined Csf3 gene expression in C2C12 myotubes with enhanced glycolytic activity by culturing them in pyruvate‐free medium (Fig EV4A and B; Chen et al, 2016). The expression of Csf3 gene was significantly increased in myotubes that exhibited higher glycolytic activity (Fig 5A), indicating that the transcription of Csf3 gene was indeed regulated by the enhancement of glycolytic metabolism in myotubes. To determine how expression of Csf3 gene is metabolically controlled by glycolytic activity of myofiber, we analyzed the 2‐kb upstream of the transcriptional start site of the Csf3 promoter and six E‐boxes were found in this region (Fig EV4C), suggesting that metabolically mediated expression of Csf3 gene might be regulated by myogenic regulatory factors such as MyoD in myotubes. Therefore, we examined MyoD expression in myotubes cultured with pyruvate‐free medium and found that enhanced glycolytic activity in the myotubes cultured with pyruvate‐free medium also significantly elevated MyoD expression (Fig 5A). In addition, we also observed that similar to Csf3, MyoD was also more prominently expressed in glycolytic TA muscle fibers compared to oxidative Sol muscle fibers in mice (Fig EV4D and E). MyoD and Csf3 had a similar expression pattern, highly expressed in the glycolytic single fibers isolated from EDL than in the oxidative single fibers from Sol muscles (Fig EV4F). To directly determine whether MyoD metabolically regulates Csf3 expression in vivo, expression of Csf3 was assessed in TA muscles of MyoD‐knockout (MyoD‐KO) mice and WT mice. Consistently, levels of Csf3 mRNA were significantly reduced in the glycolytic TA muscles of MyoD‐KO mice compared to WT mice (Fig 5B), indicating that MyoD was a transcriptional factor for regulating Csf3 expression in muscle cells. To further confirm this possibility, we overexpressed MyoD in C2C12 muscle cells and found that MyoD overexpression remarkably augmented Csf3 transcription (Fig EV4G). MyoD‐mediated transcription of Csf3 gene was further corroborated by using a luciferase reporter system driven by the E‐box‐containing 2‐kb region upstream of the Csf3 promoter. Luciferase reporter activity was assayed in both C3H‐10T1/2 fibroblasts and C2C12 cells transiently transfected with MyoD in the presence of the reporter construct. Forced expression of MyoD in either fibroblasts or C2C12 cells significantly activated the luciferase reporter gene driven by the 2‐kb Csf3 promoter, compared with the negative control (Figs 5C and EV4H). In addition, we examined luciferase reporter gene activity in the TA muscles of MyoD‐KO and WT mice. Consistent with the results of our in vitro assays, the TA muscles of MyoD‐KO mice showed significantly less luciferase activity than those of WT mice (Fig 5D). Together, our in vitro and in vivo analyses reveal that MyoD regulates the Csf3 gene transcription in muscle cells.
Figure EV4. MyoD metabolically regulates Csf3 gene expression in skeletal muscle cells.

-
ANAD+ levels in C2C12 myotubes cultured in medium with or without pyruvate for 24 h. Data were obtained from three independent experiments. Means ± SEM. *P < 0.05. Unpaired two‐sided t‐test.
-
BRelative expression of PDK4 and HK2 genes in the C2C12 myotubes cultured in medium with or without pyruvate for 24 h. Data were obtained from three independent experiments. Means ± SEM. *P < 0.05. Unpaired two‐sided t‐test.
-
CE‐boxes (CANNTG) within the 2‐kb sequence upstream of the mouse Csf3 gene.
-
DProtein levels of MyoD in TA and Sol muscles, as determined by Western blotting. β‐Tubulin served as a loading control.
-
EmRNA levels of MyoD in TA and Sol muscles, as determined by qRT‐PCR. β‐Actin served as an internal control. Means ± SEM, n = 4. *P < 0.05. Unpaired two‐sided t‐test.
-
FRelative expression of MyoD gene in isolated single fiber from Sol and EDL muscles was determined by qRT‐PCR. Each dot represented one single myofiber. Means ± SEM, n = 25 in Sol group, n = 24 in EDL group. *P < 0.05. Unpaired two‐sided t‐test.
-
GRelative expression of Csf3 in C2C12 myotubes overexpressing MyoD. Empty vector served as negative control (NC). Data were obtained from three independent experiments. Means ± SEM. **P < 0.05. Unpaired two‐sided t‐test.
-
HRelative promoter activities of the 2‐kb sequence upstream of Csf3 in fibroblasts with transient ectopic expression of MyoD. Transfection with empty vector served as a negative control (NC). Data were obtained from three independent experiments. Means ± SEM. *P < 0.05. Unpaired two‐sided t‐test.
-
IRelative expression of Csf3 in MyoD‐knockdown C2C12 myotubes cultured in medium with or without pyruvate. Data were obtained from three independent experiments. Means ± SEM. *P < 0.05. 2‐way ANOVA.
-
JMyoD protein levels in the MyoD‐knockdown C2C12 myotubes. β‐Actin served as a loading control.
-
KRelative expressions of MyoG in C2C12 myotubes cultured in medium with or without pyruvate for 24 h. Data were obtained from three independent experiments. Means ± SEM.
-
LRelative promoter activities of MyoG in C2C12 myotubes cultured in basal or pyruvate‐free medium for 24 h. Data were obtained from three independent experiments. Means ± SEM.
-
M, NChIP‐qPCR was performed using chromatin from myotube cultured in presence or absence of pyruvate. Chromatin was immunoprecipitated using antibodies against MyoD. The immunoprecipitated DNA was amplified using primers for MyoG (M) and GAPDH (N) genes promoter. Data were obtained from three independent experiments. Means ± SEM.
Source data are available online for this figure.
Figure 5. Expression of Csf3 gene is metabolically regulated by MyoD in muscle cells.

- Relative expression of Csf3 and MyoD genes in C2C12 myotubes cultured in medium with or without pyruvate, as determined by qRT‐PCR. Data were obtained from three independent experiments. Means ± SEM. *P < 0.05. Unpaired two‐sided t‐test.
- Relative expression of Csf3 gene in TA muscles from MyoD −/− mice and WT littermates was determined by qRT‐PCR. Means ± SEM, n = 5 for each genotype. *P < 0.05. Unpaired two‐sided t‐test.
- Relative Csf3 promoter activities in C2C12 myotubes overexpressing MyoD were measured by dual‐luciferase assay. Empty vector served as a negative control (NC). Data were obtained from three independent experiments. Means ± SEM. **P < 0.01. 2‐way ANOVA.
- Relative Csf3 promoter activities in the TA muscles of MyoD −/− and WT littermates were measured by dual‐luciferase assay. Means ± SEM, n = 3 for each genotype. *P < 0.05, **P < 0.01. 1‐way ANOVA.
- Relative Csf3 promoter activities in MyoD‐knockdown C2C12 myotubes cultured in medium with or without pyruvate. Data were obtained from three independent experiments. Means ± SEM. *P < 0.05, **P < 0.01. 2‐way ANOVA.
- Relative activities of truncated Csf3 promoters in C2C12 myotubes cultured in medium with or without pyruvate. Data were obtained from three independent experiments. Means ± SEM. *P < 0.05. Unpaired two‐sided t‐test.
- ChIP assays were performed using chromatin from myotube cultured in medium with or without pyruvate. Chromatin was immunoprecipitated using antibodies against MyoD. The immunoprecipitated DNA was amplified using primers for Csf3 gene promoter covering each indicated E‐box, respectively. Data were obtained from three independent experiments. Means ± SEM. *P < 0.05. Unpaired two‐sided t‐test.
Next, we examined whether the glycolytically mediated transcription of the Csf3 gene is regulated by MyoD in muscle cells. First, we checked Csf3 expression in both MyoD‐KD and control C2C12 myotubes with enhanced glycolytic activity. The metabolic reprogramming‐induced upregulation of Csf3 expression seen in control myotubes was completely abolished in the MyoD‐KD myotubes (Fig EV4I and J), indicating that MyoD is required for the metabolically induced expression of Csf3 gene in myotubes. To further confirm this observation, we assessed luciferase reporter gene activity driven by the Csf3 promoter in MyoD‐KD and control C2C12 myotubes cultured in the presence or absence of pyruvate. Indeed, significantly increased reporter gene activity was found to be induced by glycolytic metabolism only in control myotubes, but not in MyoD‐KD myotubes (Fig 5E). Interestingly, enhanced glycolytic activity did not alter the expression of the endogenous MyoG gene (Fig EV4K) or the activity of a luciferase reporter gene driven by the MyoG proximal promoter (Fig EV4L), revealing that metabolically mediated Csf3 transcription is specifically regulated by MyoD in the muscle cells. Finally, functional analysis of Csf3 gene promoter for identifying the E‐boxes in its promoter required for MyoD‐controlled metabolic transcription was performed by reporter gene assays with various truncated mutants of the Csf3 gene promoter. Reporter assay showed that truncations of Csf3 promoter containing the E‐box (−1,519, −1,791, −1,853 bp) were response to glycolytic metabolism, suggesting that the E‐boxes (−1,519, −1,791, −1,853 bp) were required for MyoD‐mediated Csf3 transcription (Figs 5F and EV4C). To further corroborate the observation, we performed MyoD ChIP‐PCR on differentiated myotubes cultured in the presence or absence of pyruvate. Significantly, we found that enhanced glycolytic metabolism enriched MyoD binding on Csf3 promoter but not on MyoG promoter (Figs 5G and EV4M and N). Taken together, our results not only provide molecular evidence to confirm that G‐CSF is a muscle fiber‐secreted niche factor but also most interestingly uncover an unexpected metabolic role for MyoD as a transcriptional factor in regulating Csf3 gene expression in mature muscle.
Muscle‐derived G‐CSF promotes the asymmetric division of Pax7 SCs
Next, we explored the molecular mechanism through which muscle‐derived and MyoD‐regulated G‐CSF acts as a Pax7 SC niche factor to modulate the heterogeneity of Pax7 SCs. We first assessed the expression of Pax7 in SCs following G‐CSF treatment. Interestingly, at 24 h post‐treatment, there was no obvious change in Pax7 mRNA levels in Pax7 SCs sorted from Pax7‐nGFP mice (Appendix Fig S2A), but these levels were significantly enhanced at 48 h post‐treatment (Fig EV3C). These results suggested that the G‐CSF‐mediated enrichment of the Pax7Hi SC subpopulation most likely occurs through cell division of Pax7SCs rather than through an increase of Pax7 expression in these cells.
As the self‐renewal of the SCs was proposed to be regulated by asymmetric division (Kuang et al, 2007; Troy et al, 2012) and G‐CSF receptor was recently reported to be asymmetrically distributed in about 20% activated Pax7 SCs (Hayashiji et al, 2015), we hypothesized that G‐CSF might mediate the heterogeneity of Pax7 SCs by promoting their asymmetric division via its interaction with the asymmetrically distributed G‐CSFR on the Pax7 SCs. To test this possibility, we first performed time‐lapse imaging of cell division in cultured Pax7 SCs sorted from Pax7‐nGFP mice (Fig 6A–C and Movie EV1) and in single fibers isolated from the extensor digitorum longus (EDL) muscles of Pax7‐nGFP mice (Appendix Fig S2B–D and Movie EV2). As expected, SCs underwent asymmetric division, each giving rise to one Pax7Hi cell and one Pax7Lo cell (Fig 6A–C and Appendix Fig S2B–D). Next, we used several approaches to experimentally test our notion that G‐CSF regulated the percentage of the Pax7Hi SC subpopulation by promoting their asymmetric division. Firstly, we assayed co‐segregation of template DNA strands in the Pax7 cells. The TA muscles of 10‐week‐old Pax7‐nGFP mice were injured by intramuscular injection of CTX. EdU labeling was used to monitor the co‐segregation of template DNA (72 h post‐injury), and BrdU was added to ensure that cells continued to divide during this period (8 h post‐EdU) (Fig 6D). We ensured that all of the cells were EdU‐positive cells by performing immunostaining of EdU at T1 (Appendix Fig S2E). To determine whether Pax7 cell displayed asymmetric division in response to G‐CSF, we sorted Pax7 SCs and treated them with G‐CSF in growth medium for 12 h to complete cell division. In this paradigm, template DNA‐retaining and DNA‐excluding cells would be EdU‐positive or EdU‐negative, respectively (Fig 6E). We found that 12.5% of cells generated from Pax7 SCs were EdU‐negative, suggesting that a subpopulation of Pax7SCs underwent co‐segregation of template DNA (Fig 6F). Notably, the EdU‐negative daughter cells were primarily Pax7Lo SCs (Fig 6E). Significantly, G‐CSF treatment increased the percentage of template DNA co‐segregation in Pax7 SCs (Fig 6F), suggesting that G‐CSF maintained Pax7Hi SCs by promoting the asymmetric divisions.
Figure 6. Muscle‐derived G‐CSF mediates the maintenance of the Pax7Hi SC subpopulation by promoting the asymmetric division of Pax7 SCs.

-
A–CTime‐lapse imaging was used to trace the division of Pax7 SCs sorted from Pax7‐nGFP mice. Images in (A‐C) were filmed in GFP channels and (A’‐C’) were filmed in bright channels, n = 4. Scale bar represents 20 μm.
-
DThe timing of EdU and BrdU injections (8 h apart) used to define TDSS.
-
ERepresentative views showing the co‐segregation of template DNA strands during the cell division of FACS‐resolved Pax7 SCs from Pax7‐nGFP mice pulse‐labeled with EdU and BrdU, as characterized by EdU and BrdU staining. When old template DNA strands co‐segregate, one daughter cell (EdU+/BrdU+) is a Pax7Hi SC and the other (EdU−/BrdU+) is a Pax7Lo SC. DAPI (blue) was used to visualize nuclei. Scale bar represents 5 μm.
-
FThe percentages of EdU+/BrdU+ and EdU−/BrdU+ daughter cells observed during the cell divisions of Pax7 SCs treated with G‐CSF for 24 h. PBS treatment served as a negative control (NC). The Pax7 SCs were FACS‐resolved from Pax7‐nGFP mice pulse‐labeled with EdU and BrdU. Data were obtained from three independent experiments. Means ± SEM. *P < 0.05. Unpaired two‐sided t‐test.
-
GRepresentative views showing the separation of G‐CSFR signals (green) during the cell division of Pax7 SCs on ex vivo‐cultured single muscle fibers. DAPI (blue) indicates nuclei. Scale bar represents 10 μm.
-
HThe percentages of Pax7 SCs that show asymmetric separation of G‐CSFR during cell division on ex vivo‐cultured single fibers treated with G‐CSF were calculated from three independent experiments. Means ± SEM. PBS served as a negative control (NC). *P < 0.05. Unpaired two‐sided t‐test.
-
IRepresentative views of the asymmetric division of G‐CSFR (yellow) and co‐segregation of template DNA strands (EdU‐) during the cell division of FACS‐resolved Pax7 SCs from Pax7‐nGFP mice that had been pulse‐labeled with EdU and cultured in GM for 24 h. DAPI (blue) indicates nuclei. Scale bar represents 10 μm.
-
JCorrelation between the asymmetric division of G‐CSFR in daughter cells and the co‐segregation of EdU‐labeled template DNA during cell division. EdU+/− G‐CSFR−/+ represents a doublet in which one daughter is G‐CSFR‐negative and EdU‐positive (Pax7Hi) while the other is G‐CSFR‐positive and EdU‐negative (Pax7Lo). Data were obtained from three independent experiments. Means ± SEM.
As G‐CSFR was recently reported to be asymmetrically distributed in about 20% of activated Pax7 SCs (Hayashiji et al, 2015), we reasoned that the asymmetric distribution of G‐CSFR response to G‐CSF mediated asymmetric division. Firstly, single fibers isolated from the EDL and Soleus muscles of Pax7‐nGFP mice were treated with G‐CSF for 48 h and immunostained with anti‐G‐CSFR (Fig 6G). Notably, G‐CSF treatment significantly increased the percentage of asymmetrically dividing Pax7 SCs in single fibers isolated from EDL muscle, as characterized by the asymmetric distributions of G‐CSFR (Fig 6H). However, there is no obvious effect on the Pax7 SCs from Sol muscle fibers (Appendix Fig S2F). The data not only suggest that Pax7 SCs from different muscles respond differently to signals depending on their origin but also indicate intimate role of myofibers in regulating Pax7 SCs cellular behaviors during development. To further substantiate this observation, we calculated the percentage of EdU+/− doublets with asymmetric distribution of G‐CSFR. Indeed, the EdU+/− doublets exhibited a lower percentage of G‐CSFR+/+ cells with symmetrically distributed G‐CSFR, and a significantly higher percentage of G‐CSFR−/+ cells with asymmetric distribution of G‐CSFR (Fig 6I and J). The frequency of asymmetric G‐CSFR distribution was consistent with the co‐segregation of template DNA. Together, these results demonstrate that G‐CSF promotes the asymmetric division of Pax7 SCs.
The G‐CSF replenishes Pax7Hi cells by stimulating asymmetric division of Pax7Mi cells
Since reduced Pax7Hi cells in aged mice are correlated with fiber metabolism shift from glycolytic to oxidative, we then test whether enhanced glycolytic fiber metabolism could rejuvenate Pax7Hi cells in aged mice. As endurance exercise can significantly increase the glycolytic activity of muscle fibers (Heath et al, 1983), we examined percentage of Pax7Hi SCs in TA muscles of aged mice in which glycolytic muscle metabolism was enhanced by endurance exercise. As expected, exercise significantly augmented the glycolytic activity in the TA muscles of aged mice compared to those of sedentary aged mice (Fig EV5A). Notably, FACS analysis revealed that the percentage of Pax7Hi SC subpopulation was dramatically increased in the TA muscles of exercised aged mice compared to sedentary aged mice (Fig 7A and B). Most significantly, we found that the percentage of Pax7Hi SCs in the TA muscles of exercised aged mice was replenished almost to the level seen in untrained young mice (Fig 7A and B). These results indicate that enhanced glycolytic metabolism of myofiber rejuvenates Pax7Hi cells in aged mice.
Figure EV5. G‐CSF replenished Pax7Hi cells by promoting asymmetric division of Pax7Mi cells.

- Relative expression of Myh7, Myh4, HK2, and PFK1 in TA muscles from young (Young), aged exercised (Aged‐Ex), and aged sedentary (Aged‐Sed) Pax7‐nGFP mice. Means ± SEM, n = 5. *P < 0.05. 1‐way ANOVA.
- Relative expression of Csf3 in TA muscles from young (Young), aged exercised (Aged‐Ex), and aged sedentary (Aged‐Sed) Pax7‐nGFP mice. Means ± SEM, n = 5. *P < 0.05. 1‐way ANOVA.
- Relative expression of Csf3 gene in the TA muscles of Pax7‐nGFP;Csf3r −/− or Pax7‐nGFP WT mice subjected to exercise (Ex), as determined by qRT‐PCR. Means ± SEM, n = 4. *P < 0.05. Unpaired two‐sided t‐test.
- Representative genes in Pax7Hi, Pax7Mi, and Pax7Lo cells were visualized by Ridge plots.
- Flow cytometric analysis of the three subpopulations of Pax7 SCs treated with G‐CSF for 24 h and subjected to EdU and BrdU immunostaining. Numbers in corners represented percentages (%) of the cells. The three subpopulations of Pax7 SCs were sorted from Pax7‐nGFP mice and pulse‐labeled with EdU and BrdU.
- Protein levels of Stat3 and p‐Stat3 in Pax7 SCs treated with G‐CSF in the presence or absence of the Stat3 inhibitor, 5,15 DPP, as determined by Western blotting. GAPDH and histone H3 served as loading controls for the cytoplasmic and nuclear fractions, respectively.
- Relative expression of BCL2, BCL6, Pim1, Socs3, and Myc in Pax7 SCs treated with G‐CSF in the presence or absence of 5,15 DPP, as determined by qRT‐PCR. Values are presented as the mean ± SEM. Data from three independent experiments. *P < 0.05. 2‐way ANOVA.
Source data are available online for this figure.
Figure 7. G‐CSF replenishes Pax7Hi cells by stimulating asymmetric division of Pax7Mi cells.

-
ARepresentative FACS profile of Pax7 SCs sorted from the TA muscles of young, aged exercised (Aged‐Ex), and aged sedentary (Aged‐Sed) of Pax7‐nGFP mice.
-
BThe percentages of Pax7Hi SCs in (A) were calculated. Means ± SEM, n = 5 for each group. *P < 0.05. 1‐way ANOVA.
-
C, DRepresentative FACS profiles of Pax7 SCs from the TA muscles of Pax7‐nGFP;Csf3r −/− or Pax7‐nGFP WT mice subjected to exercise (Ex). Sedentary (Sed) mice served as a control. n = 5.
-
EThe percentages of Pax7Hi SCs in (C and D) were calculated. Means ± SEM, n = 3. *P < 0.05. Unpaired two‐sided t‐test.
-
FUnsupervised clustering of Pax7Hi, Pax7Mi, and Pax7Lo cells visualized with t‐SNE. Each point was a single cell colored by cluster assignment.
-
GHeatmaps of normalized signal show Pax7Hi, Pax7Mi, Pax7Lo by top genes (columns) for individual cells (rows).
-
HRepresentative views of the asymmetric and symmetric distributions of G‐CSFR (red) in FACS‐resolved Pax7 SCs obtained from Pax7‐nGFP mice and cultured in GM for 24 h. DAPI (blue) indicates nuclei. Scale bar represents 2.5 μm.
-
IThe percentages of Pax7 SCs with asymmetric distribution of G‐CSFR among FACS‐resolved Pax7Hi, Pax7Mi, and Pax7Lo SCs cultured in GM for 24 h. Data were obtained from three independent experiments. Means ± SEM.
-
JThe percentages of EdU+/BrdU+ and EdU−/BrdU+ daughter cells observed during the cell divisions of Pax7Hi, Pax7Mi, and Pax7Lo SCs treated with G‐CSF for 24 h. PBS served as a negative control (NC). The three subpopulations of Pax7 SCs were FACS‐resolved from Pax7‐nGFP mice pulse‐labeled with EdU and BrdU. Data were obtained from three independent experiments. Means ± SEM. *P < 0.05. Unpaired two‐sided t‐test.
-
KThe percentages of Pax7Hi SCs after the three subpopulations of Pax7 SCs were treated with G‐CSF for 24 h in the presence or absence of a Stat3 inhibitor, as calculated from three independent experiments. Means ± SEM. *P < 0.05. 2‐way ANOVA.
Given that exercise replenished Pax7Hi cells through enhanced glycolytic metabolism of myofiber in aged mice (Fig 7A and B) and more interestingly, we also found that expression of Csf3 was significantly reduced in TA muscles of aged mice and exercise significantly restored Csf3 expression in the same fibers of aged mice (Fig EV5B). Based on those observations, it is conceivable that exercise‐induced G‐CSF might functionally restore Pax7Hi cells in TA muscles of aged mice. To test this, we subjected Pax7‐nGFP;Csf3r −/− and Pax7‐nGFP WT mice to endurance exercise. Indeed, exercise significantly augmented the Csf3 RNA levels of TA muscles from both exercised Pax7‐nGFP WT and Pax7‐nGFP;Csf3r −/− mice compared to those of sedentary Pax7‐nGFP WT and Pax7‐nGFP;Csf3r −/− mice (Fig EV5C). However, the percentage of Pax7Hi SCs was only increased in the TA muscles of exercised Pax7‐nGFP WT mice, but not in those of exercised Pax7‐nGFP;Csf3r −/− mice (Fig 7C–E). Collectively, our results reveal that muscle‐derived G‐CSF acts as a metabolic niche factor required for maintaining the Pax7Hi SC subpopulation in physiologically aged mice. These results indicate that enhanced glycolytic metabolism of myofiber rejuvenates Pax7Hi cells in aged SCs by regulating Csf3 expression.
Next, we asked from which subpopulations Pax7 SCs (Pax7Lo, Pax7Mi, and Pax7Hi) contribute to the replenishment of Pax7Hi SCs in aged mice after exercise. For this purpose, we further sorted Pax7Mi from Pax7‐nGFP mice and performed single‐cell RNA‐seq. We profiled 5212 Pax7Mi cells and the detectable genes ranged approximately from 1,000 to 2,000 in individual cells. Then, we combined the data of Pax7Hi and Pax7Lo (Fig 1A) with the data of Pax7Mi and visualized the cells in two dimensions according to their expression profiles by t‐SNE projections. Our result showed that Pax7Mi cells are more closed to Pax7Hi cells (Fig 7F). Heatmaps of SC profiles revealed normalized expression of the top variable genes in each subtype, and the expression pattern of Pax7Mi cells was similar with Pax7Hi cells (Fig 7G). Also, the markers of Pax7Hi cells in Pax7Mi cells were higher than Pax7Lo cells (Fig EV5D). Hence, we reasoned that both Pax7Hi and Pax7Mi cells response to G‐CSF to undergo asymmetric division. Consistently, we found that Pax7Mi SCs had more cells with asymmetric distribution of G‐CSFR, followed by the Pax7Hi subpopulation, and then the Pax7Lo cell subpopulation, which had a very low percentage (Fig 7H and I). To further determine which cell subpopulation(s) displayed asymmetric division in response to G‐CSF, we used FACS to sort Pax7Hi, Pax7Mi, and Pax7Lo SCs and treated them with G‐CSF, respectively. We found that 36% of cells generated from Pax7Hi SCs and 10% of those generated from Pax7Mi SCs were EdU‐negative, suggesting that most Pax7Hi SCs and some Pax7Mi SCs underwent co‐segregation of template DNA (Fig 7J), indicating G‐CSF treatment increased the percentage of template DNA co‐segregation in both Pax7Hi and Pax7Mi SCs (Fig 7J). To further confirm these observations, we used flow cytometry to analyze template DNA co‐segregation. After the cells finished their first cell division in vitro, ~56% of the Pax7Hi daughter cells were EdU+/BrdU+ and ~44% were EdU−/BrdU+, whereas ~18% of the Pax7Mi generated cells were EdU−/BrdU+ (Fig EV5E). We also found that G‐CSF treatment increased the percentage of template DNA co‐segregation in both Pax7Hi and Pax7Mi SCs (Fig EV5E). As Pax7Hi SCs generate distinct daughter cell fates by asymmetrically segregating template DNA strands to the stem cell (Rocheteau et al, 2012), only the Pax7Hi cells themselves are not sufficient to enrich Pax7Hi cells. The remarkable number of Pax7Mi SCs with asymmetric distribution of G‐CSFR provides a molecular basis for the G‐CSF‐mediated enrichment of Pax7Hi SCs, which are generated through the asymmetric division of Pax7 SCs from the Pax7Mi SC subpopulation. Finally, we examined the signaling pathway(s) involved in the G‐CSF‐mediated enrichment and maintenance of Pax7Hi SCs. As G‐CSF is known to activate the Stat3 signaling pathway in Pax7 SCs (Hara et al, 2011), we tested whether G‐CSF regulated Pax7Hi subpopulation through this pathway.
As reported, G‐CSF activated Stat3 pathway and upregulated the downstream target genes in Pax7 SCs, but the Stat3 inhibitor significantly blocked effects of G‐CSF (Fig EV5F and G). FACS‐sorted Pax7Hi, Pax7Mi, and Pax7Lo SCs were further treated with G‐CSF in the presence or absence of the Stat3 inhibitor 5,15 DPP. G‐CSF enriched the Pax7Hi cell subpopulations in both Pax7Hi and Pax7Mi cell cultures, as indicated above, but treatment with the Stat3 inhibitor significantly abolished this enrichment (Fig 7K). These data indicate that G‐CSF enriches Pax7Hi cells through the G‐CSF‐G‐CSFR‐Stat3 axis. Collectively, our results offer multiple lines of experimental evidence showing that the G‐CSF/G‐CSFR/Stat3 axis is indispensably required to establish Pax7Hi SC subpopulation in mice, and that it acts by promoting the asymmetric division of Pax7SCs.
Discussion
Cell metabolism has been shown to intrinsically and cell autonomously regulate cellular functions in various types of cells, especially in cancer cells (Carey et al, 2015; Moussaieff et al, 2015; Ryall et al, 2015). However, it was not previously known whether tissue metabolism plays an extrinsic and non‐cell‐autonomous role in modulating cell functions in vivo. A recent in vitro study reported that stem cell functions are modulated by the metabolic interplay between supporting Paneth cells and intestinal Lgr5+ crypt base columnar cell (Lgr5+ CBCs) (Rodriguez‐Colman et al, 2017; Roper & Yilmaz, 2017). Here, we used various mouse genetic models to show for the first time that muscle fiber metabolism plays an in situ metabolic niche role in establishing and maintaining Pax7 SC heterogeneity in adult and physiologically aged mice. Thus, we reveal that the local metabolic activity of a tissue can provide in situ niche signaling to regulate stem cell functions in vivo. To our knowledge, our findings provide the first evidence that a tissue metabolism per se can act as a metabolic niche in regulating behaviors of stem cells during development and aging in a living organism.
Skeletal muscle is the most abundant endocrine organ and exerts its functional roles by secreting various factors (Pedersen & Febbraio, 2008, 2012). Muscle SCs are located between the sarcolemma and the basal lamina of the muscle fibers, which provide an immediate niche for the SCs by secreting different kinds of factors (Chakkalakal et al, 2012). However, only a few of the niche factors have been identified. For example, FGF2 was an aged muscle fiber‐released cytokine that acts locally as an extrinsic factor to regulate muscle stem cell quiescence in aged mice (Chakkalakal et al, 2012). Actually, the muscle SCs are directly associated with two types of metabolically different fibers: glycolytic fibers and oxidative fibers. This locally metabolic environment of muscle fibers with different metabolic activity has been considered as a metabolic stem cell niche; however, this metabolic niche hypothesis has not been investigated experimentally. Using this unique metabolic system, we herein report on identification and molecular characterization of the metabolic niche factor G‐CSF. We show that the G‐CSF is highly secreted from glycolytic muscle fibers and its expression is metabolically regulated by MyoD in muscle fibers. Functionally, the muscle fiber‐secreted G‐CSF is required for establishing and maintaining the Pax7Hi SC subpopulation in adult and physiological aged mice. Mechanistically, the muscle fiber‐released G‐CSF promotes the asymmetric division of Pax7Hi and Pax7Mi SCs by interacting with its receptor, G‐CSFR, on Pax7 SCs in mice. To our knowledge, this is the first identified metabolic niche factor which is functionally required for regulating stem cell heterogeneity. The significance of our findings in general is that we provide molecular mechanism to conceptually prove metabolic niche hypothesis.
An unexpected finding of this study is the transcriptional activity of MyoD in mature muscle in mice. MyoD has long been regarded only as a master transcription factor with critical roles in controlling myogenic lineage specification during embryonic skeletal muscle development and activation of Pax7 SCs in response to muscle injury in adult mice (Megeney et al, 1996; Cornelison et al, 2000). Herein, we intriguingly found that MyoD predominately expressed in glycolytic muscle and metabolically regulated transcription of muscle‐secreted G‐CSF gene Csf3 in mature muscle. Mechanistically, we show that enhanced glycolytic metabolism of myotube significantly enriched MyoD binding on Csf3 promoter but not on the promoter of myogenic differentiation gene MyoG. These results for the first time reveal that MyoD is a multifunctional transcription factor involved in regulating expression of either myogenic genes or metabolic‐regulated genes in mature muscle. A major question for future studies is how the specificity of MyoD transcriptional activity is achieved in different biological contexts. Better understanding of this question will be greatly facilitated by identification of MyoD‐interacting cofactors in various biological settings. Taken together, these findings provide a framework to investigate the unanticipated and novel role of MyoD and examine the broad function of this cell‐lineage‐specific transcription factor.
Heterogeneity is one hallmark of adult stem cells. However, it remains unclear how this heterogeneity is established and maintained during development and aging. In this report, using single‐cell RNA‐seq, we are the first to demonstrate that Pax7Hi and Pax7Lo muscle stem cells sorted based on the levels of Pax7 expression represent two distinct bona fide subpopulations in mice and Pax7Mi cells were more similar to Pax7Hi cells. Most strikingly, our approaches in this study allow us to reveal the dramatically decreased percentage of Pax7Hi SCs in the glycolytic muscle fibers of physiologically aged mice (from 10% in adult mice to 2.7% in aged mice). Aging causes a deterioration of muscle function and regeneration that most likely reflects a decline in stem cell number and function. Pax7Hi SCs are characterized as quiescent SCs with a high regenerative capacity, so the age‐related reduction of Pax7Hi SCs could account for the decline in muscle regeneration and repair in the aged mice. More remarkably, the reduction of the Pax7Hi SC subpopulation in the muscle fibers of aged mice can be rescued by the exercise‐induced upregulation of G‐CSF. A recent study showed that G‐CSFR is asymmetrically distributed in about 20% of activated Pax7 SCs (Hayashiji et al, 2015). Interestingly, we found that the percentage of Pax7 SCs with asymmetrically distributed G‐CSFR differed significantly among the three Pax7 SC subpopulations; it was highest in Pax7Mi, followed by Pax7Hi, and then Pax7Lo. In addition, we also found that Pax7Mi cells are very similar to Pax7Hi cells based on the gene expression signatures from single‐cell RNA sequencing. It therefore seems logical to propose a model in which Pax7Mi SCs might represent an intermediate population of transitionally amplified Pax7 SCs that function as a reserve of Pax7 SCs from which active SCs are replenished, protecting the muscle stem cells from becoming exhausted under homeostasis and particularly following injury or during aging. Taken together our findings not only decipher a molecular mechanism that contributes to maintaining quiescent Pax7Hi SCs in aged mice, but also suggest a subpopulation‐based targeting strategy for treating age‐related muscle loss (e.g., sarcopenia) or muscular dystrophy.
Materials and Methods
Mouse lines and animal care
Pax7‐nGFP Tg mice were kindly gifted by Dr. Shahragim Tajbakhsh (Institute Pasteur, France). The Pax7‐nGFP mice used throughout of this study were generated by crossing the C57BL/6J mice with the Pax7‐nGFP Tg mice (C57BL6:SJL/J). MCK‐PPARβ transgenic (TG) mice were kindly gifted by Dr. Zhenji Gan (Nanjing University, China). Csf3r −/− (#017838) and MyoD −/− (#002523) mice were obtained from the Jackson Laboratory. Mice were housed in an animal facility and given free access to water and standard rodent chow. All animal procedures were approved by the Animal Ethics Committee of Peking Union Medical College, Beijing (China).
Fluorescence‐activated cell sorting (FACS)
Pax7 SCs from the skeletal muscles of Pax7‐nGFP, Pax7‐nGFP;MCK‐PPARβ TG, and Pax7‐nGFP;Csf3r −/− mice were fluorescently sorted as previously described (Wu et al, 2015). Briefly, mononuclear muscle‐derived cells were isolated from the tibialis anterior (TA) and soleus (Sol) muscles of Pax7‐nGFP reporter mice (3 and 18 months) by digesting the muscle chops with 2.4 U/ml dispase (Gibco, 17105041) and 0.2% collagenase (Gibco, 17101015) for 45 min, filtered through 70‐μm and 40‐μm cell strainers, and directly sorted with a BD Aria II Cell Sorting System. Three subpopulations of Pax7 SCs were sorted from Pax7‐nGFP reporter mice by FACS based on intensity of GFP expression levels as previously described (Rocheteau et al, 2012). Briefly, Pax7Hi and Pax7Lo two subpopulations were sorted by FACS at opposite ends of the spectrum of GFP expression levels. They each corresponded to 10% of the total population and named as Pax7Hi and Pax7Lo, respectively. Rest of 80% of SC in the middle were isolated and designated as Pax7Mi.
To sort immune cells from TA and Sol muscles, single‐cell suspensions were prepared using dispase and collagenase, blocked with goat serum for 10 min, and co‐incubated with CD11b‐PECy7 (BD, 561098) and Ly‐6G‐FITC (BD, 561105) in DMEM supplemented with 2% FBS for 15 min at 4°C. The immunostained cells were briefly washed, passed through a 40‐μm nylon mesh (Falcon), suspended at 103–107 cells/ml, and further separated with the BD Aria II. The sorting gates were strictly defined on the basis of mono‐antibody‐stained control cells and the forward‐ and side‐scatter patterns obtained from the cells of interest in preliminary tests.
Single‐cell RNA‐seq using the 10× Genomics Chromium Platform
scRNA‐seq libraries were prepared with the Single Cell 30 Reagent Kit as instruction from User Guide v2 (10× Genomics). Cellular suspensions of Pax7Hi, Pax7Mi, and Pax7Lo were loaded on a Chromium Controller instrument (10× Genomics) to generate single‐cell gel bead‐in emulsions (GEMs), respectively. GEM‐reverse transcriptions (GEM‐RTs) were performed in a Veriti 96‐well thermal cycler (Thermo Fisher Scientific). After RT, GEMs were harvested and the cDNAs were amplified and cleaned up with the SPRIselect Reagent Kit (Beckman Coulter). Indexed sequencing libraries were constructed using the Chromium Single‐Cell 30 Library Kit (10× Genomics) for enzymatic fragmentation, end‐repair, A‐tailing, adaptor ligation, ligation cleanup, sample index PCR, and PCR cleanup. Sequencing libraries were loaded on a HiSeqX10 (Illumina). Reads were aligned to mm10 reference assembly. Primary assessment with this software for the Pax7Hi sample reported 1,469 cell‐barcodes with 4,466 median unique molecular identifiers (UMIs, transcripts) per cell and 1,496 median genes per cell sequenced to 96.7% sequencing saturation with 313,083 mean reads per cell. Primary assessment with this software for the Pax7Mi sample reported 5,859 cell‐barcodes with 3,465 median unique molecular identifiers (UMIs, transcripts) per cell and 1,260 median genes per cell sequenced to 94.9% sequencing saturation with 354,032 mean reads per cell. Primary assessment with this software for the Pax7Lo sample reported 2,982 cell‐barcodes with 4,317 median unique molecular identifiers (UMIs, transcripts) per cell and 1,478 median genes per cell sequenced to 97.1% sequencing saturation with 300,302 mean reads per cell.
Statistical method of Single‐cell RNA‐seq
We used Cell Ranger version 1.3.1 (10× Genomics) to process raw‐sequencing data and Seurat suite version 2.0.0 for downstream analysis. The Seurat R package were used for graph‐based clustering and visualizations, all functions mentioned were from this package or the standard R version 3.4.2 package unless otherwise noted and were used with the default parameters unless otherwise noted. Initially, we merged the three libraries by Seurat and we analyzed only cells (unique barcodes) that passed quality control processing (above) and expressed at least 500 genes and only genes that were expressed in at least 3 cells. We also removed cells with greater than 1% mitochondrial genes. We applied library‐size normalization to each cell with NormalizeData. Normalized expression for gene i in cell j was calculated by taking the natural log of the UMI counts for gene i in cell j divided by the total UMI counts in cell j multiplied by 10,000 and added to 1. To reduce the influence of variability in the number of UMIs, mitochondrial gene expression between cells on the clustering, we used the ScaleData function to linearly regress out these sources of variation before scaling and centering the data for dimensionality reduction. Principal component analysis was run using RunPCA on the variable genes calculated with FindVariableGenes (x = (0.1,6), y = (0.5, 15) and then extended to the full dataset with ProjectPCA. Based on the PCElbowPlot result, we decided to use 1 and 10 principal components (PCs) for the clustering of cells. We ran FindClusters to apply shared nearest‐neighbor (SNN) graph‐based clustering to each sample (0.6).
RNA‐seq
Total RNA was isolated from TA muscle of young (3‐month‐old) and aged (18‐month‐old) mice with Trizol reagent (Invitrogen). Sequencing libraries were generated using NEBNext super speed RNA Library Prep Kit for Illumina following the manufacturer's recommendations. Raw‐sequencing data were mapped to the mouse genome mm10 assembly using the HISAT with default parameters. DEGSeq45 was used to calculate the read coverage for each gene. Differentially expressed genes were filtered using a change greater than twofold and P‐value (0.05) as a criterion for differential expression. Differentially expressed genes were validated using the iQ5 Multicolor Real‐Time PCR Detection System (Bio‐Rad). The primer sequences were designed using DNAMAN. Pax7‐(s) CCGTGTTTCTCATGGTTGTG, (as) GAGCACTCGGCTAATCGAAC; MyoD‐(s) CAACGCCATCCGCTACAT, (as) GGTCTGGGTTCCCTGTTCT; MyoG‐(s)‐CCATTCACATAAGGCTAACAC, (as)‐CCCTTCCCTGCCTGTTCC; Csf3‐(s)‐AGTGCACTATGGTCAGGACGAG, (as) GGATCTTCCTCACTTGCTCCA; Nd1‐(s) CATACCCCCGATTCCGCTAC, (as) GTTTGAGGGGGAATGCTGGA; Co3‐(s) ACCAATGATGGCGCGATGTA, (as) GGCTGGAGTGGTAAAAGGCT; Co2‐(s) CCGTCTGAACTATCCTGCCC, (as) GAGGGATCGTTGACCTCGTC; Ptprb‐(s) GCTGCCACGGCCCTT; (as) CTCTGCCACTCCAGTCTGC; Pvalb‐(s) ACACTGCAGCGCTGGTCATA, (as) AGGAGTCTGCAGCAGCAAAGG; Rps28‐(s) GGTGACGTGCTCACCCTATT, (as) CCAGAACCCAGCTGCAAGAT.
Chromatin Immunoprecipitation (ChIP)
ChIP analyses were performed on chromatin extracts from myotube cultured with or without pyruvate according to the manufacturer's standard protocol (Millipore, Cat. #17‐610) using antibodies against MyoD (Santa Cruz, SC‐760). Briefly, cells were lysed in RIPA buffer (PBS, 1% NP‐40, 0.5% sodium deoxycholate, 0.1% SDS) and centrifuged at 800 × g for 5 min. The chromatin fraction was sheared by sonication in 1.5‐ml siliconized Eppendorf tubes. The resulting sheared chromatin samples were cleared for 1 h, immunoprecipitated overnight, and washed in buffer I (20 mM Tris–HCl [pH 8.0], 150 mM NaCl, 2 mM EDTA, 0.1% SDS, 1% Triton X‐100), buffer II (20 mM Tris–HCl [pH 8.0], 500 mM NaCl, 2 mM EDTA, 0.1% SDS, 1% Triton X‐100), buffer III (10 mM Tris–HCl [pH 8.0], 250 mM LiCl, 1% NP‐40; 1% sodium deoxycholate, 1 mM EDTA), and Tris–EDTA (pH 8.0). All washes were performed at 4°C for 5 min. Finally, crosslinking was reversed in elution buffer (100 mM sodium bicarbonate [NaHCO3], 1% SDS) at 65°C overnight. The resulting DNA was subjected to qPCR. The primer sequences were designed using DNAMAN. G‐CSF Primer 1‐(s) ATCACAAATGAAGGGCAGAG, (as) CAAGACTGCTTCTGTCTCTCC; G‐CSF Primer 2‐(s) ATGAGCAGAGATCGTCGGGA, (as) CACATTACCTCGATGTCGTG; G‐CSF Primer 3‐(s) TGTCCTCTCAAGCAGAGGCTAT, (as) GATGTTGAGGCATACCTGATG; G‐CSF Primer 4‐(s) CGCAAGATGTCTATCTG, (as) CCATGCCCGGCGAGATTTAATTC; G‐CSF Primer 5‐(s) CTTGTGCAGCTCATCAAGGC, (as) GTGGTGGGGATCTTTTGCTG; G‐CSF Primer 6‐(s) GCTACATTCTGAACGCTGCC, (as) GCCTTGATGAGCTGCACAAG.
SDH and GPDH staining
For measurement of succinate dehydrogenase (SDH) activity, muscles were harvested and serial tissue cross sections (10‐μm) were cut at −20°C and adhered to glass coverslips. The coverslips were inverted and placed over a microscope slide reaction chamber. The tissue was first incubated in the dark at 23°C in a substrate‐free blank solution consisting of 1 mM sodium azide, 1 mM l‐methoxyphenazinemethosulfate (MPMS), 1.5 mM NBT, and 5 mM EDTA in 100 mM sodium phosphate buffer (pH 7.6). The reaction was allowed to proceed for 10 min to allow the nonspecific staining to plateau. The blank was then replaced with a substrate solution consisting of the above reagents plus 48 mM succinic acid. Images were captured every three times for 10 min. For measurement of α‐glycerophosphate dehydrogenase (α‐GPDH) activity, serial sections (14‐μm) were cut, adhered to glass coverslips, and distributed between two Coplin jars kept at −20°C. A blank solution consisting of 1 mM sodium azide, 1 mM MPMS, and 1.2 mM NBT in 100 mM sodium phosphate buffer (pH 7.4, 37°C) was added to one jar while a solution of the above reagents plus 9.3 mM α‐glycerophosphate was introduced into the other for the substrate reaction. The tissue sections were incubated in the dark for 24 min at 37°C, the reactions were stopped by extensive rinsing with distilled water. The images were captured using a microscope (Olympus).
Isolation and staining of single myofibers
Single myofibers were isolated from the EDL muscles of 3 month Pax7‐nGFP mice by digestion with collagenase I (Sigma, C‐0130), as previously described (Wu et al, 2015). Briefly, each muscle sample was incubated in 3 ml of 0.2% collagenase I in serum‐free DMEM in a shaking water bath at 37°C for 45–60 min. Digestion was considered complete when the muscle looked less defined and slightly swollen, with hair‐like single fibers flowing away from the edges. The digested muscles were placed in a Petri dish, and myofibers were isolated under a microscope. Single fibers were placed in six‐well plates pre‐coated with horse serum, and then given 2 ml/well of fiber medium (DMEM supplemented with 20% FBS, 0.5% chick embryo extract, 10 pg/ml G‐CSF, and penicillin–streptomycin). The fibers were cultured for 48 h at 37°C in a 5% CO2 atmosphere, fixed with 4% paraformaldehyde, and stained for G‐CSFR. The fibers were then washed with PBS containing 0.1% BSA and incubated for 2 h with fluorescein‐conjugated secondary antibodies (Zhongshanjinqiao Corporation) and Hoechst or DAPI. For statistical analyses, the cells with symmetric and asymmetric distribution of G‐CSFR were counted in at least 100 doublets per mouse. Five mice were assayed in each set of experiments.
Immunofluorescence
FACS‐resolved Pax7 SCs were seeded on collagen‐coated glass slides in 24‐well plates (2 × 10⁴ cells/cm2) in growth medium (F‐10 containing 20% FBS) for 24 h, fixed with 4% formaldehyde for 5 min, permeabilized in 0.1% Triton X‐100 in PBS for 15 min at room temperature, and then blocked with 3% bovine serum albumin for 30 min. For BrdU immunostaining, the cells were unmasked with 2N HCl for 20 min at room temperature and neutralized with 0.1 M sodium tetraborate. The cells were incubated with primary antibodies against MyoD (Santa Cruz, SC‐760), G‐CSFR (Santa Cruz, SC‐9173), and BrdU (Abcam, ab6326) overnight at 4°C. The cells were then washed with PBS containing 0.1% BSA and incubated for 2 h with fluorescein‐conjugated secondary antibodies (Zhongshanjinqiao Corporation) and Hoechst or DAPI. After several washes with PBS, the cells were examined under a fluorescence microscope (Olympus). EdU signal is detected by click reaction (Invitrogen, C10640).
Western blot analysis
TA and Sol muscles from C57BL/6 mice were homogenized in a buffer containing 50 mM Tris pH 7.5, 150 mM NaCl, 0.5% Nonidet P40, and protease and phosphatase inhibitors. The muscle homogenates were clarified by centrifugation at 12,000 × g for 10 min. Total proteins (40 μg) were resolved by SDS/PAGE, transferred to a polyvinylidene fluoride membrane, and immunoblotted with primary antibodies against MyoD (Santa Cruz, SC‐760) and β‐tubulin (Santa Cruz, SC‐5274) overnight at 4°C. For Stat3 detection, the FACS‐sorted Pax7 SCs were treated with G‐CSF (10 pg/ml) in presence or absence of Stat3 inhibitor, 5,15 DPP (50 μM, Sigma‐Aldrich), in growth medium for 48 h. Subsequently, the nuclear and cytoplasmic fractions were further isolated from the treated SCs with the kit (Thermo, 78835). The nuclear (10 μg) and cytoplasmic protein (15 μg) were resolved by SDS/PAGE, transferred to a polyvinylidene fluoride membrane, and immunoblotted with primary antibodies against Stat3 (Abcam, ab19352), p‐Stat3 (CST, 9154), histone H3 (Abcam, ab1791), and GAPDH (Millipore, Mab374). Membranes were washed for 30 min, incubated with horseradish peroxidase‐conjugated secondary antibodies (Zhongshanjinqiao Corporation) for 1 h at room temperature, and washed for 30 min. Each membrane was then placed into Detection Solution (Thermo), incubated for 1 min at room temperature, and exposed to X‐ray film.
RNA extraction and qRT‐PCR
Total RNA was extracted from skeletal muscles using the TRIzol reagent (Invitrogen) and reverse‐transcribed with reverse transcriptase (Fermentas). Real‐time quantitative PCR analyses were performed in triplicate using the Fast Eva Green qPCR Master Mix (Bio‐Rad). GAPDH was used as an internal control for qRT‐PCR analyses.
Treadmill
Young (3‐month‐old) and aged (18‐month‐old) Pax7‐nGFP;Csf3r −/− mice, their wild‐type littermates (Pax7‐nGFP) were subjected to treadmill exercise using an Exer3/6 (Columbus Instruments). Mice were acclimated to treadmill running four times (every other day) before the test. Each mouse ran on the treadmill at 20° downhill, starting at a speed of 10 cm/s. After 3 min, the speed was increased by 2 cm/s to a final speed of 20 cm/s. Then, the mice were allowed to run 25 min. After exercise training, the mice were sampled for purification and analysis of Pax7Hi and Pax7Lo SCs.
Cell culture and treatments
FACS‐resolved Pax7 SCs were cultured in F‐10 medium containing 20% FBS and 2.5 ng/ml bFGF (Invitrogen) in the presence or absence of G‐CSF (10 pg/ml, Santa Cruz) at 37°C in a 5% CO2 atmosphere. Fibroblasts (C3H‐10T1/2, ATCC) were cultured in DMEM (Gibco) supplemented with 4.5 g/l glucose, 10% FBS, and 1% penicillin/streptomycin at 37°C in a 5% CO2 atmosphere. C2C12 cells (ATCC) were cultured in growth medium consisting of DMEM supplemented with 20% FBS and 1% penicillin/streptomycin. At 70–80% confluence, the C2C12 cells were switched to differentiation medium (DMEM with 2% horse serum). After 5 days of differentiation, the C2C12 myotubes were cultured in differentiation medium with or without pyruvate for 24 h. For MyoD overexpression or knockdown, C2C12 myotubes were transiently transfected with pEGFPN1‐MyoD or LV‐sh‐MyoD using Lipofectamine 2000 (Invitrogen). The empty vector served as the negative control (NC).
Luciferase reporter assay
To test promoter activity, a 2‐kb sequence upstream of the Csf3 gene was retrieved from the University of California Santa Cruz genome browser and cloned into the pGL3 Basic vector carrying the firefly luciferase gene (Promega). The generated pGL3‐G‐CSF‐2k was used to transfect C3H‐10T1/2 cells or C2C12 myotubes in differentiation medium with or without pyruvate. Empty pGL‐3 vector was used as a negative control, and co‐transfection with a Renilla luciferase plasmid (Promega) served as a transfection control. The results are expressed as the activity of firefly luciferase relative to that of Renilla luciferase. For promoter reporter gene assays in vivo, mouse TA muscles were injected with 20 μg of pGL3‐G‐CSF‐2k plasmid DNA with electroporation. Briefly, plate electrodes were positioned on each side of the leg over the TA muscle, in contact with the skin. TA muscles were stimulated eight times (parameters: 100 V, duration 20 ms, interval 100 ms) with a stimulator (EM830, BTX). The same amount of empty pGL3 Basic vector served as a negative control. 5 μg of Renilla luciferase plasmid was co‐injected as a normalization control. Luciferase activity assays were performed with homogenates of TA muscle 24 h after electroporation.
Time‐lapse imaging
Sorted Pax7 SCs or isolated single fibers from Pax7‐nGFP mice were plated on a 24‐well plate pre‐coated with matrigel. After incubation overnight, the cells were filmed with a Real‐Time Cell History Recorder (JuLi stage, NanoEnTek Inc., Korea) inside an incubator. Images were taken every 15 min using the bright and GFP channels. The raw data were transformed and were presented as a video.
Template DNA strand segregation (TDSS)
Template DNA strand segregation was analyzed as previously reported (Rocheteau et al, 2012). Briefly, the TA muscles of Pax7‐nGFP mice (3 months) were injured by intramuscular injection of cardiotoxin (CTX; 50 μl of 10‐μM CTX per TA muscle). Mice were injected intraperitoneally 3 days post‐injury with EdU (five times, 200 mg/injection, 8 h apart) followed by injection of BrdU (twice, 8 h apart). Then, Pax7 SCs were sorted, cultured in DMEM (Gibco, 11550043) supplemented with 10% FBS, 1% penicillin/streptomycin, and 2.5 ng/ml FGF for a further 24 h, and immunostained with anti‐BrdU (1:300, Abcam) and the Click‐iT® EdU Imaging Kit (Invitrogen, C10086).
Measurement of NAD
NAD+ and NADH were determined using commercially available kits (Biovision, Milpitas) according to the provider's instructions.
Statistical analysis
Data are presented as means ± SEM. For statistical comparisons of two conditions, the two‐tailed Student's t‐test was used. Comparisons of multiple groups were made using a 1‐ or 2‐way ANOVA. All experiments were repeated at least three times, and representative experiments are shown. Statistical analysis was performed in GraphPad Prism.
Author contributions
DZ conceived the project, coordinated the study, and wrote the paper. HL designed and performed the experiments. QC performed single‐cell RNA library construction. CL performed the screening of muscle‐secreted factors. RZ and YXZ performed the luciferase reporter gene assays. QZ performed analysis of SCs from aged Pax7‐nGFP mice. WT gave constructive discussion and helped to draft the manuscript. YZ helped draft the figure legends and experimental procedures of the manuscript. All authors approved the final version of the manuscript.
Conflict of interest
The authors declare that they have no conflict of interest.
Supporting information
Appendix
Expanded View Figures PDF
Movie EV1
Movie EV2
Source Data for Expanded View
Review Process File
Source Data for Figure 2
Source Data for Figure 3
Acknowledgements
We greatly thank Yunning Geng and Huimin Liao from Bio‐reach Co., Ltd., for their technical support of our time‐pulse imaging experiments, and Dr. Shahragim Tajbakhsh and Dr. Zhenji Gan for providing the Pax7‐nGFP mice and PPARβ transgenic mice. This work was supported by grants from the National Basic Research Program of China (2015CB943103, 2016YFA0100703), the National Natural Science Foundation of China (91540206, 31471289, 31471377), and the CAMS Initiative for Innovative Medicine (2016‐I2M‐1‐017).
The EMBO Journal (2019) 38: e102154
See also: https://doi.org/10.15252/embj.2019103924 (December 2019)
Contributor Information
Dahai Zhu, Email: dhzhu@pumc.edu.cn.
Yong Zhang, Email: yongzhang@ibms.pumc.edu.cn.
Data availability
Related data were submitted to GEO with the accession number GSE134253 (https://www.ncbi.nlm.nih.gov/geo/query/acc.cgi?acc=GSE134253).
References
- Carey BW, Finley LW, Cross JR, Allis CD, Thompson CB (2015) Intracellular alpha‐ketoglutarate maintains the pluripotency of embryonic stem cells. Nature 518: 413–416 [DOI] [PMC free article] [PubMed] [Google Scholar]
- Chakkalakal JV, Jones KM, Basson MA, Brack AS (2012) The aged niche disrupts muscle stem cell quiescence. Nature 490: 355–360 [DOI] [PMC free article] [PubMed] [Google Scholar]
- Chen WW, Freinkman E, Wang T, Birsoy K, Sabatini DM (2016) Absolute quantification of matrix metabolites reveals the dynamics of mitochondrial metabolism. Cell 166: 1324–1337 e11 [DOI] [PMC free article] [PubMed] [Google Scholar]
- Collins CA, Olsen I, Zammit PS, Heslop L, Petrie A, Partridge TA, Morgan JE (2005) Stem cell function, self‐renewal, and behavioral heterogeneity of cells from the adult muscle satellite cell niche. Cell 122: 289–301 [DOI] [PubMed] [Google Scholar]
- Conboy IM, Conboy MJ, Smythe GM, Rando TA (2003) Notch‐mediated restoration of regenerative potential to aged muscle. Science 302: 1575–1577 [DOI] [PubMed] [Google Scholar]
- Cornelison DD, Olwin BB, Rudnicki MA, Wold BJ (2000) MyoD(‐/‐) satellite cells in single‐fiber culture are differentiation defective and MRF4 deficient. Dev Biol 224: 122–137 [DOI] [PubMed] [Google Scholar]
- Feldman JL, Stockdale FE (1991) Skeletal muscle satellite cell diversity: satellite cells form fibers of different types in cell culture. Dev Biol 143: 320–334 [DOI] [PubMed] [Google Scholar]
- Gan Z, Rumsey J, Hazen BC, Lai L, Leone TC, Vega RB, Xie H, Conley KE, Auwerx J, Smith SR et al (2013) Nuclear receptor/microRNA circuitry links muscle fiber type to energy metabolism. J Clin Invest 123: 2564–2575 [DOI] [PMC free article] [PubMed] [Google Scholar]
- Hara M, Yuasa S, Shimoji K, Onizuka T, Hayashiji N, Ohno Y, Arai T, Hattori F, Kaneda R, Kimura K et al (2011) G‐CSF influences mouse skeletal muscle development and regeneration by stimulating myoblast proliferation. J Exp Med 208: 715–727 [DOI] [PMC free article] [PubMed] [Google Scholar]
- Hayashiji N, Yuasa S, Miyagoe‐Suzuki Y, Hara M, Ito N, Hashimoto H, Kusumoto D, Seki T, Tohyama S, Kodaira M et al (2015) G‐CSF supports long‐term muscle regeneration in mouse models of muscular dystrophy. Nat Commun 6: 6745 [DOI] [PubMed] [Google Scholar]
- Heath GW, Gavin JR III, Hinderliter JM, Hagberg JM, Bloomfield SA, Holloszy JO (1983) Effects of exercise and lack of exercise on glucose tolerance and insulin sensitivity. J Appl Physiol Respir Environ Exerc Physiol 55: 512–517 [DOI] [PubMed] [Google Scholar]
- Holloszy JO, Chen M, Cartee GD, Young JC (1991) Skeletal muscle atrophy in old rats: differential changes in the three fiber types. Mech Ageing Dev 60: 199–213 [DOI] [PubMed] [Google Scholar]
- Kuang S, Kuroda K, Le Grand F, Rudnicki MA (2007) Asymmetric self‐renewal and commitment of satellite stem cells in muscle. Cell 129: 999–1010 [DOI] [PMC free article] [PubMed] [Google Scholar]
- Lagord C, Soulet L, Bonavaud S, Bassaglia Y, Rey C, Barlovatz‐Meimon G, Gautron J, Martelly I (1998) Differential myogenicity of satellite cells isolated from extensor digitorum longus (EDL) and soleus rat muscles revealed in vitro . Cell Tissue Res 291: 455–468 [DOI] [PubMed] [Google Scholar]
- von Maltzahn J, Jones AE, Parks RJ, Rudnicki MA (2013) Pax7 is critical for the normal function of satellite cells in adult skeletal muscle. Proc Natl Acad Sci USA 110: 16474–16479 [DOI] [PMC free article] [PubMed] [Google Scholar]
- Megeney LA, Kablar B, Garrett K, Anderson JE, Rudnicki MA (1996) MyoD is required for myogenic stem cell function in adult skeletal muscle. Genes Dev 10: 1173–1183 [DOI] [PubMed] [Google Scholar]
- Molofsky AV, Slutsky SG, Joseph NM, He S, Pardal R, Krishnamurthy J, Sharpless NE, Morrison SJ (2006) Increasing p16INK4a expression decreases forebrain progenitors and neurogenesis during ageing. Nature 443: 448–452 [DOI] [PMC free article] [PubMed] [Google Scholar]
- Moussaieff A, Rouleau M, Kitsberg D, Cohen M, Levy G, Barasch D, Nemirovski A, Shen‐Orr S, Laevsky I, Amit M et al (2015) Glycolysis‐mediated changes in acetyl‐CoA and histone acetylation control the early differentiation of embryonic stem cells. Cell Metab 21: 392–402 [DOI] [PubMed] [Google Scholar]
- Nishimura EK, Granter SR, Fisher DE (2005) Mechanisms of hair graying: incomplete melanocyte stem cell maintenance in the niche. Science 307: 720–724 [DOI] [PubMed] [Google Scholar]
- Pedersen BK, Febbraio MA (2008) Muscle as an endocrine organ: focus on muscle‐derived interleukin‐6. Physiol Rev 88: 1379–1406 [DOI] [PubMed] [Google Scholar]
- Pedersen BK, Febbraio MA (2012) Muscles, exercise and obesity: skeletal muscle as a secretory organ. Nat Rev Endocrinol 8: 457–465 [DOI] [PubMed] [Google Scholar]
- Rando TA (2006) Stem cells, ageing and the quest for immortality. Nature 441: 1080–1086 [DOI] [PubMed] [Google Scholar]
- Rocheteau P, Gayraud‐Morel B, Siegl‐Cachedenier I, Blasco MA, Tajbakhsh S (2012) A subpopulation of adult skeletal muscle stem cells retains all template DNA strands after cell division. Cell 148: 112–125 [DOI] [PubMed] [Google Scholar]
- Rodriguez‐Colman MJ, Schewe M, Meerlo M, Stigter E, Gerrits J, Pras‐Raves M, Sacchetti A, Hornsveld M, Oost KC, Snippert HJ et al (2017) Interplay between metabolic identities in the intestinal crypt supports stem cell function. Nature 543: 424–427 [DOI] [PubMed] [Google Scholar]
- Roper J, Yilmaz OH (2017) Metabolic teamwork in the stem cell niche. Cell Metab 25: 993–994 [DOI] [PMC free article] [PubMed] [Google Scholar]
- Rossi MA, Mash DC, deToledo‐Morrell L (2005) Spatial memory in aged rats is related to PKCgamma‐dependent G‐protein coupling of the M1 receptor. Neurobiol Aging 26: 53–68 [DOI] [PubMed] [Google Scholar]
- Ryall JG, Dell'Orso S, Derfoul A, Juan A, Zare H, Feng X, Clermont D, Koulnis M, Gutierrez‐Cruz G, Fulco M et al (2015) The NAD(+)‐dependent SIRT1 deacetylase translates a metabolic switch into regulatory epigenetics in skeletal muscle stem cells. Cell Stem Cell 16: 171–183 [DOI] [PMC free article] [PubMed] [Google Scholar]
- Sambasivan R, Yao R, Kissenpfennig A, Van Wittenberghe L, Paldi A, Gayraud‐Morel B, Guenou H, Malissen B, Tajbakhsh S, Galy A (2011) Pax7‐expressing satellite cells are indispensable for adult skeletal muscle regeneration. Development 138: 3647–3656 [DOI] [PubMed] [Google Scholar]
- Schiaffino S, Reggiani C (2011) Fiber types in mammalian skeletal muscles. Physiol Rev 91: 1447–1531 [DOI] [PubMed] [Google Scholar]
- Schofield R (1978) The relationship between the spleen colony‐forming cell and the haemopoietic stem cell. Blood cells 4: 7–25 [PubMed] [Google Scholar]
- Seale P, Sabourin LA, Girgis‐Gabardo A, Mansouri A, Gruss P, Rudnicki MA (2000) Pax7 is required for the specification of myogenic satellite cells. Cell 102: 777–786 [DOI] [PubMed] [Google Scholar]
- Troy A, Cadwallader AB, Fedorov Y, Tyner K, Tanaka KK, Olwin BB (2012) Coordination of satellite cell activation and self‐renewal by Par‐complex‐dependent asymmetric activation of p38alpha/beta MAPK. Cell Stem Cell 11: 541–553 [DOI] [PMC free article] [PubMed] [Google Scholar]
- Wilson A, Laurenti E, Oser G, van der Wath RC, Blanco‐Bose W, Jaworski M, Offner S, Dunant CF, Eshkind L, Bockamp E et al (2008) Hematopoietic stem cells reversibly switch from dormancy to self‐renewal during homeostasis and repair. Cell 135: 1118–1129 [DOI] [PubMed] [Google Scholar]
- Wu R, Li H, Zhai L, Zou X, Meng J, Zhong R, Li C, Wang H, Zhang Y, Zhu D (2015) MicroRNA‐431 accelerates muscle regeneration and ameliorates muscular dystrophy by targeting Pax7 in mice. Nat Commun 6: 7713 [DOI] [PubMed] [Google Scholar]
- Xie T, Spradling AC (2000) A niche maintaining germ line stem cells in the Drosophila ovary. Science 290: 328–330 [DOI] [PubMed] [Google Scholar]
Associated Data
This section collects any data citations, data availability statements, or supplementary materials included in this article.
Supplementary Materials
Appendix
Expanded View Figures PDF
Movie EV1
Movie EV2
Source Data for Expanded View
Review Process File
Source Data for Figure 2
Source Data for Figure 3
Data Availability Statement
Related data were submitted to GEO with the accession number GSE134253 (https://www.ncbi.nlm.nih.gov/geo/query/acc.cgi?acc=GSE134253).