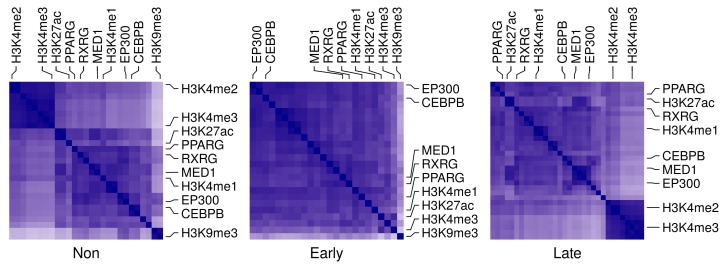
Figure 7.
Correlation in occupancy between adipogenic transcription factors and histone markers on autophagy genes at different stages. The total number of reads in peaks of each ChIP-Seq sample (n = 84) was used to represent the factor/histone marker occupancy. Pearson’s correlation coefficient (PCC) was calculated for each pair of samples. The PCC value is between 0 (white) and 1 (blue). Samples were categorized by differentiation stage; non, early or late in that order.

