Figure 2.
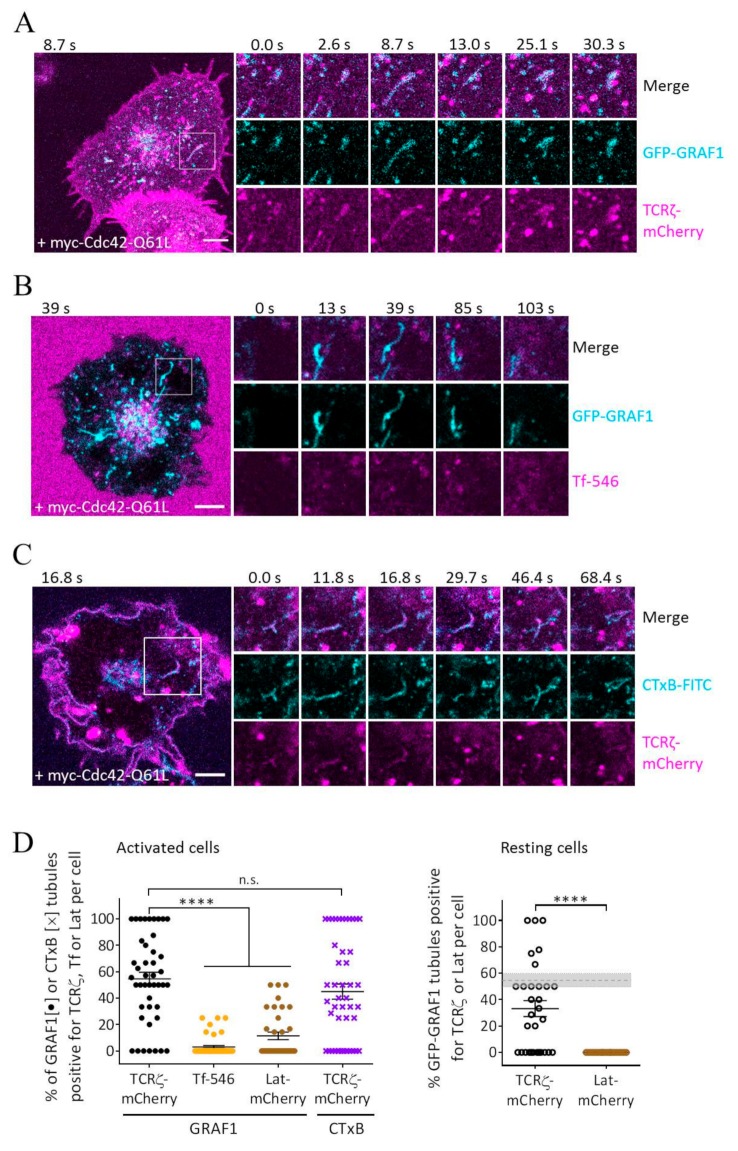
GRAF1- and CTxB-positive tubules contain TCRζ but not transferrin. (A) Representative time series of Jurkat T cells expressing myc-Cdc42-Q61L, GFP-GRAF1, and TCRζ-mCherry, and activated on coverslips coated with functional antibodies against CD3ε and CD28 and imaged live at 37˚C. (B,C) Jurkat T cells expressing myc-Cdc42-Q61L and GFP-GRAF1 (B) or TCRζ-mCherry (C) were incubated with Alexa546-Tf (B) or CTxB-FITC (C) for 10 min and imaged live at 37 °C. (D) Quantification of the cells as shown in (A), (B), and (D). Percentage of GRAF1- or CTxB-positive tubules that were also positive for TCRζ-mCherry, Alexa546-Tf, or Lat-mCherry in activated (left, anti-CD3ε and anti-CD28) or resting (right, Poly-L-Lysine) cells. On the right, the dotted horizontal line represents the values for TCRζ in activated cells. Data from at least 45 cells in at least 3 independent experiments. Each data point represents a cell. Small horizontal lines indicate mean (±SEM), **** p < 0.0001, unpaired, n.s. not significant, two-tailed student’s t-test. There were 11 outliers removed for Tf, 8 outliers were removed for Lat-mCherry (resting) using the robust regression and outlier removal (ROUT) method (Q = 0.1%). Scale bar: 5 μm.

