

Abstract
Background
Despite the success of current cardiovascular disease (CVD) management programs, many patients do not achieve optimal control of CVD‐related risk factors. New strategies are needed to better activate and engage these patients.
Methods and Results
We conducted a parallel, 2‐arm, randomized controlled trial, CREATE Wellness (Changing Results—Engage and Activate to Enhance Wellness) from February 2015 to September 2017 with 12‐month follow‐up to September 2018. Eligible participants had ≥1 uncontrolled CVD risk factors (hyperlipidemia, hypertension, or diabetes mellitus) for at least 2 years before study enrollment. The control group (n=315) received usual care within an existing CVD population‐based disease management program. The intervention group (n=332) received usual care plus a group‐based behavioral intervention focused on patient activation and engagement. Study outcomes included patient activation and patient‐centered care processes (6 months) and healthcare system engagement, medication adherence, and control of CVD risk factors (12 months). Compared with the control group at follow‐up, the intervention group had greater improvement in patient activation (adjusted mean difference=2.8, P=0.01), patient‐centered care (adjusted mean difference=0.19, P=0.003), and 2 out of 3 measures of healthcare system engagement (eg, secure messages exchanged with a population health manager; adjusted incidence rate ratio=1.7, P=0.01). Intervention and control arms did not differ on improvement in 1‐year CVD risk factor control.
Conclusions
Further work is needed to more effectively connect increased patient activation and engagement to downstream changes in risk factor control.
Clinical Trial Registration
URL: http://www.clinicaltrials.gov. Unique identifier: NCT02302612.
Keywords: cardiovascular disease risk factors, disease management, patient‐centered care
Subject Categories: Behavioral/Psychosocial Treatment, Quality and Outcomes, Health Services
Clinical Perspective
What Is New?
This randomized controlled trial assessed a new intervention program designed to increase self‐management knowledge, skills, and confidence among patients in a cardiovascular disease risk factor management program who were consistently falling short of treatment goals.
What Are the Clinical Implications?
A small number of patient‐centered group sessions and between‐session individual contacts improved patients’ activation, healthcare experiences, and engagement with the healthcare system, but did not significantly improve cardiovascular disease risk factor control relative to usual care.
Patients who struggle to meet cardiovascular disease risk factor control targets may benefit from more intensive intervention addressing additional barriers at the individual, family, community, care team, and health system level.
Introduction
More than 90 million adults in the US population are living with cardiovascular disease (CVD).1 Although medical advances have dramatically improved the diagnosis and treatment of CVD risk factors such as hyperlipidemia, hypertension, and diabetes mellitus, most patients do not meet all guideline‐recommended risk factor reduction targets.2, 3, 4 This gap persists despite widespread implementation of disease management programs to improve the identification and control of chronic conditions.5, 6 Patients who struggle with behavioral, psychological, and social barriers may not sufficiently engage with the array of data‐driven and team‐based services increasingly incorporated into primary care.7 New care strategies are therefore needed to unlock the potential of evidence‐based disease management efforts for these more complex patients.
Interventions that enhance patient activation offer one potential strategy to improve the impact of CVD risk management programs. The term patient activation refers to individuals’ understanding of the role they play in their health, and their knowledge, skill, and confidence in taking actions to advance health‐related goals.8 Patient activation provides a foundation for achieving patient‐centered and collaborative care, consistent with principles of the Chronic Care Model.9 More activated patients report better care quality and coordination,10, 11 communicate more often with medical providers,12 and exhibit better medication adherence,13 compared with less activated patients. Interventions based on group learning and motivational interviewing (a patient‐centered counseling technique) have been associated with improved patient activation.14, 15 However, there remains a need for randomized clinical trials to demonstrate the effects of patient activation interventions on clinical outcomes such as CVD risk factor control, and more study of how to activate and engage patients in a population health management context.
We hypothesized that a behavioral intervention to increase patient activation, patient‐centered care processes, and healthcare system engagement would lead to improved CVD risk factor control. We tested this hypothesis in a randomized clinical trial, CREATE Wellness (Changing Results—Engage and Activate to Enhance Wellness), for patients persistently falling short of treatment targets within an integrated healthcare delivery system's existing CVD disease management program.
Methods
The data that support the findings of this study are available from the authors upon reasonable request; please send requests by email to richard.w.grant@kp.org.
Study Setting
We conducted the CREATE Wellness randomized clinical trial from February 2015 to September 2017 with 1 year of clinical follow‐up ending September 2018 (ClinicalTrial.gov NCT02302612). This parallel, 2‐arm trial was implemented with randomization at the patient level stratified by medical facility. We enrolled 647 patients from 3 medical facilities within Kaiser Permanente Northern California (KPNC). KPNC is a non‐profit integrated healthcare delivery system providing care for over 4.4 million members throughout Northern California. The distribution of member demographic and socioeconomic factors is diverse and similar to that of the regional population.16
Usual Care
As part of usual care, all KPNC members with increased CVD risk are automatically identified for care by the KPNC Preventing Heart Attacks and Strokes Everyday disease management program,17 a successful population‐based CVD risk management program first implemented in 2005. Using a continuously updated patient registry, nurses and pharmacists assist patients with CVD risk factor control through regular outreach by telephone or secure message through the electronic patient portal. These disease management clinicians support medication adherence, laboratory testing, and other self‐management behaviors intended to facilitate achievement of CVD risk factor control.
CREATE Wellness Intervention
CREATE Wellness was designed to provide patients with the knowledge and skills to more effectively benefit from CVD disease management programs. The CREATE Wellness intervention consisted of 3 group‐based patient activation sessions 2 weeks apart that included between‐session contacts with the interventionist (by secure message, telephone, or video appointment) to reinforce self‐management behaviors and skills discussed in the prior session and to build confidence to manage overall health. The design and content of CREATE Wellness has been described previously.18 Briefly, the intervention design drew upon feedback from patient and clinician stakeholders and was modeled on evidence from the patient activation and engagement research literature.19, 20, 21, 22, 23, 24, 25, 26, 27, 28 CREATE Wellness sought to provide a forum for patients to define their own treatment priorities, practice skills in healthcare system engagement, and identify strategies for addressing obstacles to self‐management. Participants were able to join sessions by telephone if they could not attend in person.
One of 3 different study interventionists with a health education training background facilitated the sessions using motivational interviewing techniques. Motivational interviewing differs from traditional didactic counseling through the use of active listening and empathy, elicitation of ideas from patients’ own lived experiences, and reinforcement of incremental cognitive and behavioral steps towards a patient‐defined goal.29 Using the group‐based structure, interventionists encouraged peer feedback to reinforce participant successes and collective problem‐solving in response to care‐related barriers. A key product of CREATE Wellness sessions was the development of an individualized care plan. This plan, intended for participants to collaboratively share with their primary care physicians and care team, translated priorities defined during the intervention into actionable steps. CREATE Wellness sessions also incorporated active practice, including live demonstrations of electronic patient portal tools and participant role‐play of planned conversations with their medical providers, to enhance patient confidence to manage their overall health even in the face of life stressors.
Clinical Trial Procedures
Patient eligibility criteria included: age 40 to 85 years, English proficiency, and ≥1 unmeasured or uncontrolled CVD risk factors (hyperlipidemia, hypertension, or diabetes mellitus) during at least 2 years before enrollment. Uncontrolled hyperlipidemia was defined as low‐density lipoprotein (LDL) cholesterol ≥100 and no current statin medication; uncontrolled hypertension was defined as systolic blood pressure (SBP) ≥140 mm Hg; and uncontrolled diabetes mellitus was defined as hemoglobin A1c (HbA1c) ≥8 among patients with diagnosed diabetes mellitus.
Study staff identified potentially eligible patients using electronic health record (EHR) data. After we obtained approval from individuals’ care managers, eligible participants were contacted and provided written consent. Study allocation via a random number generator was to either the intervention group (usual care plus CREATE Wellness intervention) or to the control group (usual care only).
Study staff scheduled CREATE Wellness participants into upcoming group‐based intervention cohorts, with a goal of enrolling 8 to 12 participants per intervention cohort. Although patients could not be blinded to randomization status, usual care providers and research staff collecting clinical EHR data or survey responses were blinded to randomization status. The Kaiser Foundation Research Institute provided Institutional Review Board (IRB) approval for our study.
Baseline Assessment
During an in‐person enrollment interview, participants completed baseline self‐report measures capturing demographics, health literacy (one item: “How often do you have problems learning about your medical condition because of difficulty understanding written information?” dichotomized at “sometimes”30), depressive symptoms (the 9‐item Patient Health Questionnaire31), and measures of patient activation and patient‐centered care processes. We ascertained baseline body mass index, attainment of CVD risk factor control, and current statin medication from EHR‐derived data recorded in the year before study enrollment. For participants with no measured body mass index, LDL, SBP, or HbA1c (only patients with diabetes mellitus) in this time period, we used the most recent prior value recorded in the EHR during the 2 years before the baseline enrollment interview.
Outcome Assessment
Participants completed patient‐reported outcome measures (patient activation and patient‐centered care processes) by telephone 6 months post‐enrollment using telephone‐validated surveys. We collected measures of healthcare system engagement, CVD risk factor control, and medication adherence from participants’ EHRs and pharmacy dispensing data recorded during the 12 months after the baseline enrollment date.
Patient activation
The 13‐item patient activation measure32 assessed individuals’ perceived responsibility for their own health and degree of skill, knowledge, and confidence in self‐care; raw scores were recalibrated per the developers’ instructions to a 0 to 100 scale, with higher levels signifying greater patient activation.
Patient‐centered care processes
The Patient Assessment of Chronic Illness Care (PACIC)33 captured the degree to which participants saw their healthcare team as patient‐centered and aligned with the Chronic Care model. This 20‐item questionnaire generated a summary score (mean of all items) and 5 subscale mean‐item scores capturing the following processes: Patient Activation (providers encourage patient involvement in care; 3 items); the Delivery System (the system is well‐organized and provides information that enhances patients’ self‐care decisions; 3 items); Goal Setting (providers are collaborative in setting and tailoring goals; 5 items), Problem Solving (providers consider the patient's context and possible barriers in devising treatment plans; 4 items), and Follow‐Up (providers are proactive about contacting patients, monitoring progress, and coordinating additional care; 5 items). Response options ranged from 1 (none of the time) to 5 (always), with higher scores indicating more patient‐centered care.
Healthcare system engagement
Using EHR data, we assessed communication between patients and their CVD population manager through secure messaging on the electronic patient portal and through telephone‐based appointments. Activity logs from the healthcare system's electronic patient portal provided a measure of how many days patients logged in to access their health data or communicate with providers. Secure messages, telephone appointments, and login‐days were summarized by 6‐month intervals during the 1‐year follow‐up period, both as total counts and as binary any/none outcomes.
Medication adherence and initiation
We measured participants’ adherence to lipid, blood pressure, and diabetes mellitus control medications, when prescribed, and the initiation of these medications using pharmacy dispensation records. We calculated proportion of days covered (PDC)34 for each therapeutic category and classified proportion of days covered ≥80% as sufficient medication adherence. For each medication type, the first dispensation recorded in the follow‐up period (with no dispensation record in the year preceding baseline) was classified as medication initiation.
CVD risk factor control
Based on the last recorded LDL, SBP, and HbA1c value in the EHR during the 1‐year follow‐up period, we counted the number of participants per arm who closed a care gap by achieving “at goal” status in a risk factor domain that was not previously in control, and the number for whom no care gaps remained at the end of the study. “At goal” status was also assessed separately for each risk factor. Consistent with study inclusion criteria, the participant achieved “at goal” status with LDL <100 or prescription of a statin medication (hyperlipidemia goal), SBP <140 mm Hg (hypertension goal), or HbA1c <8.0 (diabetes mellitus goal for participants with diagnosed diabetes mellitus). We also assessed last‐recorded follow‐up LDL, SBP, and HbA1c as continuous variables.
Statistical Analysis
Power was determined based on the proportion of patients closing any care gap during the 12‐month follow‐up period, assuming a 2‐sided significance level of 0.05. The study had ≥0.90 power to detect a 15% difference between study arms with at least 300 participants in each arm. All group comparisons were based on intention‐to‐treat principles and used SAS version 9.435 or Stata version 15 statistical software.36
We compared baseline patient characteristics between the control and intervention groups using Wilcoxon rank‐sum and Fisher exact tests, as appropriate. To test intervention effects on patient‐reported outcomes, we estimated a general linear mixed effects model with change score as the outcome, group assignment and baseline value of the outcome as predictors, and a random intercept per medical facility to adjust for any within‐site dependency. For healthcare system engagement, we used a generalized linear mixed effects model with repeated outcome measures at 6 and 12 months post‐baseline, with prediction by group assignment and time, and random intercepts at the patient and facility levels. Estimation for healthcare system engagement outcomes was either binomial with a logit link (binary outcomes) or Poisson with a log link (count outcomes). For medication adherence or initiation and CVD risk factor control, we estimated a generalized linear mixed effects model (binomial with logit link), with group as the predictor and including a random intercept for medical facility.
Results
Recruitment, Enrollment, and Follow‐Up
Participants were recruited in cycles from 1/2015 to 8/2017 from 3 medical facilities across 2 Northern California counties. Of 3616 identified eligible patients (Figure, Consolidated Standards of Reporting Trials [CONSORT] diagram), 1515 were excluded mainly because of non‐response to repeated telephone contact attempts. Of the 2101 patients contacted for enrollment, 728 were not interested in participating and 726 declined because of scheduling conflicts or health issues that made it hard to travel to 3 in‐person sessions. We obtained informed consent and conducted baseline interviews with all 647 enrolled participants. Among enrolled participants, 95% completed follow‐up interviews. Of the 332 participants randomized to the CREATE Wellness intervention arm, 321 participated in all or some of the intervention activities (including a follow‐up interview) among whom 299 (93.1%) attended at least one session and 275 (85.7%) attended all 3 sessions.
Figure 1.
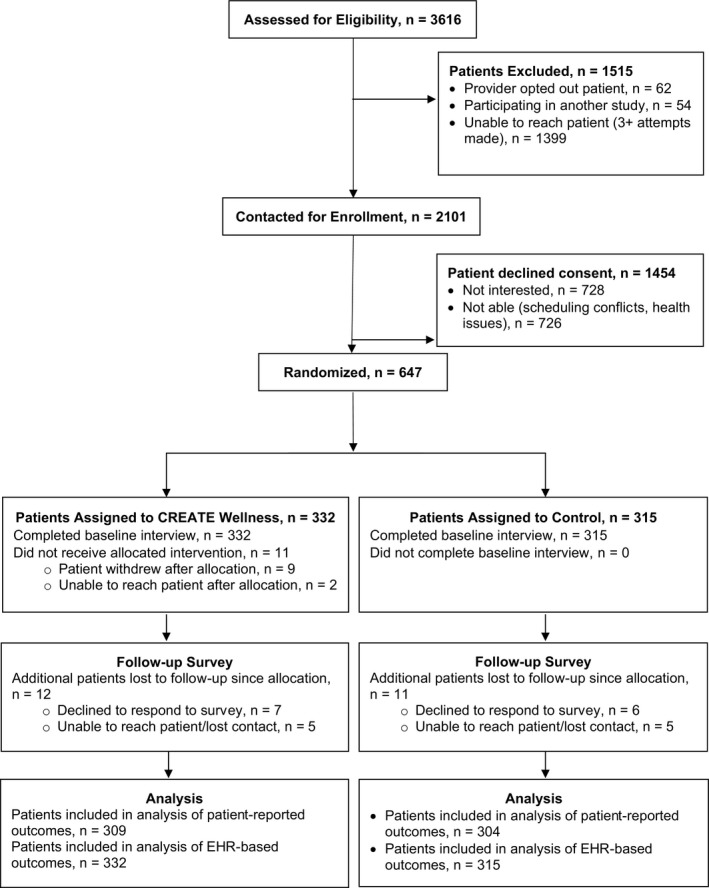
CREATE Wellness Consolidated Standards of Reporting Trials flow diagram. CREATE Wellness indicates Changing Results—Engage and Activate to Enhance Wellness; EHR, electronic health record.
Baseline Participant Characteristics
Study participants averaged 60.1±9.2 years of age and 55.8% were women. The cohort was diverse in race/ethnicity (32.6% white, 26.3% Latino, 21.2% Asian, 11.4% black). The 2 study arms were similar on all baseline demographic and clinical characteristics (Table 1).
Table 1.
Participant Characteristics at Baseline
| Characteristic | n (%) | |
|---|---|---|
| Intervention (n=332) | Control (n=315) | |
| Age, mean±SD, y | 59.7±8.9 | 59.7±9.5 |
| Women | 180 (54.2) | 182 (57.8) |
| White | 108 (32.5) | 103 (32.7) |
| Hispanic | 91 (27.4) | 79 (25.1) |
| Asian | 71 (21.4) | 66 (21.0) |
| Black | 39 (11.8) | 35 (11.1) |
| Native American | 12 (3.6) | 14 (4.4) |
| Other race/ethnicity | 11 (3.3) | 18 (5.7) |
| Unemployed or disabled | 35 (10.6) | 25 (8.0) |
| Household income ≤$50 000 | 100 (30.1) | 97 (30.8) |
| College graduate | 129 (38.9) | 123 (39.1) |
| Low health literacy | 76 (23.0) | 71 (22.6) |
| Depressive symptoms, mean PHQ‐9 score±SD | 4.17±4.4 | 4.52±4.8 |
| Patient activation, mean PAM score±SD | 64.4±16.9 | 62.7±16.4 |
| Patient‐centered care processes, mean PACIC summary score±SD | 3.24±1.1 | 3.21±1.0 |
| PACIC Patient activation score, mean±SD | 3.28±1.3 | 3.37±1.2 |
| PACIC Delivery system score, mean±SD | 3.57±1.1 | 3.55±1.1 |
| PACIC Goal Setting score, mean±SD | 3.22±1.2 | 3.20±1.1 |
| PACIC Problem solving score, mean±SD | 3.29±1.3 | 3.29±1.3 |
| PACIC Follow‐up score, mean±SD | 2.89±1.2 | 2.76±1.2 |
| Body mass index, mean±SD | 33.4±7.6 | 34.1±8.8 |
| <25 | 27 (8.6) | 37 (12.7) |
| 25 to 29 | 82 (26.3) | 75 (25.8) |
| ≥30 | 203 (65.1) | 179 (61.5) |
| Hyperlipidemia | ||
| At goal | 193 (59.6) | 183 (60.4) |
| On statin medication | 124 (38.3) | 142 (46.9) |
| LDL cholesterol, mean±SD | 105.3±37.9 | 104.2±39.4 |
| LDL cholesterol for n=301 on statin at baseline | 90.0±30.3 | 86.7±34.6 |
| LDL cholesterol for n=326 not on statin at baseline | 118.8±38.3 | 120.6±36.4 |
| Hypertension | ||
| At goal | 199 (59.9) | 187 (59.4) |
| Systolic blood pressure, mean±SD | 129.8±14.9 | 129.1±14.1 |
| Diabetes mellitus | ||
| At goal | 83 (26.8) | 94 (31.2) |
| Hemoglobin A1c, mean±SD % | 9.0±1.7 | 8.7±1.7 |
Low health literacy indicates that the participant had difficulty understanding written information about health conditions at least sometimes (1 item). LDL indicates low‐density lipoprotein; PACIC, Patient Assessment of Chronic Illness Care; PAM, Patient Activation Measure; PHQ‐9, Patient Health Questionnaire, 9‐item version.
Patient‐Reported Outcomes
At 6 months post‐enrollment, intervention participants had relatively higher increases in patient activation (adjusted mean difference [AMD]=2.8; P=0.01, Table 2). They also reported more improvement in patient‐centered care processes in accordance with Chronic Care Model principles (AMD=0.19; P=0.003), including more activation by providers (AMD=0.25; P=0.01), more collaborative goal setting (AMD=0.24; P=0.002), and more patient‐centered problem‐solving (AMD=0.22; P=0.01).
Table 2.
Intervention Effects on Patient‐Reported Outcomes at 6 Months
| Outcome | Intervention (n=309) | Control (n=304) | Adjusted Mean Differences (95% CI)a | P Value |
|---|---|---|---|---|
| Change in Score at Follow‐Up, Mean±SD | ||||
| Patient activation | 3.2±16.8 | 1.3±16.0 | 2.8 (0.71 to 4.8) | 0.01 |
| Patient‐centered care | 0.26±0.94 | 0.07±0.93 | 0.19 (0.07 to 0.32) | 0.003 |
| Patient activation score | 0.24±1.3 | 0.07±1.4 | 0.25 (0.07 to 0.43) | 0.01 |
| Delivery system score | 0.33±1.1 | 0.24±1.1 | 0.09 (−0.06 to 0.24) | 0.23 |
| Goal setting score | 0.28±1.1 | 0.05±1.2 | 0.24 (0.09 to 0.39) | 0.002 |
| Problem solving score | 0.35±1.3 | 0.12±1.2 | 0.22 (0.06 to 0.38) | 0.01 |
| Follow‐up score | 0.14±1.2 | 0.04±1.2 | 0.16 (−0.004 to 0.32) | 0.06 |
Adjusted for baseline scores per outcome with random intercept for medical facility.
Effects on Healthcare System Engagement
By 1‐year post‐enrollment, intervention participants engaged more frequently with the healthcare system using online tools than participants in the control group (Table 3). Compared with the control group, intervention participants were more likely to have exchanged any secure messages with population health managers (47.3% versus 32.7%; odds ratio=1.8; P<0.01) and had a 70% higher adjusted rate of exchanging secure messages (incidence rate ratio =1.7; P=0.01). Relative to the control group, the intervention group had a 30% higher adjusted rate of days logging into the electronic patient portal (incidence rate ratio =1.3; P=0.04).
Table 3.
Intervention Effects on Healthcare System Engagement by 12 Months
| Outcome | Intervention (n=332) | Control (n=315) | Adjusted Estimatea (95% CI) | P Value |
|---|---|---|---|---|
| Secure messages exchanged with population health manager | ||||
| Annual messages, mean±SD | 2.0±3.5 | 1.3±3.0 | 1.7 (1.27–2.22)b | 0.01 |
| Participants with any messages in 12 mo, n (%) | 157 (47.3) | 103 (32.7) | 1.8 (1.30–2.50)c | <0.01 |
| Electronic patient portal login days | ||||
| Annual login days, mean±SD | 32.5±32.6 | 29.3±38.3 | 1.3 (1.01–1.61)b | 0.04 |
| Participants with any login days in 12 mo, n (%) | 292 (88.0) | 261 (82.9) | 1.3 (0.87–1.93)c | 0.19 |
| Telephone encounters with population health manager | ||||
| Annual encounters, mean±SD | 1.2 (2.6) | 1.1 (2.8) | 1.1 (0.77–1.58)b | 0.59 |
| Participants with any encounters in 12 mo, n (%) | 96 (28.9) | 72 (22.9) | 1.2 (0.82–1.74)c | 0.35 |
Estimates adjust for group and time (2 6‐month time intervals), with random intercepts for participant and medical facility.
Incidence rate ratio.
Odds ratio.
Clinical Outcomes and Medication Adherence
Our clinical trial was powered for the primary composite outcome of achieving CVD risk factor control (blood pressure, lipids, and glycemia [for patients with diabetes mellitus]). We found that equivalent numbers of participants per study arm improved ≥1 CVD control measures (intervention, n=129 [38.9%]; control, n=115 [36.5%]; P=0.54; Table 4). Fewer than 15% of intervention and control participants had 0 care gaps by the end of 12 months follow‐up (intervention, n=45 [13.6%]; control, n=42 [13.3%]; P=0.93). In an exploratory stratified analysis, we found that patients with diabetes mellitus in the intervention group reporting the lowest level of patient activation (patient activation measure ≤47; n=46 [14.8% of intervention patients]) were more likely to achieve HbA1c control relative to similar patients with low activation in the control group after adjusting for baseline HbA1c levels (adjusted odds ratio=5.0; 95% CI 1.2, 20.1; P=0.03). Patient activation level did not appear to modify intervention effects for hyperlipidemia or hypertension control.
Table 4.
Intervention Effects on Clinical and Medication Outcomes at 12 Months
| Outcome | Intervention (n=332) | Control (n=315) | P Valuea |
|---|---|---|---|
| Number of care gaps closed | 0.54 | ||
| None | 203 (61.1) | 200 (63.5) | |
| ≥1 | 129 (38.9) | 115 (36.5) | |
| No care gaps remain at 12 mo | 45 (13.6) | 42 (13.3) | 0.93 |
| Hyperlipidemia | |||
| At goalb | 213 (65.7) | 205 (67.7) | 0.61 |
| LDL cholesterol change, mean±SD mg/dL | −5.7±32.2 | −5.5±26.2 | 0.97 |
| LDL cholesterol not tested by 12 mo | 176 | 147 | |
| Statin adherence ≥80% | 118 (54.1) | 115 (54.0) | 0.93 |
| Statin initiation among participants not on statin at baseline (n=181) | 25 (25.8) | 15 (17.9) | 0.22 |
| Hypertension | |||
| At goalc | 168 (50.6) | 162 (51.4) | 0.83 |
| SBP change, mean±SD mm Hg | −0.3±16.4 | −0.1±16.3 | 0.80 |
| SBP not tested by 12 mo | 22 | 14 | |
| Hypertension medication adherence ≥80% | 170 (66.1) | 172 (68.0) | 0.66 |
| Hypertension medication initiation among n=129 participants not on medication at baseline | 13 (19.4) | 13 (21.0) | 0.93 |
| Diabetes mellitus | |||
| At goald | 110 (35.5) | 119 (39.5) | 0.27 |
| HbA1c change, mean±SD % | −0.2±1.4 | −0.1±1.3 | 0.28 |
| HbA1c not tested by 12 mo | 24 | 11 | |
| Diabetes mellitus medication adherence ≥80% | 216 (75.0) | 217 (78.3) | 0.44 |
| Diabetes mellitus medication initiation among n=39 participants not on medication at baseline | 3 (15.8) | 1 (5.0) | 0.30 |
LDL indicates low‐density lipoprotein; SBP, systolic blood pressure; HbA1c, hemoglobin A1c.
P values are from models that adjust for group and include random intercepts for medical facility.
LDL cholesterol <100 mg/dL or current statin medication.
SBP <140 mm Hg.
HbA1c <8.0%.
Discussion
Patients with cardiovascular disease experience many challenges to achieving guideline concordant care. Prior research has suggested that greater knowledge, skill, and confidence among patients is associated with more positive engagement with health care.37 We tested an evidence‐based intervention (CREATE Wellness) designed to activate and engage patients who have been consistently unable to achieve CVD risk factor control goals. CREATE Wellness participants increased their measured level of patient activation by a clinically significant increment (>3 points, as defined in past studies).38, 39 The CREATE Wellness intervention also increased patients’ engagement with their care team through increased secure electronic messaging with their population health managers and use of the electronic patient portal, 2 behaviors that can facilitate collaborative chronic illness care.
Despite these significant changes, CVD risk factor control did not improve relative to control patients in response to the intervention, underscoring the challenge of improving CVD risk reduction among patients persistently not meeting goals of care. There are several potential reasons why changes in patient activation and care‐seeking behaviors did not translate to the ultimate outcome of improved CVD risk factor control. Patients were already enrolled in a successful disease management program, perhaps reducing the potential impact of an additional intervention. These participants by design had ≥2 years of not reaching treatment goals and, therefore, may have been more intractable to clinical change. Intervention strategies to improve risk factor control in this group may require also engaging other team members, including family, caregivers, and clinicians. Even with greater activation and engagement, patients may still encounter significant structural barriers that prevent fully benefiting from their healthcare system, suggesting that future iterations of this CREATE Wellness approach may need to include additional strategies for making it easier for activated patients to access available clinical and community resources. Future studies could focus on less activated patients given our exploratory finding that HbA1c control improved specifically for intervention participants with the lowest level of activation relative to control participants. Intervention duration may have been inadequate in that the CREATE Wellness intervention was conducted over a 6‐week period for each intervention group. Other research has shown that patients receiving behavior change interventions may require longer‐term “booster” sessions to sustain the intervention effect.40 Finally, the theoretical basis for the intervention may need to include other principles besides increasing patient activation and engagement. Although these processes may increase the subjective experience of patient‐centered care, they may not lead to sufficient changes in self‐management to improve CVD risk factor control. Indeed, we found low rates of medication initiation in the intervention arm, suggesting that future efforts may need to more actively include prescribers in a multi‐faceted intervention.
Cardiovascular disease remains a leading cause of morbidity and mortality.1 Major clinical advances in the field over prior decades—such as the advent of statins and the widespread implementation of evidence‐based care guidelines—have led to significant declines in CVD‐related morbidity and mortality in the United States. One of the major remaining hurdles to further improvement in CVD outcomes is to eliminate the persistent gap between evidence and practice experienced by some patients. Activating these patients to greater engagement in their own care remains one of the most promising strategies for reducing this gap. Our CREATE Wellness intervention provides an important contribution to the literature by demonstrating that a program of 3 group sessions can successfully improve activation and increase participation in care among patients already enrolled in an advanced CVD disease management program. Further work is needed to translate these patient‐centered changes into clinical changes in CVD risk factor management.
Several study limitations merit further discussion. The CREATE Wellness intervention was in‐person and group‐based with 3 scheduled meetings. This structure may have discouraged participation, as seen by the modest enrollment rate after initial phone contact (31%). The results of the current study may therefore not generalize to all patients with poorly controlled CVD risk factors, including those not motivated to attend regular group sessions focused on their health. A promising next step in this line of research will be to incorporate effective online tools (eg, virtual group sessions, monitoring and communication apps) or even non‐technological strategies (home visits, community‐based group sessions) to engage harder‐to‐reach patients.
In this randomized clinical trial, we demonstrated that an intervention approach relying on a small number of patient‐centered group sessions and between‐session individual contacts can improve patients’ activation, healthcare experiences, and engagement with the healthcare system. How to extend these benefits to the improvement of clinical outcomes remains a challenge that may require more intensive and sustained intervention with multiple levels of the overall health system.
Sources of Funding
This work is supported by the National Heart, Lung, and Blood Institute (R01HL117939) and the National Institute of Diabetes and Digestive and Kidney Diseases (K24DK109114). Iturralde was supported by the KPNC Division of Research Delivery Science Fellowship Program.
Disclosures
None.
Acknowledgments
We thank Mindy Boccio and Nora Kurose for help with curriculum development. We also thank our patient participants, CREATE Wellness interventionists, and the care managers and clinical leaders from San Jose, Santa Clara, and Union City/Fremont KPNC facilities for their participation and support.
Iturralde performed data analysis and co‐wrote the manuscript; Sterling contributed to study design and editorial review of the manuscript; Uratsu contributed to study design, data analysis, and editorial review of the manuscript; Mishra contributed to data analysis and editorial review of the manuscript; Ross contributed to study design, and editorial review of the manuscript; Grant obtained funding, designed the study, and wrote the manuscript. Additionally, Grant is the guarantor of this manuscript and takes responsibility for the study design, implementation, and data analysis of this work.
(J Am Heart Assoc. 2019;8:e014021 DOI: 10.1161/JAHA.119.014021.)
References
- 1. Benjamin EJ, Virani SS, Callaway CW, Chamberlain AM, Chang AR, Cheng S, Chiuve SE, Cushman M, Delling FN, Deo R. Heart disease and stroke statistics—2018 update: a report from the American Heart Association. Circulation. 2018;137:e67–e492. [DOI] [PubMed] [Google Scholar]
- 2. Khunti K, Ceriello A, Cos X, De Block C. Achievement of guideline targets for blood pressure, lipid, and glycaemic control in type 2 diabetes: a meta‐analysis. Diabetes Res Clin Pract. 2018;137:137–148. [DOI] [PubMed] [Google Scholar]
- 3. Shah SJ, Stafford RS. Patterns of systolic blood pressure control in the United States, 2016. J Gen Intern Med. 2018;33:1224–1226. [DOI] [PMC free article] [PubMed] [Google Scholar]
- 4. Wall HK, Ritchey MD, Gillespie C, Omura JD, Jamal A, George MG. Vital signs: prevalence of key cardiovascular disease risk factors for Million Hearts 2022—United States, 2011–2016. MMWR Morb Mortal Wkly Rep. 2018;67:983. [DOI] [PMC free article] [PubMed] [Google Scholar]
- 5. Wong K, Smalarz A, Wu N, Boulanger L, Wogen J. The association between hypertension‐specific care management processes and blood pressure outcomes in US‐based physician organizations. J Am Soc Hypertens. 2011;5:505–512. [DOI] [PubMed] [Google Scholar]
- 6. Grant RW, Cagliero E, Sullivan CM, Dubey AK, Estey GA, Weil EM, Gesmundo J, Nathan DM, Singer DE, Chueh HC. A controlled trial of population management: diabetes mellitus: putting evidence into practice (DM‐PEP). Diabetes Care. 2004;27:2299–2305. [DOI] [PubMed] [Google Scholar]
- 7. Peek C, Baird MA, Coleman E. Primary care for patient complexity, not only disease. Fam Syst Health. 2009;27:287. [DOI] [PubMed] [Google Scholar]
- 8. Hibbard JH, Stockard J, Mahoney ER, Tusler M. Development of the Patient Activation Measure (PAM): conceptualizing and measuring activation in patients and consumers. Health Serv Res. 2004;39:1005–1026. [DOI] [PMC free article] [PubMed] [Google Scholar]
- 9. Wagner EH, Austin BT, Von Korff M. Organizing care for patients with chronic illness. Milbank Q. 1996;74:511–544. [PubMed] [Google Scholar]
- 10. Greene J, Hibbard JH, Sacks R, Overton V. When seeing the same physician, highly activated patients have better care experiences than less activated patients. Health Aff (Millwood). 2013;32:1299–1305. [DOI] [PubMed] [Google Scholar]
- 11. Maeng DD, Martsolf GR, Scanlon DP, Christianson JB. Care coordination for the chronically ill: understanding the patient's perspective. Health Serv Res. 2012;47:1960–1979. [DOI] [PMC free article] [PubMed] [Google Scholar]
- 12. Alexander JA, Hearld LR, Mittler JN, Harvey J. Patient–physician role relationships and patient activation among individuals with chronic illness. Health Serv Res. 2012;47:1201–1223. [DOI] [PMC free article] [PubMed] [Google Scholar]
- 13. Parchman ML, Zeber JE, Palmer RF. Participatory decision making, patient activation, medication adherence, and intermediate clinical outcomes in type 2 diabetes: a STARNet study. Ann Fam Med. 2010;8:410–417. [DOI] [PMC free article] [PubMed] [Google Scholar]
- 14. Hochhalter AK, Song J, Rush J, Sklar L, Stevens A. Making the most of your healthcare intervention for older adults with multiple chronic illnesses. Patient Educ Couns. 2010;81:207–213. [DOI] [PubMed] [Google Scholar]
- 15. Deen D, Lu W‐H, Rothstein D, Santana L, Gold MR. Asking questions: the effect of a brief intervention in community health centers on patient activation. Patient Educ Couns. 2011;84:257–260. [DOI] [PubMed] [Google Scholar]
- 16. Karter AJ, Moffet HH, Liu J, Parker MM, Ahmed AT, Ferrara A, Selby JV. Achieving good glycemic control: initiation of new antihyperglycemic therapies in patients with type 2 diabetes from the Kaiser Permanente Northern California Diabetes Registry. Am J Manag Care. 2005;11:262–270. [PMC free article] [PubMed] [Google Scholar]
- 17. Jaffe MG, Lee GA, Young JD, Sidney S, Go AS. Improved blood pressure control associated with a large‐scale hypertension program. JAMA. 2013;310:699–705. [DOI] [PMC free article] [PubMed] [Google Scholar]
- 18. Miller‐Rosales C, Sterling SA, Wood SB, Ross T, Makki M, Zamudio C, Kane IM, Richardson MC, Samayoa C, Charvat‐Aguilar N, Lu WY, Vo M, Whelan K, Uratsu CS, Grant RW. CREATE Wellness: a multi‐component behavioral intervention for patients not responding to traditional cardiovascular disease management. Contemp Clin Trials Commun. 2017;8:140–146. [DOI] [PMC free article] [PubMed] [Google Scholar]
- 19. Chin MH, Drum ML, Jin L, Shook ME, Huang ES, Meltzer DO. Variation in treatment preferences and care goals among older diabetes patients and their physicians. Med Care. 2008;46:275. [DOI] [PMC free article] [PubMed] [Google Scholar]
- 20. Frosch DL, Rincon D, Ochoa S, Mangione CM. Activating seniors to improve chronic disease care: results from a pilot intervention study. J Am Geriatr Soc. 2010;58:1496–1503. [DOI] [PMC free article] [PubMed] [Google Scholar]
- 21. Grant RW, Wald JS, Schnipper JL, Gandhi TK, Poon EG, Orav EJ, Williams DH, Volk LA, Middleton B. Practice‐linked online personal health records for type 2 diabetes mellitus: a randomized controlled trial. Arch Intern Med. 2008;168:1776–1782. [DOI] [PMC free article] [PubMed] [Google Scholar]
- 22. Lubetkin EI, Lu W‐H, Gold MR. Levels and correlates of patient activation in health center settings: building strategies for improving health outcomes. J Health Care Poor Underserved. 2010;21:796–808. [DOI] [PubMed] [Google Scholar]
- 23. Hibbard JH, Greene J. What the evidence shows about patient activation: better health outcomes and care experiences; fewer data on costs. Health Aff (Millwood). 2013;32:207–214. [DOI] [PubMed] [Google Scholar]
- 24. Naik AD, Kallen MA, Walder A, Street RL. Improving hypertension control in diabetes mellitus: the effects of collaborative and proactive health communication. Circulation. 2008;117:1361–1368. [DOI] [PMC free article] [PubMed] [Google Scholar]
- 25. Rask KJ, Ziemer DC, Kohler SA, Hawley JN, Arinde FJ, Barnes CS. Patient activation is associated with healthy behaviors and ease in managing diabetes in an indigent population. Diabetes Educ. 2009;35:622–630. [DOI] [PubMed] [Google Scholar]
- 26. Shively MJ, Gardetto NJ, Kodiath MF, Kelly A, Smith TL, Stepnowsky C, Maynard C, Larson CB. Effect of patient activation on self‐management in patients with heart failure. J Cardiovasc Nurs. 2013;28:20–34. [DOI] [PubMed] [Google Scholar]
- 27. Skolasky RL, Green AF, Scharfstein D, Boult C, Reider L, Wegener ST. Psychometric properties of the Patient Activation Measure among multimorbid older adults. Health Serv Res. 2011;46:457–478. [DOI] [PMC free article] [PubMed] [Google Scholar]
- 28. Weisner CM, Chi FW, Lu Y, Ross TB, Wood SB, Hinman A, Pating D, Satre D, Sterling SA. Examination of the effects of an intervention aiming to link patients receiving addiction treatment with health care: the LINKAGE clinical trial. JAMA Psychiatry. 2016;73:804–814. [DOI] [PMC free article] [PubMed] [Google Scholar]
- 29. Miller W, Rose G. Toward a theory of motivational interviewing. Am Psychol. 2009;64:527–537. [DOI] [PMC free article] [PubMed] [Google Scholar]
- 30. Chew LD, Bradley KA, Boyko EJ. Brief questions to identify patients with inadequate health literacy. Fam Med. 2004;36:588–594. [PubMed] [Google Scholar]
- 31. Kroenke K, Spitzer RL, Williams JB. The PHQ‐9: validity of a brief depression severity measure. J Gen Intern Med. 2001;16:606–613. [DOI] [PMC free article] [PubMed] [Google Scholar]
- 32. Hibbard JH, Mahoney ER, Stockard J, Tusler M. Development and testing of a short form of the Patient Activation Measure. Health Serv Res. 2005;40:1918–1930. [DOI] [PMC free article] [PubMed] [Google Scholar]
- 33. Glasgow RE, Wagner EH, Schaefer J, Mahoney LD, Reid RJ, Greene SM. Development and validation of the Patient Assessment of Chronic Illness Care (PACIC). Med Care. 2005;43:436–444. [DOI] [PubMed] [Google Scholar]
- 34. Andrade SE, Kahler KH, Frech F, Chan KA. Methods for evaluation of medication adherence and persistence using automated databases. Pharmacoepidemiol Drug Saf. 2006;15:565–574. [DOI] [PubMed] [Google Scholar]
- 35. SAS version 9.4. Cary, NC: SAS Institute Inc.; 2016. [Google Scholar]
- 36. StataCorp . Stata Statistical Software: Release 15. College Station, TX: StataCorp, LLC; 2017. [Google Scholar]
- 37. Greene J, Hibbard JH, Sacks R, Overton V, Parrotta CD. When patient activation levels change, health outcomes and costs change, too. Health Aff (Millwood). 2015;34:431–437. [DOI] [PubMed] [Google Scholar]
- 38. Fowles JB, Terry P, Xi M, Hibbard J, Bloom CT, Harvey L. Measuring self‐management of patients’ and employees’ health: further validation of the Patient Activation Measure (PAM) based on its relation to employee characteristics. Patient Educ Couns. 2009;77:116–122. [DOI] [PubMed] [Google Scholar]
- 39. Hibbard JH, Greene J, Shi Y, Mittler J, Scanlon D. Taking the long view: how well do patient activation scores predict outcomes four years later? Med Care Res Rev. 2015;72:324–337. [DOI] [PubMed] [Google Scholar]
- 40. Fleig L, Pomp S, Schwarzer R, Lippke S. Promoting exercise maintenance: how interventions with booster sessions improve long‐term rehabilitation outcomes. Rehabil Psychol. 2013;58:323–333. [DOI] [PubMed] [Google Scholar]